. 2023 Aug;620(7974):516-520.
doi: 10.1038/s41586-023-06317-9. Epub 2023 Jul 24.

Water in the terrestrial planet-forming zone of the PDS 70 disk

Affiliations

Water in the terrestrial planet-forming zone of the PDS 70 disk

G Perotti et al. Nature. 2023 Aug.

Abstract

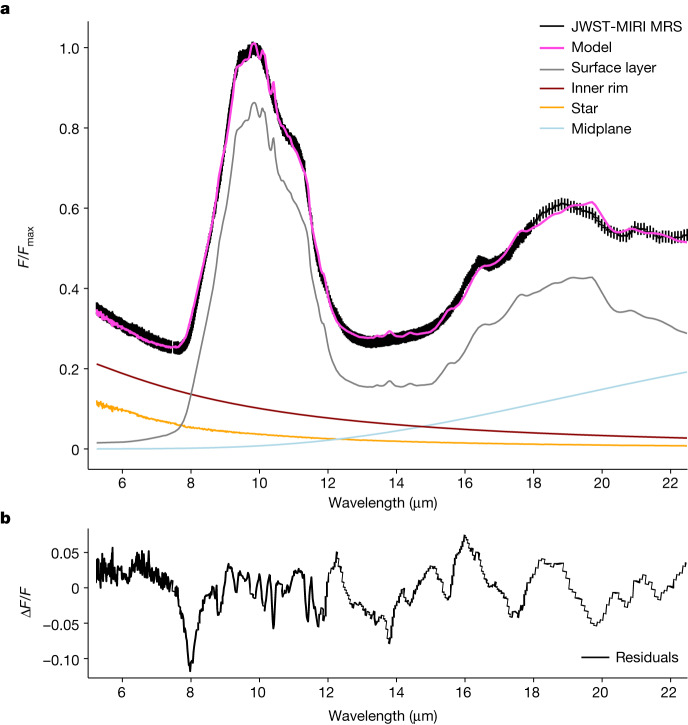
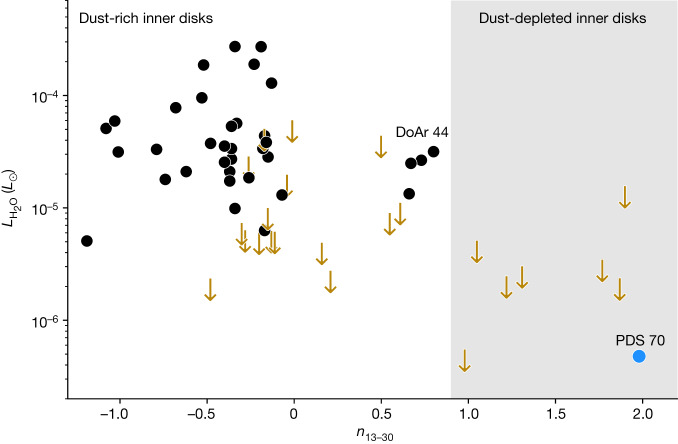
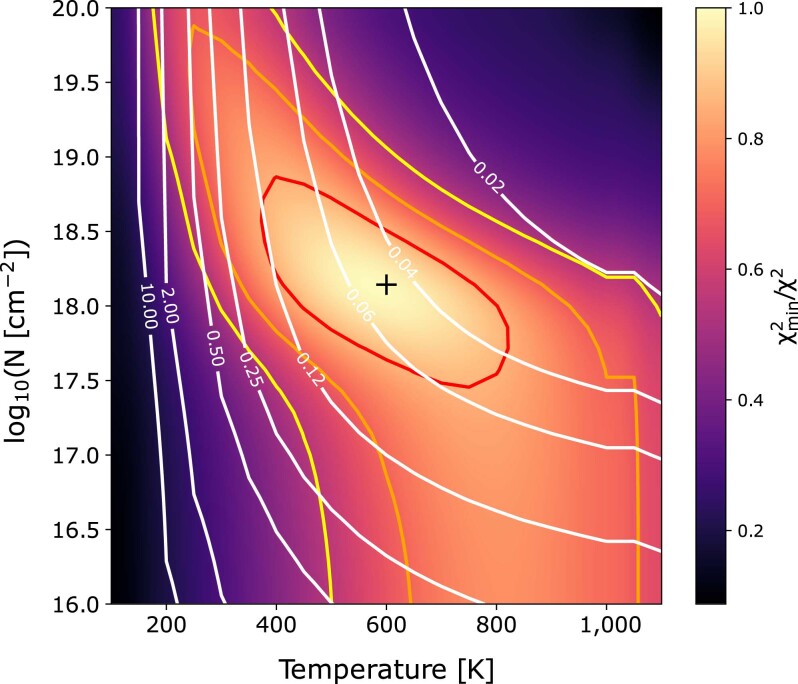
Terrestrial and sub-Neptune planets are expected to form in the inner (less than 10 AU) regions of protoplanetary disks1. Water plays a key role in their formation2-4, although it is yet unclear whether water molecules are formed in situ or transported from the outer disk5,6. So far Spitzer Space Telescope observations have only provided water luminosity upper limits for dust-depleted inner disks7, similar to PDS 70, the first system with direct confirmation of protoplanet presence8,9. Here we report JWST observations of PDS 70, a benchmark target to search for water in a disk hosting a large (approximately 54 AU) planet-carved gap separating an inner and outer disk10,11. Our findings show water in the inner disk of PDS 70. This implies that potential terrestrial planets forming therein have access to a water reservoir. The column densities of water vapour suggest in-situ formation via a reaction sequence involving O, H2 and/or OH, and survival through water self-shielding5. This is also supported by the presence of CO2 emission, another molecule sensitive to ultraviolet photodissociation. Dust shielding, and replenishment of both gas and small dust from the outer disk, may also play a role in sustaining the water reservoir12. Our observations also reveal a strong variability of the mid-infrared spectral energy distribution, pointing to a change of inner disk geometry.


Conflict of interest statement

The authors declare no competing interests.

Figures

Fig. 1
Fig. 1. JWST-MIRI MRS spectrum of PDS 70.
The spectrum is a composite of the colour-coded short, medium and long sub-bands of the four MIRI MRS Integral Field Units (IFUs). The Spitzer-IRS spectrum of PDS 70 is also shown in grey. The major dust features are labelled. The spectrum is dominated by exceptionally prominent silicate emission at 10 and 18 μm and it clearly shows a number of crystalline dust features. The much higher sensitivity and spectral resolution of MIRI MRS compared with Spitzer-IRS allows us to detect an inner disk gas reservoir by showing weak emission of water vapour and carbon dioxide as well as two molecular hydrogen lines. The insets show the ro-vibrational and rotational transitions of ortho- and para-H2O, the molecular hydrogen H2S(1) and S(5) rotational lines, and the ν5 bending mode of CO2.
Fig. 2
Fig. 2. Dust continuum fit to the MIRI spectrum of PDS 70.
a, The disk model has three spectral components: an inner rim, an optically thick midplane disk layer and an optically thin warm disk surface layer. The stellar photospheric emission is represented by a stellar atmosphere model (see Methods for further details). The surface layer component dominates the MIRI spectrum in the 8–22.5 μm wavelength range. Its temperature is constrained to be between 400 and 600 K. The silicate emission at 8–12 μm is consistent with a population of optically thin dust grains with typical sizes of 0.1–2 μm. A significant contribution from an optically thick dust component is excluded because of the high silicate peak/continuum ratio of approximately 4 (ref. ). b, The residuals on the dust continuum fit.
Fig. 3
Fig. 3. Continuum-subtracted spectrum showing H2O emission in the 7 μm region and the best-fit LTE slab model.
The best-fit model (blue) has T = 600 K, N(H2O)= 1.4 × 1018 cm−2 and R = 0.047 au. The molecular hydrogen H2 S(5) line is labelled on top of the spectrum.
Fig. 4
Fig. 4. Comparison between water luminosity and mid-infrared spectral index (n13–30) for a sample of protoplanetary disks.
n13–30 is a diagnostic of the presence and size of inner disk dust cavities: 0.9 < n13–30 < 2.2 corresponds to disks with large gaps and/or cavities,. Black dots represent disks with mid-infrared water detections. Disks for which only upper limits were obtained are shown as gold arrows. The grey shaded area highlights the location of dust-depleted inner disks with PDS 70 shown as a blue dot. The water line flux used to compute the water luminosity of PDS 70 is calculated as described in a previous work. The Spitzer spectrum is used to estimate n13–30 for PDS 70 to be consistent with the other targets. Spitzer-IRS obtained only water luminosity upper limits for disks characterized by n13–30 greater than 0.9. Below 10 μm, IRS provided only a spectral resolution of R  ≈ 100, preventing a comprehensive view of water in the innermost regions. DoAr 44 is a system schematically similar to PDS 70 (ref. ). The two stars have comparable age and spectral types K3 and K7, respectively; DoAr 44 has a higher mass accretion rate of M˙acc108M yr−1 (ref. ). The cavity size of DoAr 44 is 34 au (refs. ,), which is smaller than that of PDS 70 (approximately 54 au (ref. )). Both systems have small inner disks based on VLTI-GRAVITY, VLT-SPHERE and ALMA data,, and in both systems the water emission is contained to within 1 au (ref. ). The water luminosity of PDS 70 is two orders of magnitude weaker than that of DoAr 44, pointing to a colder water reservoir in PDS 70. This is consistent with the lower luminosity and lower accretion rate of PDS 70.
Extended Data Fig. 1
Extended Data Fig. 1. The architecture of the PDS 70 system.
a, Schematic representation of the locations of the inner and outer disk of PDS 70 indicated as teal and blue ellipses. The protoplanets PDS 70 b and PDS 70 c are shown as blue dots. b, Main components of the schematic of the system on top of a MIRI-MRS IFU image at 7.0 μm, illustrating the size of the system with respect to the 2.5-FWHM aperture used for spectro-photometric extraction (white circle). The latter linearly increases with wavelength.
Extended Data Fig. 2
Extended Data Fig. 2. Local continuum fit used in the spectrum presented in Fig. 3.
a, The selected continuum points are displayed as red dots and the interpolated continuum is shown as a red line. b, The continuum-subtracted spectrum.
Extended Data Fig. 3
Extended Data Fig. 3. Correction for the photospheric emission.
a, Comparison between the MIRI-MRS spectrum (black) and the spectrum corrected for the stellar photosphere (orange). Both spectra are continuum subtracted. b, The residuals show that the contamination from the stellar photosphere is negligible in the observed spectrum.
Extended Data Fig. 4
Extended Data Fig. 4. χ2 map for the fit of the 7 μm region of the H2O bending mode.
The best-fit model is represented by a black plus. The 1σ, 2σ, and 3σ confidence intervals are shown in red, orange, and yellow, respectively, for a typical noise level of σ = 0.15 mJy. The best-fitting emitting radius R for all values of N and T is indicated as white lines. In general, we find a degeneracy between a high T and low N solution, and a low T and high N solution. Within the framework of our LTE slab model, the data indicate mildly optically thick H2O emission at a temperature of about 600 K.
Extended Data Fig. 5
Extended Data Fig. 5. Continuum-subtracted spectrum in the 15 μm region showing the detected Q-branch of CO2 (orange).
The shape of this feature is sensitive to temperature and is well-fitted by an LTE slab model with T  ≃ 200 K. The strength of this feature can be reproduced with N(CO2) = 1.5 × 1017 cm−2 and R = 0.1 au. However, the aforementioned parameters are degenerate and are used for illustrative purposes only. Rotational lines of H2O (J = 145 10 − 132 11, J = 146 9 − 133 10; Eu ~ 4300 K) are also detected and they are reasonably well reproduced by the best-fit model for the 7 μm region (blue). This could indicate that there is no additional reservoir of water at cooler temperature.
Extended Data Fig. 6
Extended Data Fig. 6. WISE Time-series photometry of PDS 70. Errorbars represent 1 s.d.
ab, WISE 3 (W3) is not anticorrelated with WISE 1 and WISE 2 due to the dominant 10 μm silicate emission which does not vary substantially throughout different epochs. c−d, Anticorrelations are observed for WISE 1, WISE 2 and WISE 4 indicating a ’seesaw’-like time variability (see Methods for further details).

References

    1. Mulders GD, Pascucci I, Apai D, Ciesla FJ. The Exoplanet Population Observation Simulator. I. The inner edges of planetary systems. Astron. J. 2018;156:24. doi: 10.3847/1538-3881/aac5ea. - DOI
    1. Ciesla FJ, Cuzzi JN. The evolution of the water distribution in a viscous protoplanetary disk. Icarus. 2006;181:178–204. doi: 10.1016/j.icarus.2005.11.009. - DOI
    1. Eistrup C, Henning T. Chemical evolution in ices on drifting, planet-forming pebbles. Astron. Astrophys. 2022;667:A60. doi: 10.1051/0004-6361/202243982. - DOI
    1. Krijt, S. et al. Chemical habitability: supply and retention of life’s essential elements during planet formation. Preprint https://arxiv.org/abs/2203.10056 (2022).
    1. Bethell T, Bergin E. Formation and survival of water vapor in the terrestrial planet-forming region. Science. 2009;326:142–153. doi: 10.1126/science.1176879. - DOI - PubMed