. 2023 Aug;4(8):1138-1156.
doi: 10.1038/s43018-023-00599-8. Epub 2023 Jul 24.

Single-cell analyses implicate ascites in remodeling the ecosystems of primary and metastatic tumors in ovarian cancer

Affiliations

Single-cell analyses implicate ascites in remodeling the ecosystems of primary and metastatic tumors in ovarian cancer

Xiaocui Zheng et al. Nat Cancer. 2023 Aug.

Abstract

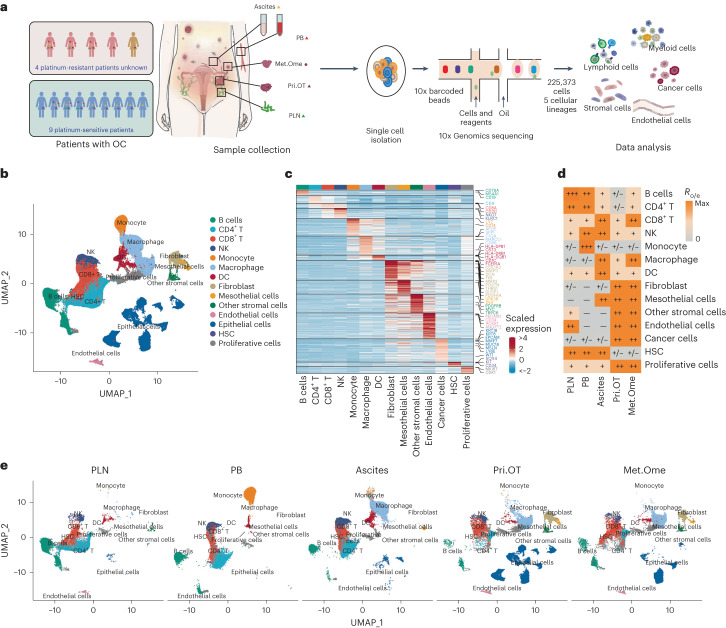
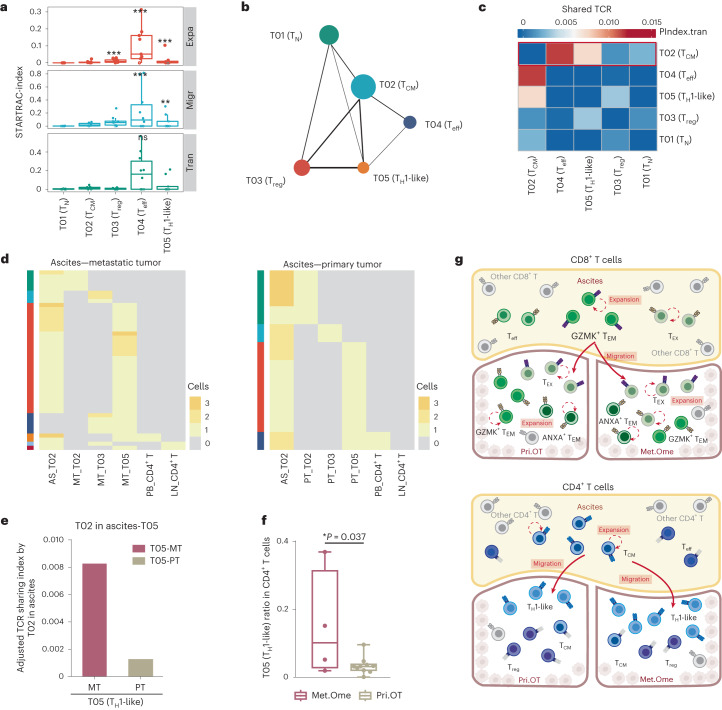
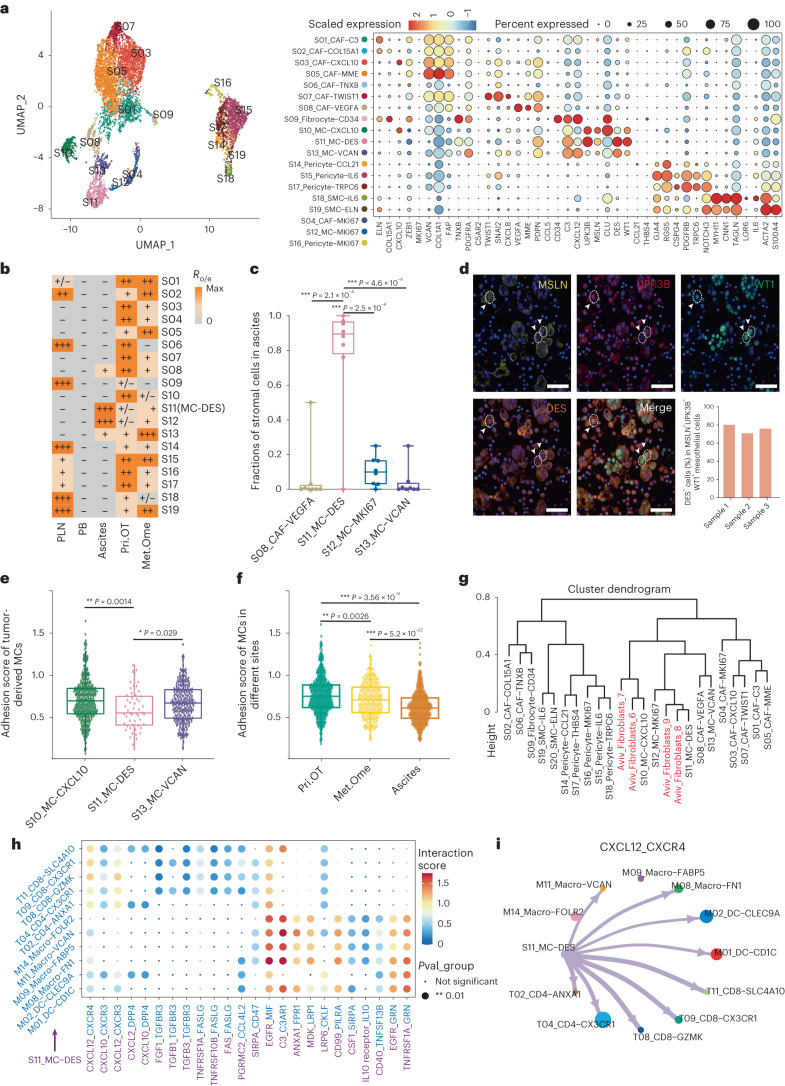
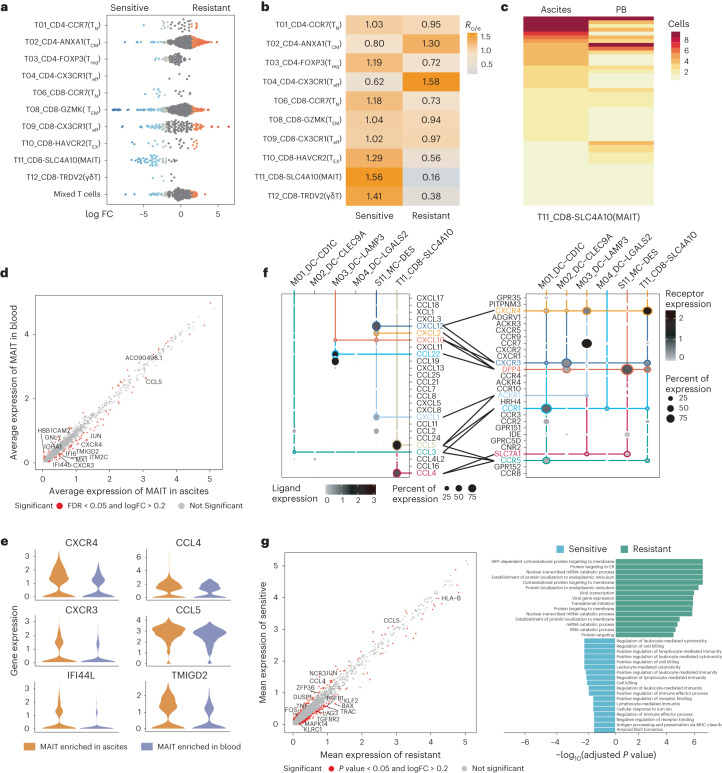
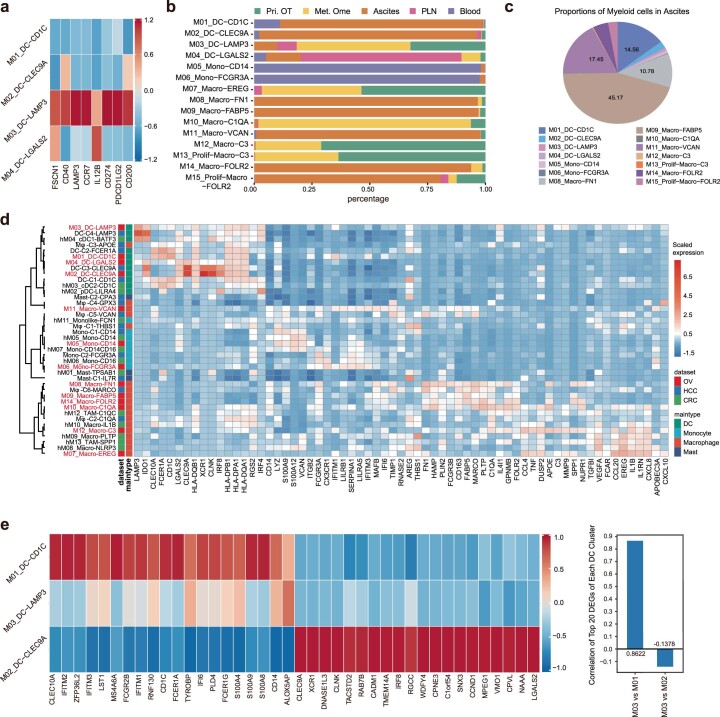
Ovarian cancer (OC) is an aggressive gynecological tumor usually diagnosed with widespread metastases and ascites. Here, we depicted a single-cell landscape of the OC ecosystem with five tumor-relevant sites, including omentum metastasis and malignant ascites. Our data reveal the potential roles of ascites-enriched memory T cells as a pool for tumor-infiltrating exhausted CD8+ T cells and T helper 1-like cells. Moreover, tumor-enriched macrophages exhibited a preference for monocyte-derived ontogeny, whereas macrophages in ascites were more of embryonic origin. Furthermore, we characterized MAIT and dendritic cells in malignant ascites, as well as two endothelial subsets in primary tumors as predictive biomarkers for platinum-based chemotherapy response. Taken together, our study provides a global view of the female malignant ascites ecosystem and offers valuable insights for its connection with tumor tissues and paves the way for potential markers of efficacy evaluation and therapy resistance in OC.


Conflict of interest statement

Z.H. is an employee of Analytical Biosciences. Z.Z. is a founder of Analytical Biosciences. All financial interests are unrelated to this study. The remaining authors declare no competing interests.

Figures

Fig. 1
Fig. 1. Landscape of advanced ovarian cancer via scRNA-seq of five sites.
a, Overall study design with flowchart of sample collection and single-cell analysis of OC by 10x Genomics sequencing. n = 14 patients with OC who were responsive or nonresponsive to platinum-based chemotherapy were recruited to our study. In total, n = 39 samples, including n = 6 PB, n = 5 PLN, n = 13 Pri.OT, n = 5 matched Met.Ome and n = 10 ascites samples were analyzed. Each dot corresponds to one sample, colored by sample types. Red triangle, orange triangle, dark red circle, dark red triangle, green triangle represent blood, ascites, primary tumor, omentum metastases and pelvic lymph node, respectively. b, Uniform Manifold Approximation and Projection (UMAP) plot showing 14 clusters of n = 10 patients with HGSOC identified by integrated analysis. Each dot corresponds to a single cell, colored by clusters. NK, natural killer; HSC, hematopoietic stem cell. c, Heat map depicting expression levels of selected highly expressed genes (including marker genes) across major clusters of HGSOC. Rows represent genes and columns represent clusters. d, Tissue preference of each major cluster in HGSOC estimated by Ro/e. e, UMAP plots showing the distinct cell composition of five different sample sites in patients with HGSOC. For be, a total of n = 31 HGSOC samples, including n = 5 PB, n = 4 PLN, n = 10 Pri.OT, n = 4 Met.Ome and n = 8 ascites samples were analyzed. Source data
Fig. 2
Fig. 2. Characterization of T cell clusters and dynamics of CD8+ T cells in HGSOC.
a, UMAP plots showing 12 clusters of T cells and clonal T cells within each cluster, colored by clusters. b, Tissue preference of each T cell cluster estimated by Ro/e. c, Clonal expansion, migration and transition potential of CD8+ T cells quantified by STARTRAC indices. Indices were quantified for n = 9 patients with more than two matched samples. Center line indicates the median value, lower and upper hinges represent the 25th and 75th percentiles, respectively and whiskers denote 1.5 × interquartile range. *P < 0.05, **P < 0.01, ***P < 0.001; permutation test (exact P values are provided in source data). d, PAGA analysis of CD8+ T cells. Each dot represents a T cell cluster. e, Heat map showing the developmental transition potential between CD8+ T cells quantified by pairwise STARTRAC-tran indices. The horizontal red box represents the transition between GZMK+ TEM and other CD8+ T cells and the vertical red box refers to the transition between other CD8+ T cells and TEX cells. f, Bar plots showing proportions of shared TCRs between GZMK+ TEM (T08) and ANXA2+ TEM (T07) (left) or TEX (T10) (right) corrected by cell numbers of ANXA2+ TEM (T07) or TEX (T10) in sampled tissues, respectively. g, Bar plots showing proportions of shared TCRs between GZMK+ TEM (T08) and ANXA2+ TEM (T07) (top) or TEX (T10) (bottom) corrected by cell numbers of GZMK+ TEM (T08) in ascites. h, The distribution of clonal clonotypes in indicated CD8+ subsets derived from ascites and two tumor sites. For a,b,d, data were summarized from all n = 31 HGSOC samples. For c,eh, all n = 30 HGSOC samples except for the primary tumor sample of HGSOC7 were analyzed. AS, ascites; PT, primary ovarian tumor; MT, omentum metastatic tumor. Source data
Fig. 3
Fig. 3. Characterization and dynamics of CD4+ T cells in HGSOC.
a, Clonal expansion, migration and transition potential of CD4+ T cells quantified by STARTRAC indices. Indices were quantified for each n = 9 patient with more than two matched samples. Center line indicates the median value, lower and upper hinges represent the 25th and 75th percentiles, respectively and whiskers denote 1.5 × interquartile range. *P < 0.05, **P < 0.01, ***P < 0.001; permutation test (exact P values are provided in source data). b, PAGA analysis of CD4+ T cells. Each dot represents a T cell cluster. In total n = 31 HGSOC samples were used for analysis. c, Heat map showing the developmental transition potential between CD4+ T cells quantified by pairwise STARTRAC-tran indices. The red box represents the transition between TCM and other CD4+ T cells. d, The distribution of clonal clonotypes in indicated CD4+ subsets derived from ascites and two tumor sites. e, Bar plots showing proportions of shared TCRs between TCM (T02) and TH1-like cells (T05) corrected by cell numbers of TCM (T02) in ascites, related to Extended Data Fig. 5e. f, Frequency of TH1-like cells as a proportion of all CD4+ T cells in n = 4 Met.Ome and n = 10 Pri.OT samples from ten patients with HGSOC. Center line indicates the median value, lower and upper hinges represent the 25th and 75th percentiles, respectively and whiskers indicates min to max. *P < 0.05, **P < 0.01, ***P < 0.001; unpaired two-sided t-test. g, Sketch map showing the dynamics of CD8+ T cells (top) and CD4+ T cells (bottom) between ascites and two tumor sites. For a,ce, data were summarized from all n = 30 HGSOC samples except for the primary tumor sample of HGSOC7. Source data
Fig. 4
Fig. 4. Two distinct functional states of tumor-enriched and ascites-enriched macrophages in HGSOC.
a, UMAP projection of 15 myeloid clusters colored by clusters (left) and heat map showing expression patterns of selected genes across indicated clusters (right). b, Tissue preference of each myeloid cluster estimated by the Ro/e. c, Hierarchical clustering comparing the similarity of myeloid cell clusters in our dataset (OC) with those reported in CRC and HCC. Clusters were colored by dataset. n = 3 tumor types were used for analysis. d, Frequency of DC subclusters as a proportion of all DCs in ascites from n = 6 platinum-sensitive patients and n = 2 platinum-resistant patients. Center line indicates the median value, bottom and top hinges represent the 25th and 75th percentiles, respectively and whiskers denote 1.5 × interquartile range. *P < 0.05, **P < 0.01, ***P < 0.001; two-sided t-test. e, Differentially expressed genes between TeMs (M07, M10 and M12) and AeMs (M08, M09, M11 and M14) (left). P value < 0.05; two-sided Wilcoxon test adjusted by the Benjamini–Hochberg (BH) procedure; log2(FC) > 0.5. n = 10 primary tumor, n = 4 matched omentum metastatic tumor and n = 8 ascites samples from ten patients with HGSOC were used for analysis. IFN, interferon; FDR, false discovery rate; FC, fold change. f, Dot plot showing the mean interaction strength for selected ligand–receptor pairs among macrophages and T cell clusters in tumors. Dot size indicates percentage of ligand–receptor expression in cells of one cluster, colored by average ligand–receptor expression level. n = 10 primary tumor and n = 4 matched omentum metastatic tumor from ten patients with HGSOC were used for analysis. For a,b, data were summarized from all n = 31 HGSOC samples. Source data
Fig. 5
Fig. 5. Two different origins of tumor-enriched and ascites-enriched macrophages in HGSOC.
a, Bar plot showing the mean expression levels of tissue-resident marker genes in all macrophage clusters. Center line indicates the median value, lower and upper hinges represent the 25th and 75th percentiles, respectively and whiskers denote 1.5 × interquartile range. *P < 0.05, **P < 0.01, ***P < 0.001, two-sided t-test, adjusted by the BH procedure. b, Expression levels of tissue-resident relevant genes in seven macrophage clusters. Rows represent clusters and columns represent genes. c, Quantification of tdTomato or tdTomato+ macrophages as a percentage of total CD163+ TIM4+ RTMs in n = 4 independent experiments using n = 4 mice ascites samples, related to Extended Data Fig. 7d. Center line indicates the median value, bottom and top hinges represent the 25th and 75th percentiles, respectively and whiskers indicates min to max. *P < 0.05, **P < 0.01, ***P < 0.001, unpaired two-sided t-test. d, Differentially expressed genes (left) and differentially activated pathways (right) between tissue-resident macrophages (M10) versus monocyte-derived macrophages (M07) in tumor sites (left). Genes, P value < 0.05, two-sided Wilcoxon test adjusted by the BH procedure; log2(fold change) > 0.5. Pathways, Gene Ontology (GO), adjusted P value by the BH procedure <0.05. n = 10 primary tumor and n = 4 matched omentum metastatic tumor from ten patients with HGSOC were used for analysis. e, Heat map showing expression levels of tissue-resident marker genes in macrophages of mouse ascites using ascites samples from n = 4 mice. AeEM, ascites-enriched embryonic macrophage; AeMM, ascites-enriched monocyte-derived macrophage. Rows represent repetitive samples and columns represent genes. For a,b, data were summarized from all n = 31 HGSOC samples. Source data
Fig. 6
Fig. 6. Characterization of stromal cell clusters of HGSOC, especially DES+ mesothelial cells in ascites.
a, UMAP projection of 19 stromal cell clusters colored by clusters (left) and heat map showing expressions of selected genes across indicated clusters (right). b, Tissue preference of each stromal cell cluster estimated by the ratio of observed to expected cell numbers (Ro/e). c, Frequency of each ascites-enriched stromal cell cluster as a proportion of all stromal cells in ascites, n = 8 ascites samples were analyzed. Center line indicates the median value, bottom and top hinges represent the 25th and 75th percentiles, respectively and whiskers indicates min to max. *P < 0.05, **P < 0.01, ***P < 0.001, unpaired two-sided t-test. d, Representative example of ascites cell precipitation from one patient with HGSOC stained by multicolored immunohistochemistry and the corresponding quantification plot. Original magnification, ×20; scale bar, 50 μm. n = 3 individual patient samples were examined independently. e,f, Bar plots showing the geometric mean expression levels of adhesion-associated genes in three mesothelial cell clusters from a total of n = 14 HGSOC tumor samples (e) or in all mesothelial cells in n = 10 primary tumor, n = 4 omentum metastasis and n = 8 ascites from ten patients with HGSOC, respectively (f). Center line indicates the median value, bottom and top hinges represent the 25th and 75th percentiles, respectively and whiskers denote 1.5 × interquartile range. *P < 0.05, **P < 0.01, ***P < 0.001, two-sided Wilcoxon test. Each dot corresponds to a single cell. g, Hierarchical clustering comparing the similarity of stromal cell clusters in our dataset with those reported in OC ascites by Aviv. The clusters in black font were detected in our dataset. h, Bubble heat map showing the mean interaction strength for selected ligand–receptor pairs between DES+ mesothelial cells and various immune cell clusters. Dot size indicates P value generated by permutation test, colored by interaction strength levels. DES+ MCs were cells providing ligands. i, Chord diagram showing predicted cell–cell interactions of CXCL12CXCR4 ligand pair between DES+ mesothelial cells and various immune cell clusters in ascites. The arrow width indicates the interaction strength levels. For a,b,h,i, all n = 31 HGSOC samples were analyzed. Source data
Fig. 7
Fig. 7. Characterization of endothelial cell phenotypes within two tumor sites in HGSOC.
a, UMAP projection of eight endothelial cell clusters colored by clusters (left) and heat map showing expression patterns of selected genes across indicated clusters (right). b, Bar plot showing the geometric mean expression levels of tip-like genes (referred to in Extended Data Fig. 9b) in eight endothelial cell (EC) clusters. Each dot corresponds to a single cell. Center line indicates the median value, bottom and top hinges represent the 25th and 75th percentiles, respectively and whiskers denote 1.5 × interquartile range. c, Frequency of each endothelial cluster as a proportion of all endothelial cells in n = 10 primary tumor samples from ten patients with HGSOC. The center line indicates the median value, bottom and top hinges represent the 25th and 75th percentiles, respectively and whiskers indicates min to max. Each dot corresponds to one sample. d, PAGA analysis of endothelial cells. Each dot represents a cell cluster. e, Frequency of E02 (left) and E06 (right) cluster as a proportion of all endothelial cells in ten primary tumor samples from n = 7 platinum-sensitive and n = 3 platinum-resistant patients. Center line indicates the median value, bottom and top hinges represent the 25th and 75th percentiles, respectively and whiskers denote 1.5 × interquartile range. *P < 0.05, **P < 0.01, ***P < 0.001; two-sided t-test. f, Differentially expressed genes between E02 and E06 cluster. P value < 0.05; two-sided Wilcoxon test adjusted by the BH procedure; log2(FC) > 0.5. g, Differentially activated pathways between E02 and E06 cluster. GO, adjusted P value by the BH procedure <0.05. h, The Kaplan–Meier overall survival curves of patients with HGSOC grouped by the gene signature expression of IL13RA1+ ENDO cells. HR, hazard ratio. Multivariate Cox regression. P value was determined by Kaplan–Meier survival curves and log-rank test. For a,b,d,f,g, all n = 31 samples from ten patients with HGSOC were used for analysis. Source data
Fig. 8
Fig. 8. MAIT cells in ascites predict the chemotherapy efficacy of patients with HGSOC.
a, UMAP plot showing the distribution preference of MAIT cells in eight ascites samples from n = 6 platinum-responsive and n = 2 nonresponsive patients as calculated by Milo. Each dot represents a single cell. b, The treatment-sensitivity preference (responsive or nonresponsive to platinum-based chemotherapy) of each T cell cluster estimated by Ro/e score. n = 8 ascites samples from n = 6 platinum-responsive and n = 2 nonresponsive patients with HGSOC were used for analysis. c, The distribution of clonal clonotypes within the MAIT cluster in ascites and PB. Each row represents an individual clonotype. d, Volcano plot showing differentially expressed genes between MAIT cells in ascites versus PB. Genes, P value < 0.05, two-sided Wilcoxon test adjusted by the BH procedure; log2(FC) > 0.2. e, Violin plots showing the expression levels of selected genes in MAIT cells derived from ascites and PB. f, Dot plot showing the mean interaction strength for selected ligand–receptor pairs among major immune and stromal cell clusters in ascites. n = 8 HGSOC ascites samples were analyzed. Dot size indicates percentage of ligand–receptor expression in cells of one cluster, colored by average ligand–receptor expression levels. g, Differentially expressed genes (left) and differentially activated pathways (right) between ascites-derived MAIT cells of n = 6 responsive versus n = 2 nonresponsive patients with HGSOC. SRP, signal recognition particle; ER, endoplasmic reticulum. Genes, P value < 0.05, two-sided Wilcoxon test adjusted by the BH procedure; log2(FC) > 0.2. Pathways, GO, adjusted P value by the BH procedure < 0.05. For ce, all n = 8 ascites sample and n = 5 blood samples from patients with HGSOC were used for analysis. Source data
Extended Data Fig. 1
Extended Data Fig. 1. Basic information of 14 major clusters in OC.
a, UMAP plots showing 14 clusters of other OC subtypes identified by integrated analysis. Data were summarized from n = 4 patients of other ovarian tumor types. OCCC1: Ovarian clear cell carcinomas, ECO1: Endometrioid carcinoma of the ovary, UOC1: Undifferentiated ovarian cancer, C1: ovarian carcinosarcoma. Each dot corresponds to a single cell, colored by clusters. b, UMAP plots showing expression levels of highly expressed genes (including cluster-specific marker genes) in 14 major cell clusters using data of HGSOC patients. c, Heat map depicting selected activated pathways across major clusters using data of HGSOC patients. Rows represent pathways and columns represent clusters. Pathways, GO, adjusted P value by Benjamini-Hochberg (BH) procedure < 0.05. d, Tissue distribution of detected cells in each n = 10 HGSOC patient, colored by tissues. e, Patient distribution (upper) and tissue distribution (lower) of each major cluster detected in n = 10 HGSOC patients, colored by clusters. For b-e, totally n = 31 HGSOC samples including n = 5 peripheral blood, n = 4 pelvic lymph node (PLN), n = 10 primary ovarian tumor (Pri.OT), n = 4 matched omentum metastatic tumor (Met.Ome), and n = 8 ascites samples were used for analysis. Source data
Extended Data Fig. 2
Extended Data Fig. 2. Clustering and characterization of malignant cells in all OC patients.
a, UMAP plot showing 22 epithelial clusters identified by integrated analysis. Each dot corresponds to a single cell, colored by clusters. b, Patient distribution of each epithelial cell cluster, colored by patients. c, Heat map showing large-scale inferred copy number variations (inferCNV) for individual cells in 22 epithelial clusters (row) based on the average expression of 100 genes surrounding each chromosomal position (column), compared to non-cancer clusters as a reference. CNVs in red indicates amplifications, and blue indicates deletions. d, Proportion of each major cluster in ascites of each patient, colored by major clusters. Malignant epithelial cells were confirmed by inferCNV, referred by Extended Data Fig. 2c. e, Heat map showing inferCNV for individual epithelial cells from patient HGSOC6. CNVs in red indicates amplifications, and blue indicates deletions. For a-d, totally n = 39 samples from patients with all ovarian tumor types were used for analysis, including n = 6 peripheral blood, n = 5 pelvic lymph node (PLN), n = 13 primary ovarian tumor (Pri.OT), n = 5 matched omentum metastatic tumor (Met.Ome), and n = 10 ascites samples.
Extended Data Fig. 3
Extended Data Fig. 3. Gene expression, tissue distribution and clonal types of T-cell clusters.
a, Heatmap showing selected highly expressed genes of 12 T cell clusters. Rows represent genes and columns represent clusters. b, UMAP plots showing selected marker genes of 12 T cell clusters. Each dot corresponds to a single cell. c, Tissue distribution of each T cell cluster, colored by different tissues (upper) and clusters (lower). d, Representative flow-cytometric plots, and summary data of frequency of CD25+ CD127+ CD4+ T cells (Treg) and PD-1+ CD8+ T cells in the microenvironment of n = 5 primary tumors, n = 5 matched omentum metastasis and n = 5 ascites samples from 5 HGSOC patients. P values were determined by paired one-sided t-test. *P < 0.05, **P < 0.01, ***P < 0.001. e, Violin plots showing the differentially expressed genes of two CD8+ Tem clusters with distinct tissue preference. CD8-ANXA2 was enriched in tumor sites and CD8-GZMK was enriched in ascites. f, The proportion of each T cell clonotype in each T cell cluster (upper) and tissue distribution of each clonotype (lower), colored by clonotypes. g, The proportion of clonal T cells in each cluster and different tissues, each color represents a patient diagnosed with HGSOC. AS: ascites, PT: primary ovarian tumor, MT: metastatic ovarian tumor, PB: peripheral blood, LN: lymph node. For a-c and e-g, data were summarized from all n = 31 HGSOC samples. Source data
Extended Data Fig. 4
Extended Data Fig. 4. CD8+ T cell analyses based on integrated expression and TCR clonality.
a, Migration potential of CD8+ T cell clusters across different tissues quantified by pairwise STARTRAC-migr indices. Data were presented as mean value. *P < 0.05, **P < 0.01, ***P < 0.001, permutation test (exact P values were provided in source data). b, UMAP plot showing the developmental trajectories of CD8+ T cells by Palantir analysis. Each dot corresponds to a single cell, each color represents a T cell cluster. The arrow represents the direction of cell differentiation with naïve T cells as initial cluster. Data were summarized from all n = 31 HGSOC samples. c, pSTARTRAC-tran indices of CD8-ANXA2, CD8-CX3CR1, CD8-HAVCR2 and CD8-GZMK cells for each n = 9 HGSOC patient with matched tissue samples, depicted by dots. Center line indicates the median value, lower and upper hinges represent the 25th and 75th percentiles, respectively, and whiskers denote 1.5× interquartile range. Ns non-significant, *P < 0.05, **P < 0.01, ***P < 0.001, Kruskal–Wallis test. d, Diagram showing the proportions of TCR clones shared by ascites Tem (T08) and Tex cells (T10) from metastatic tumor (MT) or primary tumor (PT) which could be detected in blood or lymph node-derived T cells, related to Fig. 2h. e, Heatmap showing the shared TCRs between ascites-derived Tem (T08), and blood or lymph node-derived CD8+ T cells. For a and c-e, all n = 30 HGSOC samples except for the primary tumor sample of HGSOC7 were used for analysis. AS: ascites, PT: primary ovarian tumor, MT: omentum metastatic tumor, PB: peripheral blood, LN: pelvic lymph node. Source data
Extended Data Fig. 5
Extended Data Fig. 5. CD4+ T cell analyses based on integrated expression and TCR clonality.
a, UMAP plot showing the developmental trajectories of CD4+ T cells by Palantir analysis. Each dot corresponds to a single cell, each color represents a T cell cluster. The arrow represents the direction of cell differentiation with naïve T cells as initial cluster. Data were summarized from all n = 31 HGSOC samples. b, pSTARTRAC-tran indices of CD4-ANXA1, CD4-CX3CR1 and CD4-CXCL13 cells for each n = 9 HGSOC patient with matched tissue samples, depicted by dots. Center line indicates the median value, lower and upper hinges represent the 25th and 75th percentiles, respectively, and whiskers denote 1.5× interquartile range. Ns non-significant, *P < 0.05, **P < 0.01, ***P < 0.001, Kruskal–Wallis test. c, The distribution of clonal clonotypes in indicated CD4+ T subsets (T02, T03 and T05), related to Fig. 3c. d, Venn diagram showing the quantification of shared TCR between indicated CD4+ T subsets referred as in Extended Data Fig. 5c. e, Heatmap showing TCR sharing patterns between Th1-like (T05) and Tcm (T02) in different tissues, including ascites, Pri.OT (primary tumor) and Met.Ome (omentum metastasis). For b-e, all n = 30 HGSOC samples except for the primary tumor sample of HGSOC7 were used for analysis. Source data
Extended Data Fig. 6
Extended Data Fig. 6. Clustering and characterization of myeloid cells, especially DC.
a, Heatmap showing expression levels of cell maturation and immunoregulatory genes in 4 DC clusters. Rows represent clusters and columns represent genes. b, Tissue distribution of each myeloid cluster, colored by different tissues. c, Proportion of each myeloid cluster in all myeloid cells in ascites, colored by clusters. All n = 8 ascites samples from 10 HGSOC patients were analyzed. d, All-by-all heat map showing different gene expression in myeloid cells from datasets of our study (OV) and that of HCC and CRC (excluding all proliferative subsets). Clustered by similarities between myeloid subsets. Rows represent clusters and columns represent genes. N = 3 tumor types were used for analysis. e, Heatmap showing expression levels of top 20 differentially expressed genes of M01 and M02 in all three DC clusters (left), and correlation of DC-LAMP3 (M03) with DC-CD1C (M01) and DC-CLEC9A (M02) calculated using these genes (right). Genes, P value < 0.05, Two-sided Wilcoxon test adjusted by Benjamini-Hochberg (BH) procedure; log2(fold change) > 0.5. Correlation was analyzed using a Pearson correlation coefficient. For a-b and e, all n = 31 HGSOC samples were used for analysis.
Extended Data Fig. 7
Extended Data Fig. 7. Different functions and ontogeny of macrophages enriched in tumors and ascites.
a, Dot plot showing the mean interaction strength for selected ligand–receptor pairs among tumor-enriched macrophages and T cells in ascites. Dot size indicates percentage of ligand/receptor expression in cells of one cluster, colored by average expression levels. b, Expression levels of signature genes of monocyte-derived macrophages in 7 macrophage clusters. Center line indicates the median value, lower and upper hinges represent the 25th and 75th percentiles, respectively, and whiskers denote 1.5× interquartile range. c, Quantification of Tdtomatoor Tdtomato+ macrophages as a percentage of total CD11b+ F4/80+ macrophages using mouse ascites samples. d, Representative flow-cytometric plots showing frequency of Tdtomatoor Tdtomato+ cells in CD163+ TIM4+ RTMs using mouse ascites samples. e, Representative flow-cytometric plots, and summary of frequency of CD163+ or TIM4+ cells in Tdtomatomacrophages using mouse ascites samples. f, Representative examples of ovarian tumor stained by multicolored IHC (left) and the quantification plots (right). The upper panel indicates M07, and lower M10. Original magnification, 20x; scale bar, 50um. N = 3 individual patient tumors were examined independently per staining analysis. g, Differentially expressed genes (left) and differentially activated pathways (right) between tissue-resident macrophages (M09 and M14) versus monocyte-derived macrophages (M08 and M11) in ascites. h, Heatmap showing expression levels of indicated genes in macrophages of mouse ascites using samples from n = 4 mice. AeEM: ascites-enriched embryonic macrophage; AeMM: ascites-enriched monocyte-derived macrophage. i, Differentially expressed genes (left) and differentially activated pathways (right) between tissue-resident macrophages enriched in tumors (M10) versus RTMs enriched in ascites (M09 and M14). (c and e): Center line indicates the median value, lower and upper hinges represent the 25th and 75th percentiles, respectively, and whiskers indicates min to max. *P < 0.05, **P < 0.01, ***P < 0.001, unpaired two-sided t-test. (g and i): Genes, P value < 0.05, two-sided Wilcoxon test adjusted by Benjamini-Hochberg (BH) procedure; log2(fold change) > 0.5. Pathways, GO, adjusted P value by Benjamini-Hochberg (BH) procedure < 0.05. For a-b, g and i, all n = 31 HGSOC samples were used for analysis. For c-e, n = 4 independent experiments using 4 mouse ascites samples were used for analysis. Source data
Extended Data Fig. 8
Extended Data Fig. 8. Basic information of stromal cell clusters and gene expressions of mesothelial cells in ascites.
a, UMAP plots showing expression levels of cluster-specific marker genes in stromal cells. b-c, Tissue distribution of each stromal cell cluster, colored by tissues (b) and clusters (c). Stromal cells were un-detectable in blood. d, Violin plots showing the expression levels of adhesion-associated genes in 3 mesothelial cell clusters derived from tumor sites. Totally n = 14 HGSOC tumor samples, including n = 10 primary tumor and n = 4 omentum metastasis samples were analyzed. e, Heatmap showing the expression levels of chemokines and HLA-related genes in 4 stromal cell clusters detected in ascites. Rows represent clusters and columns represent genes. All n = 8 ascites samples from HGSOC patients were used for analysis. f, UMAP plots showing the similarity of ascites-derived cancer-associated fibroblasts (CAF) reported by Aviv (left) and stromal cells enriched in ascites in our dataset (right). For a-c, all n = 31 HGSOC samples were used for analysis.
Extended Data Fig. 9
Extended Data Fig. 9. Distribution and gene expressions of endothelial cells as well as association of E02, E06 clusters with HGSOC prognosis.
a, Tissue distribution of each endothelial cell cluster identified in HGSOC patients, colored by different tissues (upper) and clusters (lower). b, Heatmap showing the expression levels of indicated marker genes of tip-like endothelial cell in 8 endothelial cell clusters. Rows represent clusters and columns represent genes. c, Heatmap showing the expression levels of genes involved in MHC-II antigen presentation in 8 endothelial cell clusters. Rows represent clusters and columns represent genes. d, The Kaplan–Meier overall survival curves of HGSOC patients grouped by the gene signature expression of VCAM1+ ENDO cells (E06). TCGA OV data. HR, hazard ratio. Multivariate Cox regression. e, The Kaplan–Meier overall survival curves of HGSOC patients grouped by the gene signature expression of IL13RA1+ ENDO cells (E02). TCGA OV data. HR, hazard ratio. Multivariate Cox regression. f, The Kaplan–Meier overall survival curves of HGSOC patients grouped by the gene signature expression of VCAM1+ ENDO cells (E06). Microarray GSE9891 and GSE19829-GPL8300. HR, hazard ratio. Multivariate Cox regression. Statistical significance (P value) was determined by Kaplan–Meier survival curves and log-rank test (d-f). For a-c, all n = 31 HGSOC samples were used for analysis.
Extended Data Fig. 10
Extended Data Fig. 10. Gating strategies for T cells or macrophages.
a-c, Gating strategies for T cells in different samples of HGSOC patients, including primary tumor (a), omentum metastasis (b), and ascites (c). d-e, Gating strategies for macrophages in ascites of tumor-bearing mice used for proportion analysis of macrophages with different origins (d) and sorting out embryonic-origin and monocyte-derived macrophages for bulk RNA-seq (e).

References

    1. Siegel RL, Miller KD, Fuchs HE, Jemal A. Cancer statistics, 2022. CA Cancer J. Clin. 2022;72:7–33. doi: 10.3322/caac.21708. - DOI - PubMed
    1. Lheureux S, Braunstein M, Oza AM. Epithelial ovarian cancer: evolution of management in the era of precision medicine. CA Cancer J. Clin. 2019;69:280–304. - PubMed
    1. Geistlinger L, et al. Multiomic analysis of subtype evolution and heterogeneity in high-grade serous ovarian carcinoma. Cancer Res. 2020;80:4335–4345. doi: 10.1158/0008-5472.CAN-20-0521. - DOI - PMC - PubMed
    1. Lheureux S, Gourley C, Vergote I, Oza AM. Epithelial ovarian cancer. Lancet. 2019;393:1240–1253. doi: 10.1016/S0140-6736(18)32552-2. - DOI - PubMed
    1. Ahmed N, Stenvers KL. Getting to know ovarian cancer ascites: opportunities for targeted therapy-based translational research. Front. Oncol. 2013;3:256. doi: 10.3389/fonc.2013.00256. - DOI - PMC - PubMed

Publication types