. 2023 Aug;55(8):1336-1346.
doi: 10.1038/s41588-023-01450-7. Epub 2023 Jul 24.

Dynamic network-guided CRISPRi screen identifies CTCF-loop-constrained nonlinear enhancer gene regulatory activity during cell state transitions

Affiliations

Dynamic network-guided CRISPRi screen identifies CTCF-loop-constrained nonlinear enhancer gene regulatory activity during cell state transitions

Renhe Luo et al. Nat Genet. 2023 Aug.

Abstract

Comprehensive enhancer discovery is challenging because most enhancers, especially those contributing to complex diseases, have weak effects on gene expression. Our gene regulatory network modeling identified that nonlinear enhancer gene regulation during cell state transitions can be leveraged to improve the sensitivity of enhancer discovery. Using human embryonic stem cell definitive endoderm differentiation as a dynamic transition system, we conducted a mid-transition CRISPRi-based enhancer screen. We discovered a comprehensive set of enhancers for each of the core endoderm-specifying transcription factors. Many enhancers had strong effects mid-transition but weak effects post-transition, consistent with the nonlinear temporal responses to enhancer perturbation predicted by the modeling. Integrating three-dimensional genomic information, we were able to develop a CTCF-loop-constrained Interaction Activity model that can better predict functional enhancers compared to models that rely on Hi-C-based enhancer-promoter contact frequency. Our study provides generalizable strategies for sensitive and systematic enhancer discovery in both normal and pathological cell state transitions.


Conflict of interest statement

Competing interests

Authors declare that they have no competing interests.

Figures

Extended Data Figure 1.
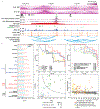
Extended Data Figure 1.. Supporting data for the Dynamic GRN model.
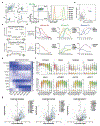
a, The detailed schematic of core circuit in the GRN. The core TFs cooperatively auto-regulate each other by binding to core enhancers and co-regulate downstream peripheral genes by binding to peripheral enhancers. b, The ranking plot of PC1 weight of all TFs in PCA analysis from scRNA-seq data during hESC-DE transition. c, The PCA plots showing selective TFs from the PCA component 1 (Extended Data Fig.1b) of scRNA-seq sampled every 12 hours during hESC-DE transition. d, The schematic of core circuit establishment during cell state transition, similar to Moris et al 68. The transition of a cell from one steady state to another is accompanied by the deconstruction of the original core circuit (A, B, C) and the establishment of core circuit of the new state (X, Y, Z). e, Stochastic Gillespie simulations of the dynamic GRN network model. The green, cyan, purple, yellow and orange lines represent 100%, 70%, 30%, 10% and 0% of original total enhancer strength respectively.
Extended Data Figure 2.
Extended Data Figure 2.. Core TFs identification and characterization during hESC-DE transition.
a, Flow cytometry analysis showing the gating strategy (left), differentiation efficiency at DE-72h measured by DE markers SOX17 and CXCR4 (middle) or transition efficiency every 12h measured by SOX17 (right). b, MAGeCK RRA scores for negative hits in two genome-scale DE screens from Li et al . JUN is the only identified TF among the negative hits. c, PCA analysis of bulk RNA-seq (top) and ATAC-seq (bottom) during hESC-DE transition. Data points are projected to PC1 (cell state) to determine the time window of cell state transition. d, The expression dynamics (top) and motif dynamics (predicted by gkm-SVM trained on the ATAC-seq data, bottom) of core TFs during hESC-DE transition. e, Motif Z-score of ATAC-seq by gkm-SVM at each time point during hESC-DE transition. f, Feature violin plots from scRNA-seq data showing core TFs expression changing during hESC-DE transition at single cell resolution. g, Volcano plots showing protein-protein interactions identified by ChIP-MS using EOMES as the bait at DE-24h, GATA6 and SOX17 as baits at DE-48h. Blue dots represent the significantly enriched proteins with log2FC > 2 and −log10(P-value) > 2. Selective TFs enriched in ESC and endoderm GO terms are labeled by triangles.
Extended Data Figure 3.
Extended Data Figure 3.. Supporting data for the screen design and gRNA enrichment analysis.
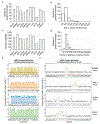
a to d, Statistics of putative enhancers selection and gRNAs design. The number of putative enhancers selected for each core TFs (a), the size of putative enhancers (b), the total number of gRNAs targeted on putative enhancers of each core TF (c), the number of gRNAs targeted on each putative enhancer (d). e, The gRNA Z-score distribution at representative enhancers showing gRNAs targeting the same enhancer have similar perturbation effect. f, Box plots showing the gRNA Z-score distribution in all putative enhancers of EOMES, MIXL1, GATA6 and SOX17 loci. Center lines indicate median. Boxes limit upper and lower quartiles. All box plots follow the following format: center line, median; box limits, upper and lower quartiles; whiskers, 1.5× interquartile range; points, outliers.
Extended Data Figure 4.
Extended Data Figure 4.. idCas9-KRAB SOX17GFP/+ hESC line generation using cassette switching.
a, The schematics of idCas9-KRAB SOX17GFP/+ hESC line generation using cassette switching. gRNAs targeting the puromycin selection cassette and the 5’ sequence outside TRE are designed for inducing double-strand break for homology repair. b, Karyotyping results of the idCas9-KRAB SOX17GFP/+ hESC line. c, RT-qPCR results showing the inducible expression of dCas9-KRAB with doxycycline treatment. n=3 biologically independent experiments. Error bars indicate mean ± SD. Statistical analysis was performed by two-tailed unpaired student t-test. d, Flow cytometry results showing the inducible expression of dCas9-KRAB with doxycycline treatment.
Extended Data Figure 5.
Extended Data Figure 5.. Supporting data for validation of core enhancers.
a-b, RT-qPCR showing the expression of the cognate genes decreases by enhancer perturbations at DE-36h (a) but mostly restored at DE-72h (b). n=3 biologically independent experiments. Error bars indicate mean ± SD. Statistical analysis was performed by two-tailed unpaired student t-test. n.s.: not significant. c, Illustration of the enhancer deletion experiments that resulted in the GATA6e+9 deletion (del), GATA6e+12 del and GATA6e+9/e+12 double del hESC lines. d, Statistics of SOX17-GFP/CXCR4 double positive cells at DE-72h in WT, GATA6e+9 del, GATA6e+12 del, GATA6e+9/e+12 double del cells, as well as cells with non-targeting control, GATA6e+9 perturbation, GATA6e+12 perturbation and GATA6e+9/GATA6e+12 dual-perturbation. n=3 biologically independent replicates. Error bars indicate mean ± SD. Statistical analysis was performed by two-tailed unpaired multiple comparison test with Dunnett correction. n.s. Not significant. e, Flow plots showing SOX17/GATA6 expression at DE-36h, DE-72h and SOX17-GFP/CXCR4 expression at DE-72h of WT, GATA6e+9 del, GATA6e+12 del, GATA6e+9/e+12 double del.
Extended Data Figure 6.
Extended Data Figure 6.. Epigenetic features of DE core enhancers.
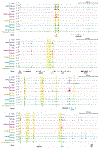
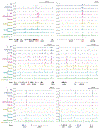
Relevant ATAC-seq and ChIP-seq tracks of 4 DE core TF loci. Yellow boxes highlight the DE core TFs (EOMES, GATA6 and SOX17) bind to DE core enhancers. Genomic coordinates from GRCh38 (human hg38) for each gene are labeled. kb, kilobase.
Extended Data Figure 7.
Extended Data Figure 7.. Epigenetic features of ESC and signaling core TF loci.
Relevant ATAC-seq and ChIP-seq tracks of ESC and signaling core TF loci. Genomic coordinates from GRCh38 (human hg38) for each gene are labeled. kb, kilobase.
Extended Data Figure 8.
Extended Data Figure 8.. Supporting data for enhancer prediction using CIA model.
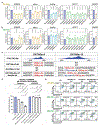
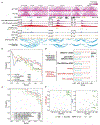
a, Hi-C-based and CTCF loop-based chromatin conformation analysis at the GATA6, MIXL1 and EOMES loci. b, Precision-recall plot comparing the performance for prediction of enhancer hits from the screen using different Hi-C datasets. c, Precision-recall plot comparing the performance for prediction of enhancer hits from the screen using CIA model with additional H3K4me1 chromatin feature. d, Bar plot comparing the AUPRC and correlation scores between logistic regression of chromatin feature combination and Activity=ATAC*H3K27ac in CIA model. e, A scatter plot showing the P(in loop) can classify hits (green) and non-hits (grey) more clearly than Hi-C-based enhancer-promoter contact frequency. The size of each dot represents the log2FC of each enhancer from the screen.
Extended Data Figure 9.
Extended Data Figure 9.. The CIA model predicts active enhancers in different scenarios (K562 Reilly).
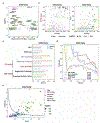
a, gRNA enrichment analysis identified 36 hits from the HCR-FF screen in K562 cells from Reilly et al b, The scatter plot showing the P(in loop) can classify hits (green) and non-hits (grey) in K562 HCR-FF screen more clearly than Hi-C-based enhancer-promoter contact frequency. The size of each dot represents the log2FC of each enhancer from the screen. c, Bar plot comparing the AUPRC and correlation scores between Hi-C-based enhancer prediction with CIA model and ABC model using K562 HCR-FF screen results. d, Precision-recall plot comparing the performance for prediction of enhancer hits from the K562 HCR-FF screen using CTCF loop-based model and Hi-C-based model. e, The scatter plot showing the combinatory criteria of P(in loop), H3K27ac and ATAC can clearly separate the hits (green) and non-hits (blue and gray) from the K562 HCR-FF screen. P(in loop) > 0.5 is used to highlight enhancers and targeting promoters in the same CTCF loop (green and red). The solid line represents the same threshold criterion of Activity=ATAC*H3K27ac in Fig.4e. The size of each dot represents the log2FC of each enhancer from the K562 HCR-FF screen.
Extended Data Figure 10.
Extended Data Figure 10.. The CIA model predicts active enhancers in different scenarios (K562 Nasser).
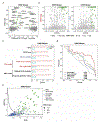
a, 69 identified hits in the K562 cells from Nasser et al are plotted. b, The scatter plot showing the P(in loop) can classify hits (green) and non-hits (grey) in K562 Nasser more clearly than Hi-C-based enhancer-promoter contact frequency. The size of each dot represents the effect size of each enhancer from Nasser et al. c, Bar plot comparing the AUPRC and correlation scores between Hi-C-based enhancer prediction with CIA model and ABC model using K562 Nasser results. d, Precision-recall plot comparing the performance for prediction of enhancer hits from the K562 Nasser using CTCF loop-based model and Hi-C-based model. e, The scatter plot showing the combinatory criteria of P(in loop), H3K27ac and ATAC can clearly separate the hits (green) and non-hits (blue and gray) from the K562 Nasser. P(in loop) > 0.5 is used to highlight enhancers and targeting promoters in the same CTCF loop (green and red). The solid line represents the same threshold criterion of Activity=ATAC*H3K27ac in Fig.4e. The size of each dot represents the effect size of each enhancer from the K562 Nasser.
Figure 1.
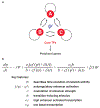
Figure 1.. Dynamic gene regulatory network model.
a, The schematic of core circuit in the gene regulatory network (GRN). The core TFs cooperatively auto-regulate each other and co-regulate downstream peripheral genes. b, The equation of the dynamic gene regulatory network model.
Figure 2.
Figure 2.. Dynamic gene regulatory network model predicts temporal sensitivity to enhancer perturbation during cell state transition.
a, The violin plots of core circuit establishment during cell state transition by simulation. b, Plot of dψ/dt vs ψ showing cell state transition with different enhancer strengths. The green line represents total enhancer strength without perturbation. The cyan line represents total enhancer strength reduced to 70% of full strength by perturbation. The purple line represents total enhancer strength reduced to 30% of full strength by perturbation. c, Principal component analysis (PCA) of all transcription factors (TFs) from single-cell RNA-seq (scRNA-seq) data during human embryonic stem cell to definitive endoderm (hESC-DE) transition. Each dot represents a cell collected every 12h during hESC-DE transition. The large dots represent the average of all cells from the same time point. d, The violin plots of core circuit establishment during hESC-DE transition by scRNA-seq experiments. e, The comparison between the same enhancer perturbation strength during cell state transition or at steady state. The line plots represent the median of simulation results. The violin plots correspond to a zoomed in time interval denoted by the grey box on the line plots. The green, cyan, purple, yellow and orange lines represent 100%, 70%, 30%, 10% and 0% of the original total enhancer strength respectively.
Figure 3.
Figure 3.. Systematic identification of core TFs during ESC-DE cell state transition.
a, The schematic of using a systematic approach to identify the core TFs during hESC-DE transition. b, MAGeCK robust ranking aggregation (RRA) scores for positive hits in two genome-scale DE screens from Li et al . We overlapped the top 100 hits from each screen, there were 11 TFs (labeled). DE core TFs and signaling TFs selected for the network-guided core enhancer perturbation screen are shown in green and blue, respectively. c, The expression correlation analysis from scRNA-seq of hESC-DE transition. Each dot represents a significant expressed gene during the hESC-DE transition (Methods). The distance between each pair of genes is defined by Pearson correlation. The color scale is defined from the expression fold change from ESS to DE-72h. d, PCA analysis of bulk RNA-seq (top) and ATAC-seq (bottom) during hESC-DE transition. Data points are projected to PC1 to determine the time window of cell state transition. e, The expression dynamics (top) and motif dynamics (predicted by gkm-SVM trained on the ATAC-seq data, bottom) of core TFs during hESC-DE transition. f, The common protein interactive partners between core TFs identified by ChIP-MS using EOMES, GATA6 and SOX17 as baits during hESC-DE transition.
Figure 4.
Figure 4.. A dynamic network-guided enhancer screen identified core enhancers during hESC-DE cell state transition.
a, The design of dynamic network-guided core enhancer perturbation screening. b, The scatter plot of gRNA Z-score distribution from the screen. Each dot represents an individual gRNA. Dashed lines indicate the threshold of |Z-score| = 2. Gray dots represent gRNAs of |Z-score| ≤ 2. Black dots represent negative control gRNAs. Red dots represent positive control gRNAs. Green dots represent gRNAs of |Z-score| > 2 targeting on SOX17, EOMES, GATA6 and MIXL1 loci. Purple dots represent gRNAs of |Z-score| > 2 targeting on NANOG, OCT4 and SOX2 loci. Blue dots represent gRNAs of |Z-score| > 2 targeting on SMAD2, SMAD4 and JUN loci. c, The scatter plot of average Z-score distribution of each putative enhancer region from the screening. Each dot represents an individual region. Black dots represent negative controls. 29 enhancer hits are labeled by different colors representing the core TFs they are surrounding. d, Scatter plots showing the distance of 29 enhancers to the transcription start site (TSS) of their target genes.
Figure 5.
Figure 5.. Validation of identified core enhancers using CRISPRi perturbation.
a-d, Representative flow plots showing individual core enhancer perturbations decrease the hESC-DE transition efficiency measured by SOX17-GFP+ at DE-36h (a) and SOX17-GFP+/CXCR4-APC+ at DE-72h (c). The bar graphs show the percentage of SOX17-GFP+ cells at DE-36h (b) and SOX17-GFP+/CXCR4-APC+ at DE-72h (d). n=3~9 biologically independent experiments. Error bars indicate mean ± SD. Statistical analysis was performed by two-tailed unpaired multiple comparison test with Dunnett correction. e, Violin plots showing the effect of GATA6e+9 perturbation on hESC-DE transition efficiency (SOX17 intensity) measured every 6h through flow cytometry. n=3 biologically independent experiments. Solid lines indicate median. Dashed lines indicate quartiles. Statistical analysis was performed by two-tailed paired student t-test with mean of each replicate. n.s.: not significant. f, Heatmap showing the comparison between the mean SOX17 expression intensity of cells with non-targeting control (NT) vs GATA6e+9 or GATA6e+12 perturbation measured every 6h through flow cytometry during hESC-DE transition. A significant impact was observed only in a narrow time window (around DE-36h) during the transition.
Figure 6.
Figure 6.. Validation of identified core enhancers using CRISPR-Cas9 mediated deletion.
a, Schematics of GATA6e+9 del, GATA6e+12 del and GATA6e+9/e+12 double del hESC lines generation using two pairs of gRNAs with Cas9. b, Flow plots showing GATA6 core enhancer del reduced hESC-DE transition efficiency at DE-36h and DE-72h. c, The comparison between the simulation and experiment results of the impact of different levels of enhancer perturbation on cell state transition. Solid lines indicate median. Dashed lines indicate quartiles.
Figure 7.
Figure 7.. The CIA model provides improved enhancer prediction.
a, Hi-C-based and CTCF loop-based chromatin conformation analysis at the SOX17 locus. b, Bar plots comparing the area under precision recall curve (AUPRC) and Spearman correlation scores between single chromatin feature-based, Hi-C-based, or CTCF loop-based enhancer prediction model with the ABC model. c, A precision-recall plot comparing the performance for prediction of enhancer hits from the screen using P(in loop, red), DE Hi-C (blue), ESC Hi-C (yellow) and enhancer-promoter distance (black). d, A precision-recall plot comparing the performance for prediction of enhancer hits from the screen using CTCF loop (solid line) and Hi-C (dash line) with or without additional chromatin feature combination. e, A scatter plot showing the combinatory criteria of P(in loop), H3K27ac and ATAC can clearly separate the hits (green) and non-hits (blue and gray). P(in loop) > 0.5 is used to justify the enhancers and targeting promoters are in the same CTCF loop (green and red). The solid line represents the threshold value (criteria) of Activity=1. The size of each dot represents the log2FC of each enhancer from the screen. f, A scatter plot showing the comparison between the CTCF loop-constrained Interaction Activity (CIA) and Activity-by-contact (ABC) model with all 3 datasets (ESC-DE, K562 Reilly and K562 Nasser). The numbers of selected top predictions are based on the hits identified from each data set, including top 24 predictions from ESC-DE, top 36 predictions from K562 Reilly and top 69 predictions from K562 Nasser. Yellow dots represent top predictions in both models. Red dots represent top predictions only in the CIA model. Blue dots represent top predictions only in the ABC model. Grey dots represent regions that do not belong to top predictions. The effect sizes from each data set are scaled to reach to the same threshold (~0.1 dashed line).

Update of

References

    1. Luo Y et al. New developments on the Encyclopedia of DNA Elements (ENCODE) data portal. Nucleic Acids Res 48, D882–D889, doi:10.1093/nar/gkz1062 (2020). - DOI - PMC - PubMed
    1. Korkmaz G et al. Functional genetic screens for enhancer elements in the human genome using CRISPR-Cas9. Nat Biotechnol 34, 192–198, doi:10.1038/nbt.3450 (2016). - DOI - PubMed
    1. Fulco CP et al. Systematic mapping of functional enhancer-promoter connections with CRISPR interference. Science 354, 769–773, doi:10.1126/science.aag2445 (2016). - DOI - PMC - PubMed
    1. Fulco CP et al. Activity-by-contact model of enhancer-promoter regulation from thousands of CRISPR perturbations. Nat Genet 51, 1664–1669, doi:10.1038/s41588-019-0538-0 (2019). - DOI - PMC - PubMed
    1. Sanjana NE et al. High-resolution interrogation of functional elements in the noncoding genome. Science 353, 1545–1549, doi:10.1126/science.aaf7613 (2016). - DOI - PMC - PubMed

Methods-only references

    1. Rezania A et al. Reversal of diabetes with insulin-producing cells derived in vitro from human pluripotent stem cells. Nat Biotechnol 32, 1121–1133, doi:10.1038/nbt.3033 (2014). - DOI - PubMed
    1. Yang D et al. CRISPR screening uncovers a central requirement for HHEX in pancreatic lineage commitment and plasticity restriction. Nat Cell Biol 24, 1064–1076, doi:10.1038/s41556-022-00946-4 (2022). - DOI - PMC - PubMed
    1. Hao Y et al. Integrated analysis of multimodal single-cell data. Cell 184, 3573–3587 e3529, doi:10.1016/j.cell.2021.04.048 (2021). - DOI - PMC - PubMed
    1. Xiong W & Ferrell JE A positive-feedback-based bistable ‘memory module’ that governs a cell fate decision. Nature 426, 460–465, doi:10.1038/nature02089 (2003). - DOI - PubMed
    1. Wang L et al. Bistable switches control memory and plasticity in cellular differentiation. Proc Natl Acad Sci U S A 106, 6638–6643, doi:10.1073/pnas.0806137106 (2009). - DOI - PMC - PubMed

Publication types

MeSH terms