. 2023 Jul 24;29(1):100.
doi: 10.1186/s10020-023-00702-w.

Leptin/obR signaling exacerbates obesity-related neutrophilic airway inflammation through inflammatory M1 macrophages

Affiliations

Leptin/obR signaling exacerbates obesity-related neutrophilic airway inflammation through inflammatory M1 macrophages

Yang Wang et al. Mol Med. .

Abstract

Background: Obesity-related asthma is a kind of nonallergic asthma with excessive neutrophil infiltration in the airways. However, the underlying mechanisms have been poorly elucidated. Among the adipokines related to obesity, leptin is related to the inflammatory response. However, little is understood about how leptin acts on the leptin receptor (obR) in neutrophilic airway inflammation in obesity-associated asthma. We explored the inflammatory effects of leptin/obR signaling in an obesity-related neutrophilic airway inflammation mouse model.

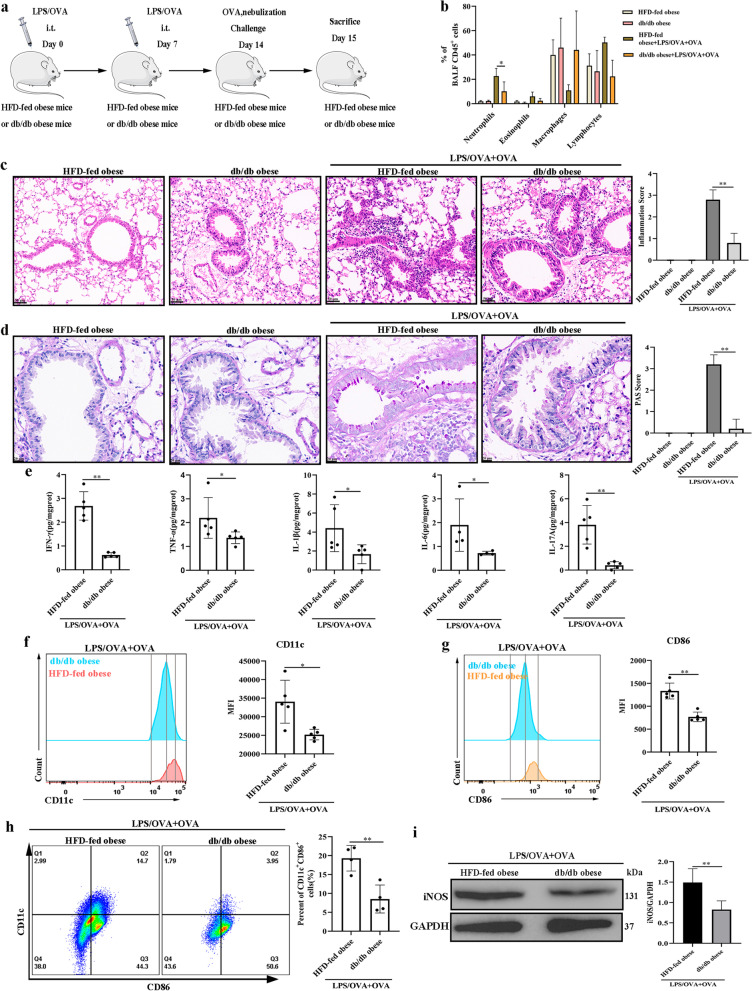
Methods: We established a neutrophilic airway inflammation mouse model using lipopolysaccharide (LPS)/ovalbumin (OVA) sensitization and OVA challenge (LPS + OVA/OVA) in lean, obese, or db/db (obR deficiency) female mice. Histopathological, bronchoalveolar lavage fluid (BALF) inflammatory cell, and lung inflammatory cytokine analyses were used to analyze airway inflammation severity. Western blotting, flow cytometry, reverse transcription-polymerase chain reaction (RT-PCR), and enzyme-linked immunosorbent assay (ELISA) were used to evaluate the underlying mechanisms. In vitro bone marrow-derived macrophage (BMDM) and bone marrow-derived neutrophil experiments were performed.

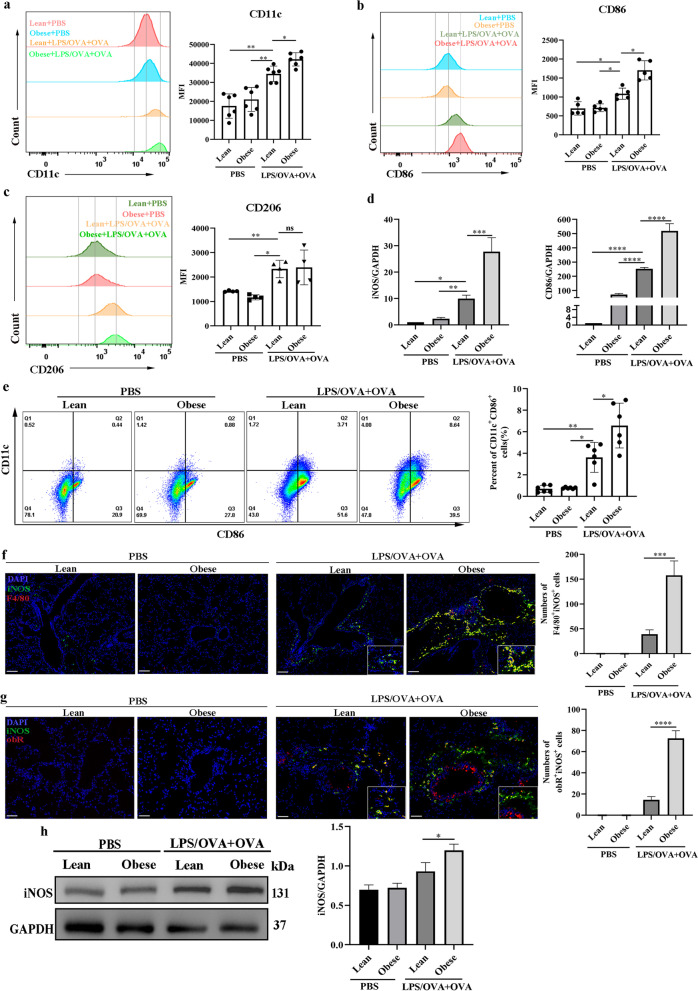
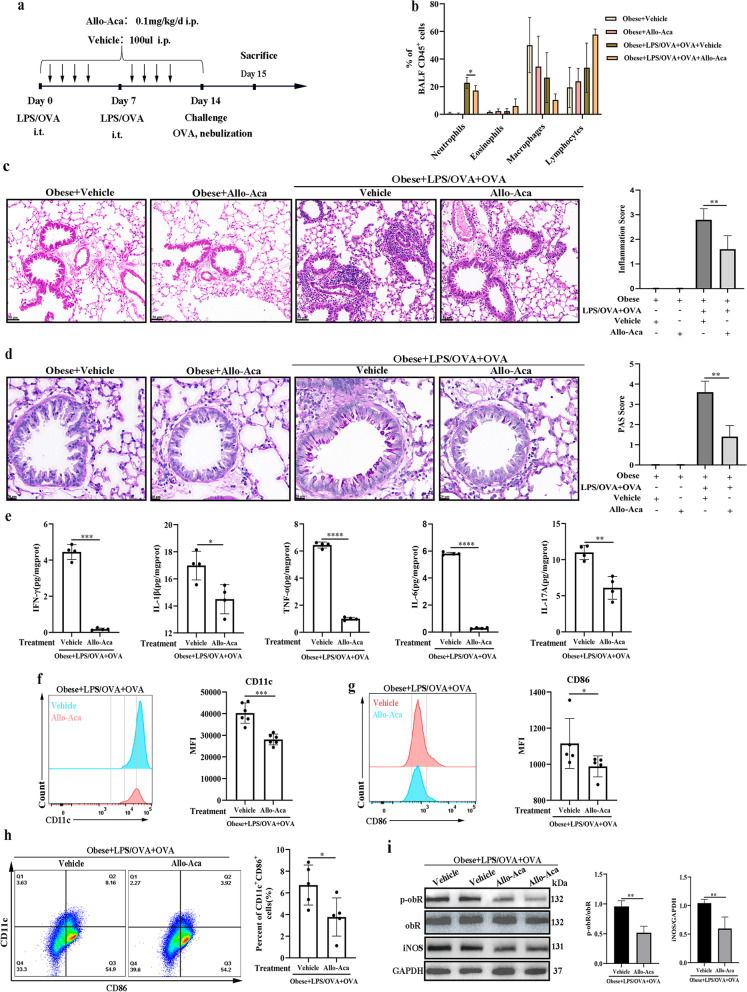
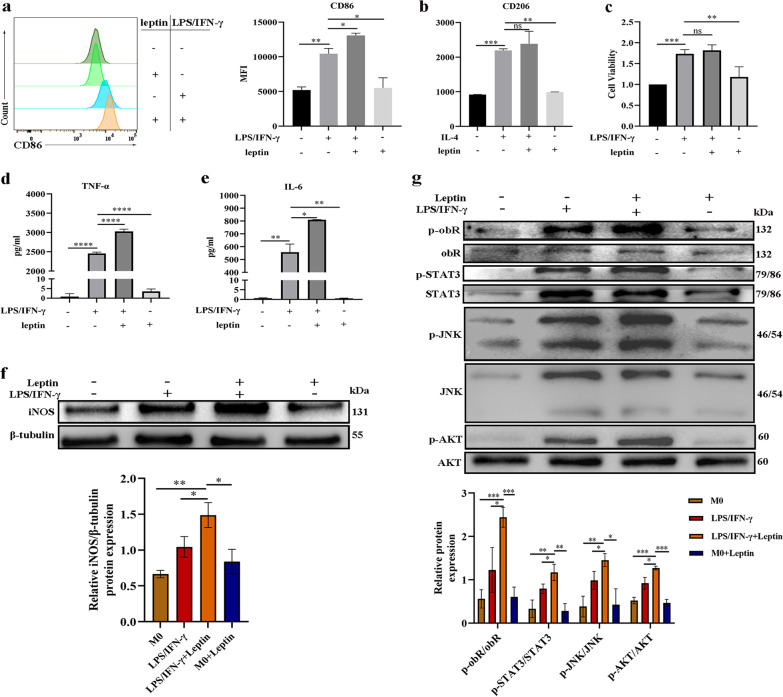
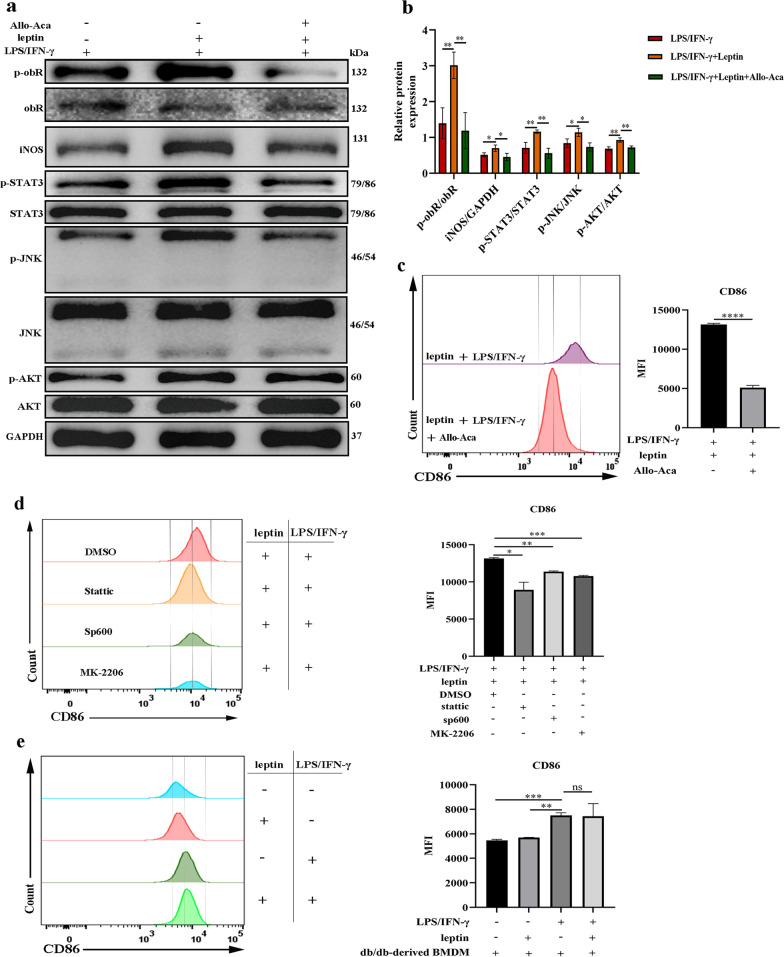
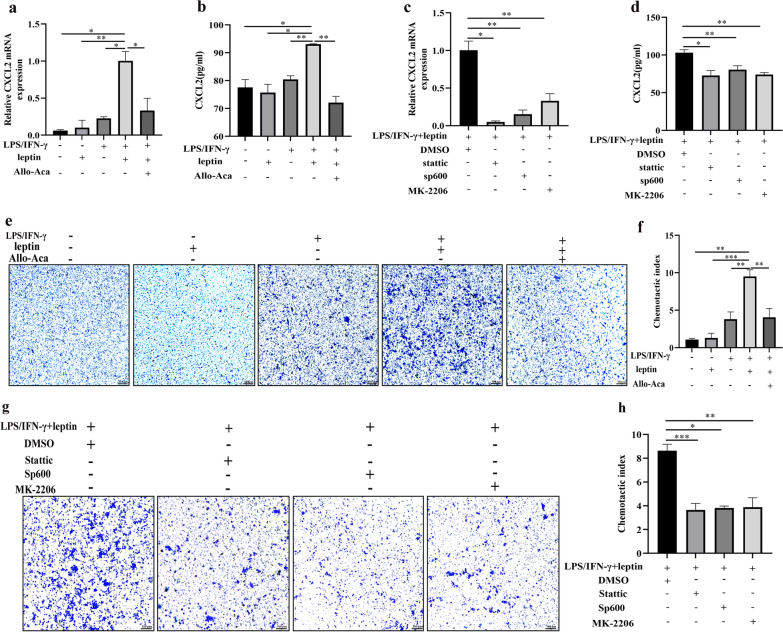
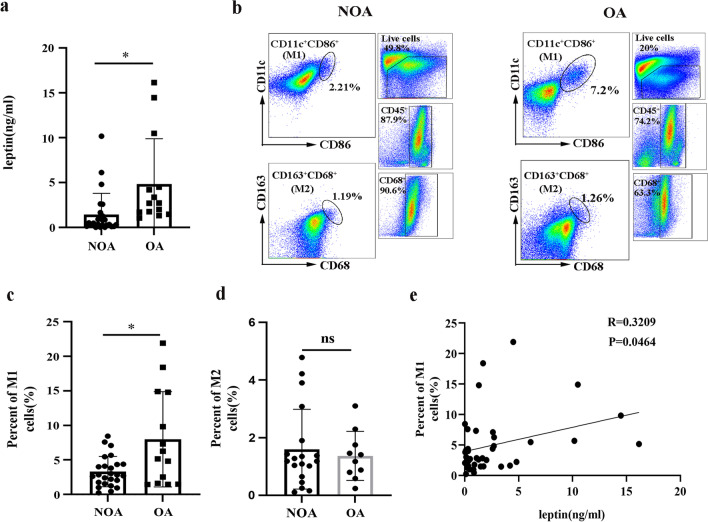
Results: We found that the serum leptin level was higher in obese than in lean female mice. Compared to LPS/OVA + OVA-treated lean female mice, LPS/OVA + OVA-treated obese female mice had higher peribronchial inflammation levels, neutrophil counts, Th1/Th17-related inflammatory cytokine levels, M1 macrophage polarization levels, and long isoform obR activation, which could be decreased by the obR blockade (Allo-Aca) or obR deficiency, suggesting a critical role of leptin/obR signaling in the pathogenesis of obesity-related neutrophilic airway inflammation in female mice. In in vitro experiments, leptin synergized with LPS/IFN-γ to promote the phosphorylation of the long isoform obR and JNK/STAT3/AKT signaling pathway members to increase M1 macrophage polarization, which was reversed by Allo-Aca. Moreover, leptin/obR-mediated M1 macrophage activity significantly elevated CXCL2 production and neutrophil recruitment by regulating the JNK/STAT3/AKT pathways. In clinical studies, obese patients with asthma had higher serum leptin levels and M1 macrophage polarization levels in induced sputum than non-obese patients with asthma. Serum leptin levels were positively correlated with M1 macrophage polarization levels in patients with asthma.

Conclusions: Our results demonstrate leptin/obR signaling plays an important role in the pathogenesis of obesity-related neutrophilic airway inflammation in females by promoting M1 macrophage polarization.

Keywords: Leptin; Leptin receptor; M1 macrophage polarization; Neutrophilic airway inflammation; Obesity.


Conflict of interest statement

The authors declare that they have no competing interests.

Figures

Fig. 1
Fig. 1
Increased airway inflammation in a female obesity-related neutrophilic airway inflammation mouse model. a Comparison of body weight changes between lean and obese female mice. b Flow chart for the generation of the neutrophilic airway inflammation mouse model. c Comparison of serum leptin levels between female mice. d Representative H&E-stained histological lung sections and a bar graph showing the inflammation scores. Scale bar = 50 μm. e Representative PAS-stained histological lung sections and a bar graph showing the PAS scores. Scale bar = 20 μm. f Neutrophil, eosinophil, macrophage, and lymphocyte percentages in BALF were measured by flow cytometry. g Western blot analysis of obR-b phosphorylation in lung tissues. The displayed protein expression value is the ratio of phosphorylated protein to total protein. h Levels of inflammatory cytokines (IFN-γ, TNF-α, IL-1β, IL-6, and IL-17A) in lung homogenate. The data are expressed as the means ± SDs. *P < 0.05, **P < 0.01, ***P < 0.001, ****P < 0.0001. i.t., intratracheal; i.p., intraperitoneal. For a-e, n = 6 female mice per group; for g, n = 3 female mice per group; for h, n = 4–6 female mice per group
Fig. 2
Fig. 2
Increased M1-phenotype macrophages in a female obesity-related murine neutrophilic airway inflammation mouse model. a Representative histogram of CD11c (M1) expression (left) and a bar graph showing the quantitative analysis of CD11c (right) in BALF. b Representative histogram of CD86 (M1) expression (left) and a bar graph showing the quantitative analysis of CD86 (right) in BALF. c Representative histogram of CD206 (M2) expression (left) and a bar graph showing the quantitative analysis of CD206 (right) in BALF. d Real-time PCR assessment of M1-associated gene (iNOS and CD86) mRNA levels normalized to those of GAPDH. e Representative flow cytometry analysis of M1 macrophages (CD11c+CD86+) (gating in macrophages) (left) and quantitative analysis of the M1 macrophage number (right) in lung single-cell suspensions. f Representative immunofluorescence staining of iNOS (green) and F4/80+ (red) in lung sections (×100). DAPI (blue) was used for nuclear visualization. Scale bar = 100 μm. g Representative immunofluorescence staining of iNOS (green) and obR (red) in lung sections (×200). DAPI (blue) was used for nuclear visualization. Scale bar = 50 μm. h Western blot analysis of iNOS in lung tissues. The displayed protein expression value is the ratio of iNOS protein to total protein. Data are expressed as the means ± SDs. *P < 0.05, **P < 0.01, ***P < 0.001, ****P < 0.0001. For a and e, n = 6 female mice per group; for b, n = 5 female mice per group; for c, d, n = 4–6 female mice per group; for fh, n = 3 female mice per group
Fig. 3
Fig. 3
Allo-Aca inhibited M1 macrophage polarization and obesity-related murine neutrophilic airway inflammation in a female obese mouse model. a Flow chart for Allo-Aca or vehicle administration in a female obesity-related neutrophilic airway inflammation mouse model. b Neutrophil, eosinophil, macrophage, and lymphocyte percentages in BALF. c Representative H&E-stained histological lung sections and a bar graph showing the inflammation scores. Scale bar = 50 μm. d Representative PAS-stained histological lung sections and a bar graph showing the PAS scores. Scale bar = 20 μm. e The levels of inflammatory cytokines (IFN-γ, TNF-α, IL-1β, IL-6, and IL-17A) in lung homogenates. f Representative histogram of CD11c (M1) expression (left) and quantitative analysis of CD11c (right) expression in BALF. g Representative histogram of CD86 (M1) expression (left) and quantitative analysis of CD86 (right) expression in BALF. h Representative flow cytometry analysis to detect M1 macrophages (CD11c+CD86+) (gating in macrophages) (left) and quantification of M1 macrophage number (right) in lung single-cell suspensions. i Western blot analysis of obR-b phosphorylation and iNOS expression in lung tissues. The relative expression of protein displayed the ratio of phosphorylated protein or iNOS protein to total protein. The data are expressed as the means ± SDs. *P < 0.05, **P < 0.01, ***P < 0.001, ****P < 0.0001. i.t., intratracheal; i.p., intraperitoneal. For ad, n = 4–6 female mice per group; for e, n = 4 female mice per group; for f, n = 6 female mice per group; for g, h, n = 5 female mice per group; for i, n = 3 female mice per group
Fig. 4
Fig. 4
M1 macrophage polarization and obesity-related neutrophilic airway inflammation were reduced in a female db/db murine model. a Flow chart for the generation of a female obesity-related neutrophilic airway inflammation mouse model. b Neutrophil, eosinophil, macrophage, and lymphocyte percentages in BALF. c Representative H&E-stained histological lung sections and a bar graph showing the inflammation scores. Scale bar = 50 μm. d Representative PAS-stained histological lung sections and a bar graph showing the PAS scores. Scale bar = 20 μm. e The levels of inflammatory cytokines (IFN-γ, TNF-α, IL-1β, IL-6, and IL-17A) in lung homogenates. f Representative histogram of CD11c (M1) expression (left) and quantitative analysis of CD11c (right) expression in BALF. g Representative histogram of CD86 (M1) expression (left) and the quantitative analysis of CD86 (right) expression in BALF. h Representative flow cytometry analysis of M1 macrophages (CD11c+CD86+) (gating on macrophages) (left) and quantitative analysis of the M1 macrophage number (right) in lung single-cell suspensions. i Western blot analysis of iNOS in lung tissues; GAPDH was used as a loading control. The displayed protein expression value is the ratio of iNOS protein to total protein. The data are expressed as the means ± SDs. *P < 0.05, **P < 0.01, ***P < 0.001, ****P < 0.0001. i.t., intratracheal; i.p., intraperitoneal. For bd and f, g, n = 5 female mice per group; for e, n = 4–5 female mice per group; for h, n = 4 female mice per group; for i, n = 3 female mice per group
Fig. 5
Fig. 5
The mechanisms by which leptin affects M1 macrophage polarization. a Representative histogram of CD86 expression (left) and quantitative analysis of CD86 (right) expression in BMDMs. b Quantitative analysis of CD206 expression in BMDMs. c Cell viability. d, e Levels of inflammatory cytokines (TNF-α and IL-6) in cell-free supernatants of BMDMs. f Western blot analysis of iNOS in BMDMs and β-tubulin was used as a loading control. The displayed protein expression value is the ratio of iNOS protein to total protein. g Western blot analysis of the phosphorylation levels of obR-b and members of the downstream JNK/STAT3/AKT pathways in BMDMs. The displayed protein expression value is the ratio of phosphorylated protein to total protein. *P < 0.05, **P < 0.01, ***P < 0.001, ****P < 0.0001, each experiment was performed three times
Fig. 6
Fig. 6
Signal inhibitors reversed the effects of leptin on LPS/IFN-γ-induced M1 macrophages. a Western blot analysis of iNOS and phosphorylation levels of obR-b and members of the downstream JNK/STAT3/AKT pathways in BMDMs. b The displayed protein expression value is the ratio of phosphorylated quantitative protein or iNOS protein to total protein. c Quantitative analysis of CD86 in BMDMs treated with or without Allo-Aca. d Quantitative analysis of CD86 in BMDMs treated with or without different synthetic inhibitors. e Representative histogram of CD86 expression (left) and quantitative analysis of CD86 (right) expression in female db/db mouse-derived BMDMs. *P < 0.05, **P < 0.01, ***P < 0.001, ****P < 0.0001, each experiment was performed three times
Fig. 7
Fig. 7
The effects of leptin/obR signaling on neutrophil chemotaxis. a Real-time PCR of CXCL2 mRNA levels normalized to those of GAPDH. b CXCL2 protein levels were analyzed by ELISA. c Real-time PCR of CXCL2 mRNA levels normalized to those of GAPDH. d CXCL2 protein levels were analyzed by ELISA. e Transwell assay to detect neutrophil chemotaxis (×100). f Chemotactic index of neutrophils. g Transwell assay to detect neutrophil chemotaxis (×100). h Chemotactic index of neutrophils. Each experiment was performed three times. *P < 0.05, **P < 0.01, ***P < 0.001, ****P < 0.0001
Fig. 8
Fig. 8
Leptin concentration and M1 macrophage polarization in obese and nonobese patients with asthma. a The level of leptin in the serum of OA patients (n = 14) and NOA patients (n = 25). b Representative macrophage gating strategy for the induced sputum of OA and NOA subjects. c Bar graph showing the number of M1 macrophages (CD11c+CD86+) in the induced sputum of OA and NOA subjects. d Bar graph showing the number of M2 macrophages (CD68+CD163+) in the induced sputum of OA and NOA subjects. e Correlation between serum leptin and M1 macrophage levels in induced sputum. The data are expressed as the means ± SDs. *P < 0.05, **P < 0.01, ***P < 0.001, ****P < 0.0001

References

    1. Abdelaziz MH, Abdelwahab SF, Wan J, et al. Alternatively activated macrophages; a double-edged sword in allergic asthma. J Transl Med. 2020;18(1):58. doi: 10.1186/s12967-020-02251-w. - DOI - PMC - PubMed
    1. Abella V, Scotece M, Conde J, et al. Leptin in the interplay of inflammation, metabolism and immune system disorders. Nat Rev Rheumatol. 2017;13(2):100–109. doi: 10.1038/nrrheum.2016.209. - DOI - PubMed
    1. Bai JY, Li Y, Xue GH, et al. Requirement of Gαi1 and Gαi3 in interleukin-4-induced signaling, macrophage M2 polarization and allergic asthma response. Theranostics. 2021;11(10):4894–4909. doi: 10.7150/thno.56383. - DOI - PMC - PubMed
    1. Baltieri L, Cazzo E, de Souza AL, et al. Influence of weight loss on pulmonary function and levels of adipokines among asthmatic individuals with obesity: one-year follow-up. Respir Med. 2018;14:548–556. doi: 10.1016/j.rmed.2018.10.017. - DOI - PubMed
    1. Bantulà M, Roca-Ferrer J, Arismendi E, Picado C. Asthma and obesity: two diseases on the rise and bridged by inflammation. J Clin Medi. 2021;10(2):169. doi: 10.3390/jcm10020169. - DOI - PMC - PubMed

Publication types

MeSH terms