. 2023 Jul;13(7):e1338.
doi: 10.1002/ctm2.1338.

Integrated single-cell and spatial transcriptomic profiling reveals higher intratumour heterogeneity and epithelial-fibroblast interactions in recurrent bladder cancer

Affiliations

Integrated single-cell and spatial transcriptomic profiling reveals higher intratumour heterogeneity and epithelial-fibroblast interactions in recurrent bladder cancer

Zhen-Duo Shi et al. Clin Transl Med. 2023 Jul.

Abstract

Background: Recurrent bladder cancer is the most common type of urinary tract malignancy; nevertheless, the mechanistic basis for its recurrence is uncertain. Innovative technologies such as single-cell transcriptomics and spatial transcriptomics (ST) offer new avenues for studying recurrent tumour progression at the single-cell level while preserving spatial data.

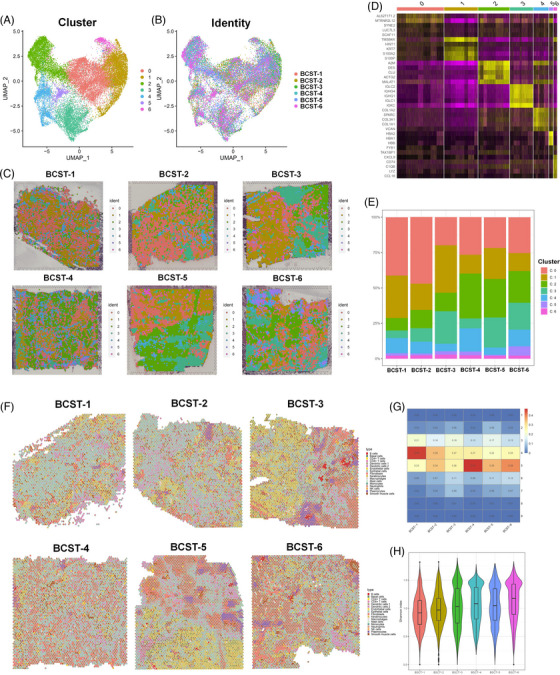
Method: This study integrated single-cell RNA (scRNA) sequencing and ST profiling to examine the tumour microenvironment (TME) of six bladder cancer tissues (three from primary tumours and three from recurrent tumours).

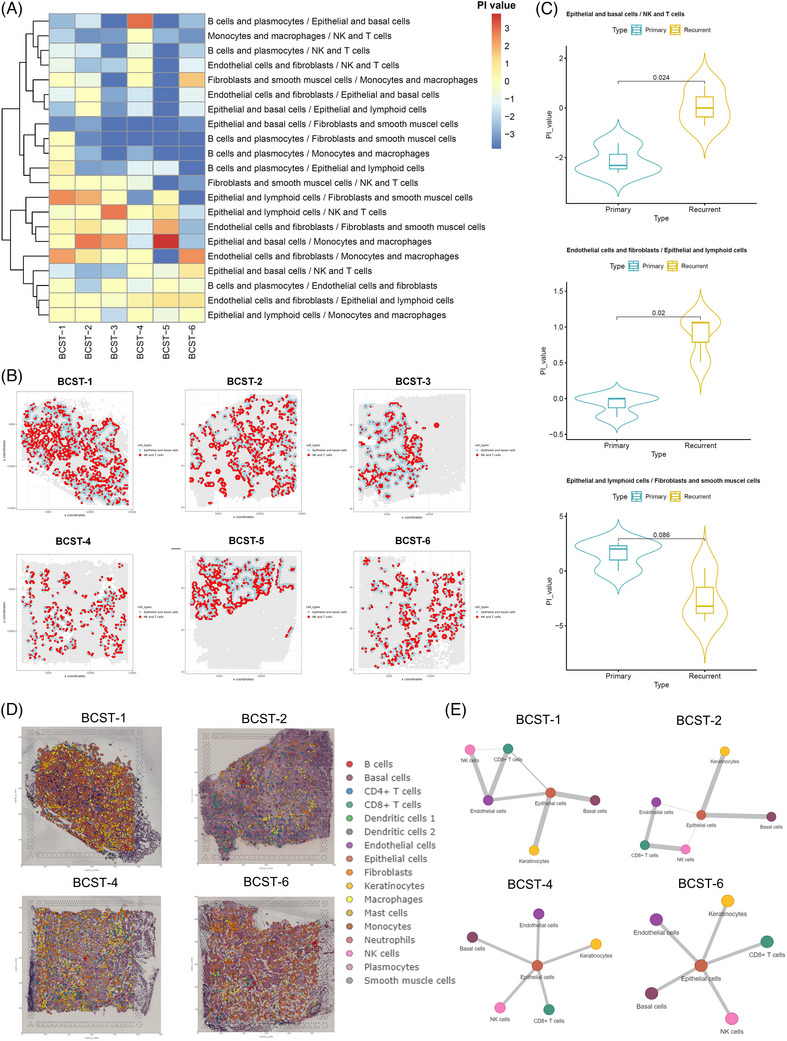
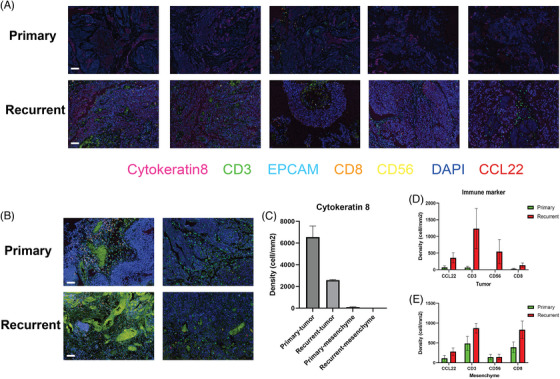
Findings: scRNA data-based ST deconvolution analysis revealed a much higher tumour heterogeneity along with TME in recurrent tumours than in primary tumours. High-resolution ST analysis further identified that while the overall natural killer/T cell and malignant cell count or the ratio of total cells was similar or even lower in the recurrent tumours, a higher interaction between epithelial and immune cells was detected. Moreover, the analysis of spatial communication reveals a marked increase in activity between cancer-associated fibroblasts (CAFs) and malignant cells, as well as other immune cells in recurrent tumours.

Interpretation: We observed an enhanced interplay between CAFs and malignant cells in bladder recurrent tumours. These findings were first observed at the spatial level.

Keywords: bladder cancer; fibroblast cell; single-cell sequencing; spatial transcriptome; tumour recurrence.


Conflict of interest statement

The authors declare they have no conflicts of interest.

Figures

FIGURE 1
FIGURE 1
Single‐cell RNA sequencing integrative and communication analysis between primary and recurrent bladder tumour. (A) Scheme of this integrated omics study. BC: bladder cancer; ST: spatial transcriptomics. (B) Uniform manifold approximation and projection (UMAP) and 27 cell clusters were annotated into (C) heatmap of canonical marker gene expression across 17 major cell types. (D) The relative composition of cell types in each primary and recurrent tumour. (E) Copy number variation analysis between recurrent and primary bladder tumours. (F) The predicted cell–cell crosstalk networks between primary and recurrent tumours are depicted in a bar plot along with the total number of interactions and interaction strength. (G) Heatmap displaying the general flow of information of diverse interactions across various types of cells. The total of the values shown in the heatmap's columns is depicted by the coloured bar plot above (incoming signalling). The total of the row of values is depicted by the right‐coloured bar plot (outgoing signalling). (H) Top representative differentially expressed (DE) ligand–receptor signalling pathways between primary and recurrent tumour. (I–K) Circle plots showing three representative DE ligand–receptor signal pathways between primary and recurrent tumours.
FIGURE 2
FIGURE 2
Basic and deconvolution analysis of 10× Visium spatial transcriptome of primary and recurrent bladder tumour. (A and B) Our integrative methodology effectively overcomes batch effects, as shown by the uniform manifold approximation and projection (UMAP), seven‐point clusters and UMAP breakdown according to sample origin. Bladder cancer spatial transcritpome (BCST) 1−3: primary, 4−6: recurrent. (C) Spatial localisation of individual clusters among different samples. (D) Heatmap of canonical marker gene expression across seven spot clusters. (E) The relative cell‐type composition of each primary and recurrent tumour. BCST 1−3: primary, 4−6: recurrent. (F) Pie chart visualisation of the cell type proportions as sections of a for each spot. (G) The percentage of cell type contributed to each spot among each spatial transcriptome. (H) α‐Diversity (Shannon index) comparison between primary and recurrent bladder tumour at the spot level.
FIGURE 3
FIGURE 3
Cell–cell proximate comparison between primary and recurrent bladder tumour. (A) Heatmap of cell–cell proximity enrichment score of seven spot clusters among six samples. The PI value was defined as log2 fold change (FC) × –log10 (adjusted p‐value), simulated by Giotto cellProximityEnrichment function. (B) Violin plot of the PI value between the pair of epithelial and basal cells/natural killer (NK) cells and T cells, endothelial cells and fibroblasts/epithelial and lymphoid cells, epithelial and lymphoid cells/fibroblasts, and smooth muscle cells. (C) Cell–cell proximity visualisation of C0: NK and T cells and C1: epithelial and basal cells, all six patients NK, T cell and epithelial basal cell–cell were labelled by red and blue colour, plotted by Giotto cellProximitySpatPlot2D function. (D) Co‐embedding analysis of single‐cell and spatial transcriptomes by CellTrek. (E) Spatial colocalisation analysis of NK cells, T cells and epithelial cells by Delaunay triangulation approach. BCST 1 and 2: primary, 4 and 6: recurrent.
FIGURE 4
FIGURE 4
Validation of increased natural killer (NK)/T and epithelial/basal cell–cell interactions by multiplex immunofluorescence experiments. (A) Featured scanned slides of tumour regions of primary and recurrent tumours. Each slide corresponds to tissue samples from a distinct individual. N = 5. The indicated colours represent different markers. Bar = 50 μm. (B) Featured scanned slides of mesenchyme of primary and recurrent tumours. (C) Density quantification of cytokeratin‐8 for determining tumour and mesenchyme regions. The Akoya Vectra Polaris Automated Quantitative Pathology Imaging System was used to scan the slides, and Akoya Inform software was used to quantify the results. N = 5. (D and E) Quantification results of NK/T‐cell population in the tumour and mesenchyme regions.
FIGURE 5
FIGURE 5
Spatial cell–cell communication differential analysis among seven spot clusters. (A) Fourteen spatially common differentially expressed ligand–receptor (L–R) signalling pathways between primary and recurrent bladder tumour. (B) Gene ontology functional enrichment analysis of spatially differentially expressed L–R genes. (C and D) Two representatively L–R genes (COL4A1 and SDC1) expression levels were imputed by BayesSpace. (E) Featured scanned slides of tumour regions of primary and recurrent tumours. The indicated colours represent different markers. Bar = 50 μm. (F) Cytokeratin‐19 was used to distinguish tumour and mesenchyme regions. (G) Quantification results of SDC1 and COL4A1 colocalisation in tumour and mesenchyme. Student's t‐test was conducted. * p < .05; ns: not significant.

References

    1. Parker J, Spiess PE. Current and emerging bladder cancer urinary biomarkers. ScientificWorld J. 2011;11:1103‐1112. - PMC - PubMed
    1. Kamat AM, Hahn NM, Efstathiou JA, et al. Bladder cancer. Lancet. 2016;388(10061):2796‐2810. - PubMed
    1. Lenis AT, Lec PM, Chamie K. Bladder cancer: a review. JAMA. 2020;324(19):1980‐1991. - PubMed
    1. Babjuk M, Böhle A, Burger M, et al. EAU guidelines on non‐muscle‐invasive urothelial carcinoma of the bladder: update 2016. Eur Urol. 2017;71(3):447‐461. - PubMed
    1. Ahmed R, Zaman T, Chowdhury F, et al. Single‐cell RNA sequencing with spatial transcriptomics of cancer tissues. Int J Mol Sci. 2022;23(6):3042. - PMC - PubMed

Publication types

LinkOut - more resources