. 2023 Sep;43(9):963-980.
doi: 10.1002/cac2.12457. Epub 2023 Jul 24.

Worldwide trends in esophageal cancer survival, by sub-site, morphology, and sex: an analysis of 696,974 adults diagnosed in 60 countries during 2000-2014 (CONCORD-3)

Affiliations

Worldwide trends in esophageal cancer survival, by sub-site, morphology, and sex: an analysis of 696,974 adults diagnosed in 60 countries during 2000-2014 (CONCORD-3)

Melissa Matz et al. Cancer Commun (Lond). 2023 Sep.

Abstract

Background: Esophageal cancer survival is poor worldwide, though there is some variation. Differences in the distribution of anatomical sub-site and morphological sub-type may help explain international differences in survival for all esophageal cancers combined. We estimated survival by anatomic sub-site and morphological sub-type to understand further the impact of topography and morphology on international comparisons of esophageal cancer survival.

Methods: We estimated age-standardized one-year and five-year net survival among adults (15-99 years) diagnosed with esophageal cancer in each of 60 participating countries to monitor survival trends by calendar period of diagnosis (2000-2004, 2005-2009, 2010-2014), sub-site, morphology, and sex.

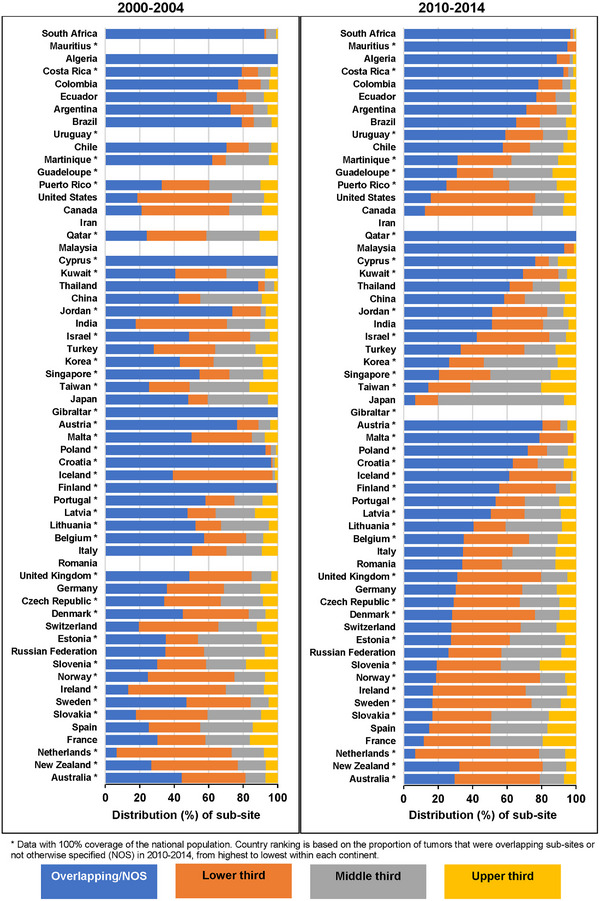
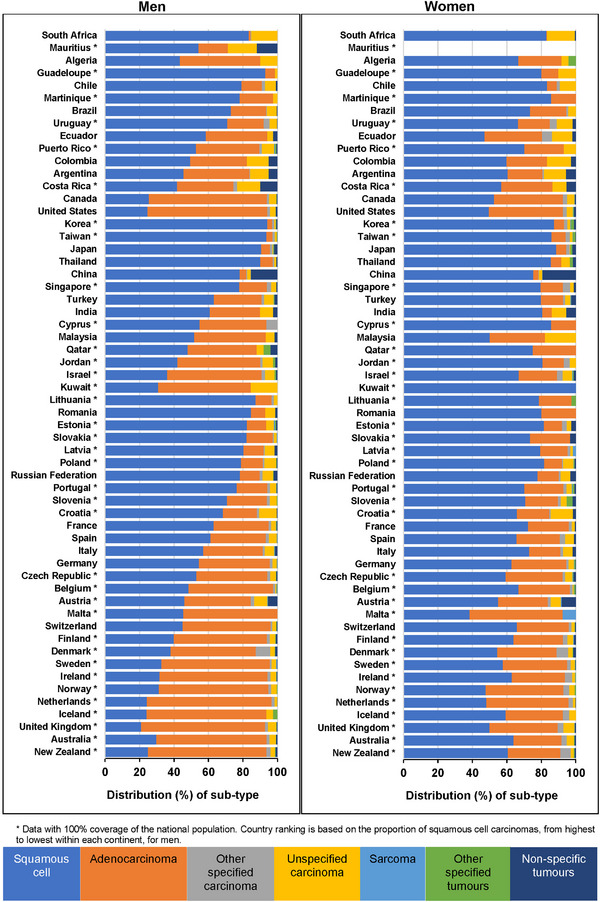
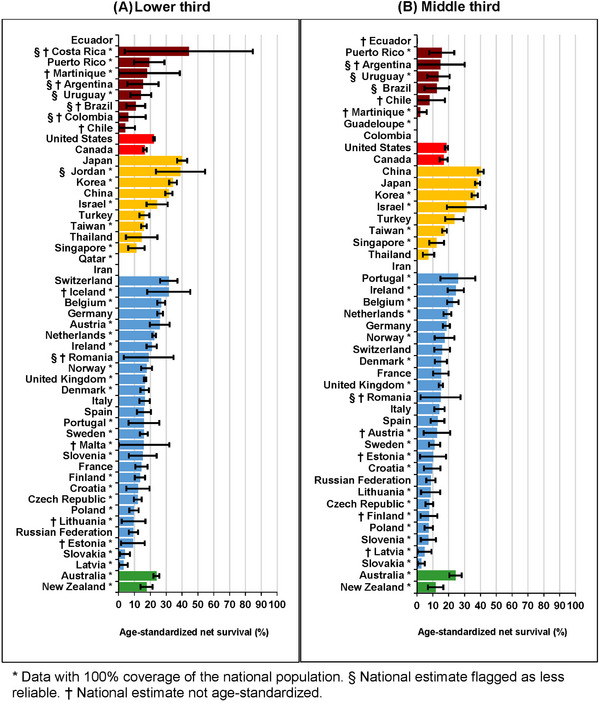
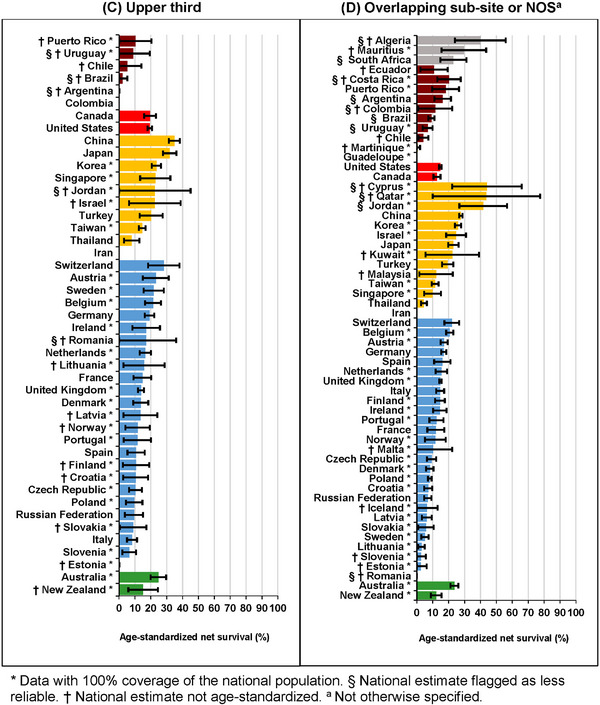
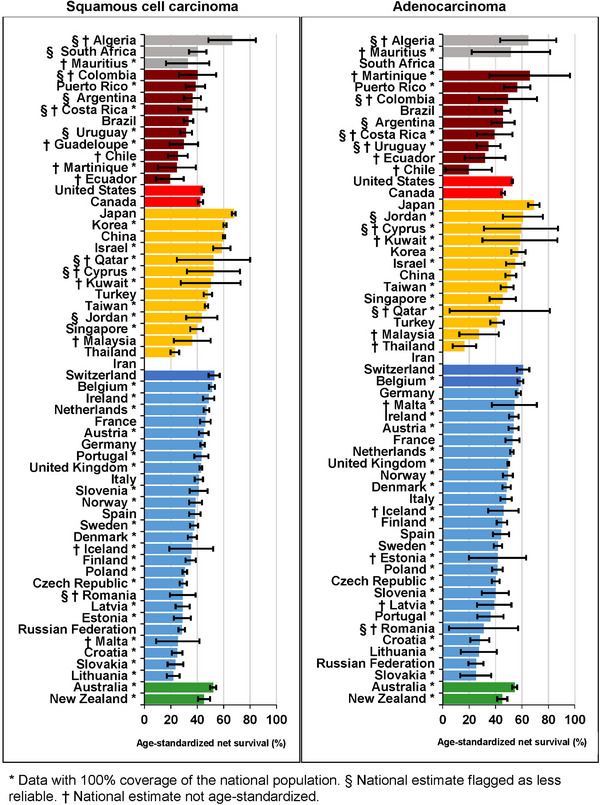
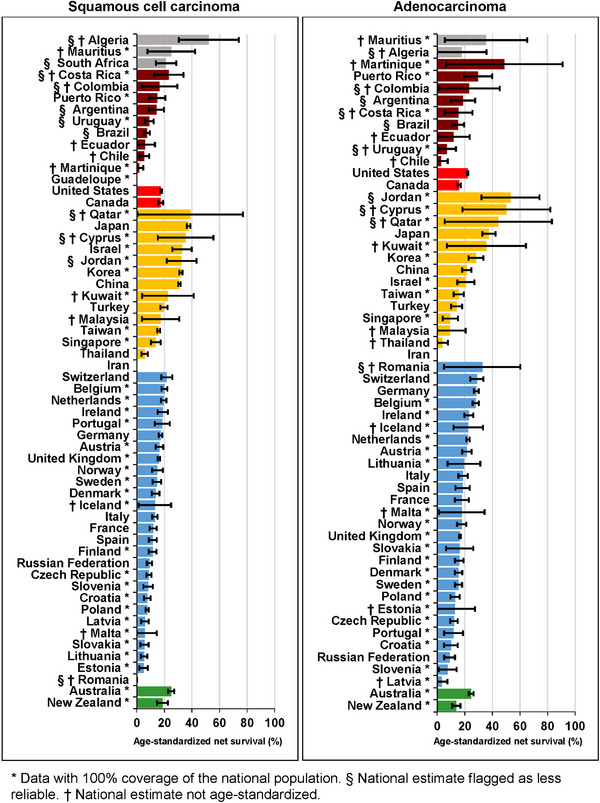
Results: For adults diagnosed during 2010-2014, tumors in the lower third of the esophagus were the most common, followed by tumors of overlapping sub-site and sub-site not otherwise specified. The proportion of squamous cell carcinomas diagnosed during 2010-2014 was generally higher in Asian countries (50%-90%), while adenocarcinomas were more common in Europe, North America and Oceania (50%-60%). From 2000-2004 to 2010-2014, the proportion of squamous cell carcinoma generally decreased, and the proportion of adenocarcinoma increased. Over time, there were few improvements in age-standardized five-year survival for each sub-site. Age-standardized one-year survival was highest in Japan for both squamous cell carcinoma (67.7%) and adenocarcinoma (69.0%), ranging between 20%-60% in most other countries. Age-standardized five-year survival from squamous cell carcinoma and adenocarcinoma was similar for most countries included, around 15%-20% for adults diagnosed during 2010-2014, though international variation was wider for squamous cell carcinoma. In most countries, survival for both squamous cell carcinoma and adenocarcinoma increased by less than 5% between 2000-2004 and 2010-2014.

Conclusions: Esophageal cancer survival remains poor in many countries. The distributions of sub-site and morphological sub-type vary between countries, but these differences do not fully explain international variation in esophageal cancer survival.

Keywords: Cancer; esophagus; morphology; survival; topography; trends.


Conflict of interest statement

The authors declare no conflicts of interest.

Figures

FIGURE 1
FIGURE 1
Distribution of anatomic sub‐site by country and calendar period of diagnosis: adults (15‐99 years) diagnosed with esophageal cancer. * Data with 100% coverage of the national population. Country ranking is based on the proportion of tumors overlapping sub‐sites or not otherwise specified (NOS) in 2010‐2014, from highest to lowest within each continent.
FIGURE 2
FIGURE 2
Distribution of morphological sub‐types by sex and country: adults (15‐99 years) diagnosed with esophageal cancer during 2010‐2014. * Data with 100% coverage of the national population. Country ranking is based on the proportion of squamous cell carcinomas, from highest to lowest within each continent, for men.
FIGURE 3
FIGURE 3
Age‐standardized five‐year net survival (%) by anatomic sub‐site and country: adults (15‐99 years) diagnosed with esophageal cancer during 2010‐2014. (A) Age‐standardized five‐year net survival (%) by country: adults (15‐99 years) diagnosed with tumors of the lower third of the esophagus during 2010‐2014. (B) Age‐standardized five‐year net survival (%) by country: adults (15‐99 years) diagnosed with tumors of the middle third of the esophagus during 2010‐2014. (C) Age‐standardized five‐year net survival (%) by country: adults (15‐99 years) diagnosed with tumors of the upper third of the esophagus during 2010‐2014. (D) Age‐standardized five‐year net survival (%) by country: adults (15‐99 years) diagnosed with tumors overlapping sub‐sites or not otherwise specified (NOS) during 2010‐2014. * Data with 100% coverage of the national population. § National estimate flagged as less reliable. † National estimate not age‐standardized. a Not otherwise specified. The different colors represent the types of countries in terms of continental/geographical location, e.g., Africa, South America, North America, Asia, Middle East, Europe, etc.
FIGURE 3
FIGURE 3
Age‐standardized five‐year net survival (%) by anatomic sub‐site and country: adults (15‐99 years) diagnosed with esophageal cancer during 2010‐2014. (A) Age‐standardized five‐year net survival (%) by country: adults (15‐99 years) diagnosed with tumors of the lower third of the esophagus during 2010‐2014. (B) Age‐standardized five‐year net survival (%) by country: adults (15‐99 years) diagnosed with tumors of the middle third of the esophagus during 2010‐2014. (C) Age‐standardized five‐year net survival (%) by country: adults (15‐99 years) diagnosed with tumors of the upper third of the esophagus during 2010‐2014. (D) Age‐standardized five‐year net survival (%) by country: adults (15‐99 years) diagnosed with tumors overlapping sub‐sites or not otherwise specified (NOS) during 2010‐2014. * Data with 100% coverage of the national population. § National estimate flagged as less reliable. † National estimate not age‐standardized. a Not otherwise specified. The different colors represent the types of countries in terms of continental/geographical location, e.g., Africa, South America, North America, Asia, Middle East, Europe, etc.
FIGURE 4
FIGURE 4
Age‐standardized one‐year net survival (%) by morphological sub‐type and country: adults (15‐99 years) diagnosed with esophageal cancer during 2010‐2014. * Data with 100% coverage of the national population. § National estimate flagged as less reliable. † National estimate not age‐standardized. The different colors represent the types of countries in terms of continental/geographical location, e.g., Africa, South America, North America, Asia, Middle East, Europe, etc.
FIGURE 5
FIGURE 5
Five‐year net survival (%) by morphological sub‐type and country: adults (15‐99 years) diagnosed with esophageal cancer during 2010‐2014. * Data with 100% coverage of the national population. § National estimate flagged as less reliable. † National estimate not age‐standardized. The different colors represent the types of countries in terms of continental/geographical location, e.g., Africa, South America, North America, Asia, Middle East, Europe, etc.

References

    1. Allemani C, Matsuda T, Di Carlo V, Harewood R, Matz M, Nikšić M, et al. Global surveillance of trends in cancer survival 2000‐14 (CONCORD‐3): analysis of individual records for 37,513,025 patients diagnosed with one of 18 cancers from 322 population‐based registries in 71 countries. The Lancet. 2018;391(10125):1023–75. - PMC - PubMed
    1. Allemani C, Weir HK, Carreira H, Harewood R, Spika D, Wang X‐S, et al. Global surveillance of cancer survival 1995‐2009: analysis of individual data for 25,676,887 patients from 279 population‐based registries in 67 countries (CONCORD‐2). The Lancet. 2015;385(9972):977–1010. - PMC - PubMed
    1. Lagergren J, Smyth E, Cunningham D, Lagergren P. Oesophageal cancer. The Lancet. 2017;390(10110):2383–96. - PubMed
    1. Schottenfeld D, Fraumeni JF. Cancer epidemiology and prevention. 3rd ed. Oxford; New York: Oxford University Press; 2006. xviii, 1392 p. p.
    1. Crane LM, Schaapveld M, Visser O, Louwman MW, Plukker JT, van Dam GM. Oesophageal cancer in The Netherlands: increasing incidence and mortality but improving survival. European Journal of Cancer. 2007;43(9):1445–51. - PubMed

Publication types