. 2024 Feb;19(2):416-424.
doi: 10.4103/1673-5374.379051.

Ethanol changes Nestin-promoter induced neural stem cells to disturb newborn dendritic spine remodeling in the hippocampus of mice

Affiliations

Ethanol changes Nestin-promoter induced neural stem cells to disturb newborn dendritic spine remodeling in the hippocampus of mice

Guixiang Wang et al. Neural Regen Res. 2024 Feb.

Abstract

Adolescent binge drinking leads to long-lasting disorders of the adult central nervous system, particularly aberrant hippocampal neurogenesis. In this study, we applied in vivo fluorescent tracing using NestinCreERT2::Rosa26-tdTomato mice and analyzed the endogenous neurogenesis lineage progression of neural stem cells (NSCs) and dendritic spine formation of newborn neurons in the subgranular zone of the dentate gyrus. We found abnormal orientation of tamoxifen-induced tdTomato+ (tdTom+) NSCs in adult mice 2 months after treatment with EtOH (5.0 g/kg, i.p.) for 7 consecutive days. EtOH markedly inhibited tdTom+ NSCs activation and hippocampal neurogenesis in mouse dentate gyrus from adolescence to adulthood. EtOH (100 mM) also significantly inhibited the proliferation to 39.2% and differentiation of primary NSCs in vitro. Adult mice exposed to EtOH also exhibited marked inhibitions in dendritic spine growth and newborn neuron maturation in the dentate gyrus, which was partially reversed by voluntary running or inhibition of the mammalian target of rapamycin-enhancer of zeste homolog 2 pathway. In vivo tracing revealed that EtOH induced abnormal orientation of tdTom+ NSCs and spatial misposition defects of newborn neurons, thus causing the disturbance of hippocampal neurogenesis and dendritic spine remodeling in mice.

Keywords: EZH2; adolescence; adulthood; dentate gyrus; ethanol; in vivo; lineage progression; mTOR; neural stem cell; newborn dendritic spine; newborn neurons; tracing.


Conflict of interest statement

None

Figures

Figure 1
Figure 1
EtOH induces abnormal activation of tdTom+ NSCs in the DG. (A, B) Schematic diagrams of the experimental design. EtOH (5.0 g/kg, i.p.) was given to mice and TAM (100 mg/kg, i.p.) was injected to induce tdTomato expression. (C) Representative confocal images of DAPI+tdTom+ NCs (DAPI, blue; tdTom, red). Scale bars: 200 μm. (D) Quantification of DAPI+tdTom+ NCs. (E, F) Representative confocal images of tdTom+MCM2+ PCs, GFAP+MCM2+ aNSCs, and GFAP+tdTom+ NSCs (GFAP, green, Alexa Fluor 488; MCM2, white, Alexa Fluor 647). The boxed regions are shown at a higher magnification in the right panels. Scale bars: 100 μm. (G, H, J) Quantifications of GFAP+tdTom+ NSCs (G), GFAP+tdTom+MCM2+ aNSCs (H), and tdTom+MCM2+ PCs (J). (I, K, L) The proportions of GFAP+tdTom+ NSCs (I), tdTom+MCM2+ PCs (K), and GFAP+tdTom+MCM2+ aNSCs (L) in total tdTom+ NCs. Data are presented as mean ± SEM (n = 5 mice/group). *P < 0.05, **P < 0.01, ***P < 0.001, vs. 1 month Ctrl group; ###P < 0.001 (two-way analysis of variance with Fisher’s least significant difference test). 1M and 2M represent the analysis, which was done 1 or 2 months after the last EtOH administration. aNSCs: Activated NSCs; Ctrl: control; DAPI: 4′,6-diamidino-2-phenylindole; DG: dentate gyrus; EtOH: ethanol; GFAP: glial fibrillary acidic protein; MCM2: minichromosome maintenance protein 2; NCs: neural cells; NSCs: neural stem cells; PCs: proliferative cells; tdTom+: tdTomato+.
Figure 2
Figure 2
EtOH induces the blockade of dentate newborn neuron maturation. (A, B) Representative confocal images of DCX+tdTom+MCM2+ tdTom+ PNBs, DCX+MCM2+ PNBs, tdTom+MCM2+ PCs, and tdTom+DCX+ NBs (DCX, green, Alexa Fluor 488; tdTom, red; MCM2, white, Alexa Fluor 647). The four differently shaped arrowheads point to tdTom+ PNBs, PNBs, PCs, and NBs, as shown in the right panels. Scale bars: 50 μm. (C, E) Quantifications of DCX+tdTom+ NBs (C) and DCX+tdTom+MCM2+ tdTom+ PNBs (E). (D, F) The proportions of DCX+tdTom+ NBs (D) and DCX+tdTom+MCM2+ tdTom+ PNBs (F) in total tdTom+ NCs. (G) Representative confocal images of tdTom+ NCs. Boxed areas are magnified on the right. Scale bars: 40 μm. (H) Lineage progression analysis of NSCs, as indicated by quantification of tdTom+ NCs in the DG. Data are presented as mean ± SEM (number of animals, n = 5/group). **P < 0.01, ***P < 0.001, vs. 1 month Ctrl group; ##P < 0.01, ###P < 0.001 (two-way analysis of variance with Fisher’s least significant difference test). 1M and 2M represent the analysis, which was done 1 or 2 months after the last EtOH administration. Ctrl: Control; DCX: doublecortin; DG: dentate gyrus; EtOH: ethanol; MCM2: minichromosome maintenance protein 2; NBs: neuroblasts; NCs: neural cells; NSCs: neural stem cells; PCs: proliferative cells; PNBs: proliferative NBs; tdTom+: tdTomato+.
Figure 3
Figure 3
EtOH disturbs the development of dentate BrdU+ neurons from adolescence to adulthood. (A) Schematic diagram of the experimental procedure in adult mice. (B) Representative confocal images of EtOH or vehicle treatment. The four differently shaped arrowheads point to BrdU+DCXNeuN non-neurons (NNs), BrdU+DCX+NeuN NBs, BrdU+DCX+NeuN+ IMNs, and BrdU+DCXNeuN+ MNs, as shown in the right panels (DCX, green, Alexa Fluor 488; BrdU, red, Alexa Fluor 555; NeuN, blue, Alexa Fluor 647). Scale bars: 20 μm. (C–F) Quantification of total BrdU+ cells (C), NBs (D), IMNs (E), and MNs (F) in the DG of EtOH-treated and control (Ctrl) adult mice. (G) Pie charts showing the proportions of the different cell types in the total population of BrdU+ cells. (H) Schematic diagram of the experimental procedure in adolescent mice. (I) Representative confocal images of EtOH and vehicle treatment. The four different arrowheads point to the different cell types as in B. Scale bars: 20 μm. (J–M) Quantifications of total BrdU+ cells (J), NBs (K), IMNs (L), and MNs (M) in the DG of EtOH-treated and Ctrl adult mice. (N) Pie charts showing the proportions of different cell types in the total BrdU+ cell population. Data are presented as mean ± SEM (number of animals, n = 6/group). *P < 0.05, **P < 0.01, ***P < 0.001, vs. Ctrl group (Student’s t-test). BrdU: Bromodeoxyuridine; Ctrl: control; DCX: doublecortin; DG: dentate gyrus; EtOH: ethanol; IMNs: immature neurons; MNs: mature neurons; NBs: neuroblasts; NeuN: neuronal nuclei; NNs: non-neurons.
Figure 4
Figure 4
EtOH sustains to suppress temporal and spatial dendritic development and spine formation in dentate newborn neurons. (A–C) Representative confocal image (A) and statistical analysis of tdTom+ NSCs in the SGZ (B, two-way analysis of variance with Fisher’s least significant difference test) and tdTom+ newborn neurons in the GCL (C, Student’s t-test). A mapping scheme was used to measure the orientation tuning and migration distance of tdTom+ NCs in the DG. (D) Representative confocal images of reconstructions of newborn neurons from tdTom+ cells in the GCL at 1 or 2 months after EtOH treatment. Scale bars: 20 μm. (E, F) Cumulative distribution plots of total dendrite length (E) and total numbers of branches (F) in the GCL (Kolmogorov-Smirnov test). (G) Sholl analysis of the dendritic complexity of tdTom+ newborn neurons in the GCL (the same groups of cells were analyzed as in E and F. (H) Representative confocal images of spines in tdTom+ newborn neurons in the DG. Scale bars: 10 μm. (I, J) Quantification of the numbers of spines per μm (I, two-way analysis of variance with Fisher’s least significant difference test) and the percentage of different types of spines in tdTom+ newborn neurons (J, two-way analysis of variance with Fisher’s least significant difference test). Data are presented as mean ± SEM (B, C, E, F: number of traced neurons: 1 month Ctrl group: n = 28, 1-month EtOH group: n = 27, 2 months Ctrl group: n = 32, 2 months EtOH group: n = 30; G, I, J: n = 5). *P < 0.05, **P < 0.01, ***P < 0.001, vs. 1 month Ctrl group; #P < 0.05, ##P < 0.01, ###P < 0.001. Ctrl: Control; DG: dentate gyrus; EtOH: ethanol; GCL: granule cell layer; NCs: neural cells; NSCs: neural stem cells; SGZ: subgranular zone; TAM: tamoxifen; tdTom+: tdTomato+.
Figure 5
Figure 5
Voluntary running ameliorates the negative effect of EtOH on the lineage progression of dentate NSCs into MNs. (A) Schematic diagram of the design of the voluntary running experiment in mice. EtOH (5.0 g/kg, i.p.) and TAM (100 mg/kg, i.p.) were injected to induce tdTomato expression and voluntary running for 1 month. (B) Representative confocal images tdTom+MCM2+ PCs, GFAP+MCM2+ aNSCs, and GFAP+tdTom+ NSCs (GFAP, green, Alexa Fluor 488; tdTom, red; MCM2, white, Alexa Fluor 647). The boxed regions are shown at a higher magnification in the right panels. Scale bars: 100 μm. (C) Quantification of DAPI+tdTom+ NCs (Student’s t-test). (D–F) Quantification of NSCs (D), PCs (E), and aNSCs (F) (Student’s t-test). (G–I) Percentages of NSCs (G), PCs (H), and aNSCs (I) in total tdTom+ NCs (Student’s t-test). (J) Representative confocal images of DCX+tdTom+ NBs, tdTom+ NCs, and DCX+ NBs (DCX, green, Alexa Fluor 488; tdTom, red) for two groups (Ctrl+Running and EtOH+Running). The three differently shaped arrows point to tdTom+ NBs, NCs, and NBs, as indicated in the right panels. Scale bars: 50 μm. (K) Quantification of DCX+tdTom+ NBs (Student’s t-test). (L) Percentage of DCX+tdTom+ NBs in total tdTom+ NCs (Student’s t-test). (M) Representative confocal images of tdTom+ NCs. Scale bars: 55 μm. (N) Quantification of lineage progression of tdTom+ NCs in the DG (two-way ANOVA with Fisher’s least significant difference test). Data are presented as mean ± SEM (number of animals, n = 6). *P < 0.05, **P < 0.01, ***P < 0.001, vs. Ctrl + running group. aNSCs: Activated NSCs; Ctrl: control; DAPI: 4′,6-diamidino-2-phenylindole; DCX: doublecortin; DG: dentate gyrus; EtOH: ethanol; GFAP: glial fibrillary acidic protein; MCM2: minichromosome maintenance protein 2; MNs: mature neurons; NBs: neuroblasts; NCs: neural cells; NSCs: neural stem cells; PCs: proliferative cells; TAM: tamoxifen; tdTom+: tdTomato+.
Figure 6
Figure 6
Voluntary running suppresses the dendritic development and spine formation induced by EtOH in dentate newborn neurons. (A) Representative reconstructions, based on confocal images, of tdTom+ newborn neurons in the GCL of mice exposed to voluntary running. Scale bars: 20 μm. (B, C) Cumulative distribution plots of total dendrite length (B) and total number of branches (C) in the GCL (number of traced neurons: Ctrl + running: n = 32, EtOH + running: n = 34; Kolmogorov-Smirnov test). (D) Sholl analysis of the dendritic complexity of tdTom+ newborn neurons in the GCL (the same groups of cells were analyzed as in B and C). (E) Representative confocal images of spines in tdTom+ newborn neurons in the DG. Scale bars: 10 μm. (F, G) Quantification of the number of spines per μm (F, Student’s t-test) and percentage of different types of spines in tdTom+ newborn neurons (G, two-way analysis of variance with Fisher’s least significant difference test). Data are presented as mean ± SEM (number of animals, n = 6). *P < 0.05, **P < 0.01, ***P < 0.001, vs. Ctrl + running group. Ctrl: Control; DG: dentate gyrus; EtOH: ethanol; GCL: granule cell layer; tdTom+: tdTomato+.
Figure 7
Figure 7
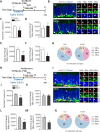
Rapamycin alleviates the EtOH-induced retardation of dendritic spine maturation through inhibition of the mTOR-EZH2 pathway. (A–E) Sample western blot images (A) and statistical analysis of primary NSC cultures exposed to EtOH (100 mM) or vehicle, including H3K27me3 (B), H3K9me3 (C), H3K36me3 (D) and H3K4me4 (E) (number of independent experiments, n = 4, *P < 0.05, vs. Ctrl group; Student’s t-test). (F) Sample confocal images of Nestin+ (green, Alexa Fluor 488), H3K27me3+ (red, Alexa Fluor 555), and DAPI (blue) cells. Scale bars: 45 μm. (G) Mander’s coefficients of colocation of H3K27me3 and DAPI (number of independent experiments, n = 6, about 1000 cells/group, ***P < 0.001, vs. Ctrl group; Student’s t-test). (H) Schematic diagram of the experiment to test the effect of the mTOR inhibitor rapamycin (Rap) treatment. (I, J) Sample confocal images after rapamycin treatment and EtOH injection along with quantification of H3K27me3+ (red, Alexa Fluor 488) and DAPI (blue) cells in the SGZ (number of animals, n = 5, **P < 0.01, ***P < 0.001, vs. Ctrl + Veh group; #P < 0.05; two-way analysis of variance with least significant difference test). Scale bars: 50 μm. (K, L) Representative confocal images after rapamycin treatment and EtOH injection along with quantification of pS6+ (red, Alexa Fluor 488) and DAPI (blue) cells in mouse DG (number of animals, n = 5, **P < 0.01, ***P < 0.001, vs. Ctrl + Veh group; ###P < 0.001; two-way analysis of variance with least significant difference test). Scale bars: 50 μm. (M) Representative confocal images of spines in tdTom+ newborn neurons in the DG for two groups (Ctrl+Rap and EtOH+Rap). Scale bars: 10 μm. (N, O) Quantification of the number of spines per μm (number of animals, n = 6, ***P < 0.001, vs. Ctrl + Rap group; Student’s t-test) and the percentage of different types of spines in tdTom+ newborn neurons (O, number of animals, n = 6, **P < 0.01, vs. Ctrl + Rap group; two-way analysis of variance with Fisher’s least significant difference test). Data are presented as mean ± SEM. Ctrl: Control; DAPI: 4′,6-diamidino-2-phenylindole; DG: dentate gyrus; EtOH: ethanol; EZH2: enhancer of zeste homolog 2; H3K27me3: trimethylated Lys 27 of histone 3; H3K36me3: trimethylated Lys 36 of histone 3; H3K4me3: trimethylated Lys 4 of histone 3; H3K9me3: trimethylated Lys 9 of histone 3; mTOR: the mammalian target of rapamycin; NSCs: neural stem cells; pS6: protein S6; Rap: rapamycin; SGZ: subgranular zone; TAM: tamoxifen; Veh: vehicle.

Similar articles

Cited by

References

    1. Alaux-Cantin S, Warnault V, Legastelois R, Botia B, Pierrefiche O, Vilpoux C, Naassila M. Alcohol intoxications during adolescence increase motivation for alcohol in adult rats and induce neuroadaptations in the nucleus accumbens. Neuropharmacology. (2013);67:521–531. - PubMed
    1. Anderson ML, Nokia MS, Govindaraju KP, Shors TJ. Moderate drinking?Alcohol consumption significantly decreases neurogenesis in the adult hippocampus. Neuroscience. (2012);224:202–209. - PMC - PubMed
    1. Balthazart J, Ball GF. Endogenous versus exogenous markers of adult neurogenesis in canaries and other birds:advantages and disadvantages. J Comp Neurol. (2014);522:4100–4120. - PMC - PubMed
    1. Barnett A, David E, Rohlman A, Nikolova VD, Moy SS, Vetreno RP, Coleman LG., Jr Adolescent binge alcohol enhances early Alzheimer's disease pathology in adulthood through proinflammatory neuroimmune activation. Front Pharmacol. (2022);13:884170. - PMC - PubMed
    1. Bartels C, Kunert HJ, Stawicki S, Kroner-Herwig B, Ehrenreich H, Krampe H. Recovery of hippocampus-related functions in chronic alcoholics during monitored long-term abstinence. Alcohol Alcohol. (2007);42:92–102. - PubMed