

Colorectal Cancer Organoid-Stroma Biobank Allows Subtype-Specific Assessment of Individualized Therapy Responses
- PMID: 37489084
- PMCID: PMC10551667
- DOI: 10.1158/2159-8290.CD-23-0050
Colorectal Cancer Organoid-Stroma Biobank Allows Subtype-Specific Assessment of Individualized Therapy Responses
Abstract
In colorectal cancers, the tumor microenvironment plays a key role in prognosis and therapy efficacy. Patient-derived tumor organoids (PDTO) show enormous potential for preclinical testing; however, cultured tumor cells lose important characteristics, including the consensus molecular subtypes (CMS). To better reflect the cellular heterogeneity, we established the colorectal cancer organoid-stroma biobank of matched PDTOs and cancer-associated fibroblasts (CAF) from 30 patients. Context-specific phenotyping showed that xenotransplantation or coculture with CAFs improves the transcriptomic fidelity and instructs subtype-specific stromal gene expression. Furthermore, functional profiling in coculture exposed CMS4-specific therapeutic resistance to gefitinib and SN-38 and prognostic expression signatures. Chemogenomic library screening identified patient- and therapy-dependent mechanisms of stromal resistance including MET as a common target. Our results demonstrate that colorectal cancer phenotypes are encrypted in the cancer epithelium in a plastic fashion that strongly depends on the context. Consequently, CAFs are essential for a faithful representation of molecular subtypes and therapy responses ex vivo.
Significance: Systematic characterization of the organoid-stroma biobank provides a resource for context dependency in colorectal cancer. We demonstrate a colorectal cancer subtype memory of PDTOs that is independent of specific driver mutations. Our data underscore the importance of functional profiling in cocultures for improved preclinical testing and identification of stromal resistance mechanisms. This article is featured in Selected Articles from This Issue, p. 2109.
©2023 The Authors; Published by the American Association for Cancer Research.
Figures
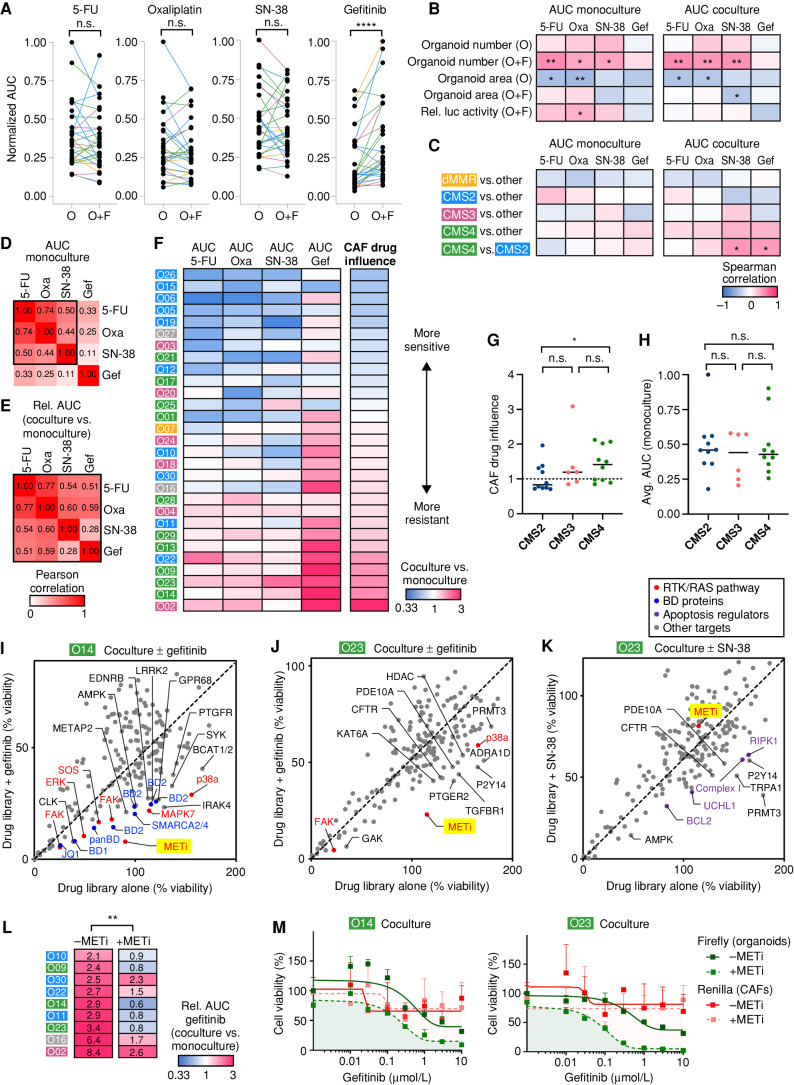
![Figure 5. CAFs’ influence on drug responses is dependent on the tumor cell compartment. A, Experimental setup for drug testing in cocultures using luciferase/GFP transduced organoids. B and C, Sensitivity to 5-FU, oxaliplatin, SN-38, and gefitinib in monoculture and coculture with autologous or heterologous CAFs. Tumor cell viability was measured by luciferase activity (mean ± SD in triplicate wells). Representative dose–response curves (B) and heat map of drug sensitivity [relative (rel.) AUC compared with monoculture; C]. Experiments were repeated twice. D, Measurement of organoid- and CAF-specific toxicity by dual luciferase assay. Coculture was performed using organoids expressing Firefly luciferase and matched CAFs expressing Renilla luciferase. Heat map shows normalized (norm.) AUC. CAFs show reduced sensitivity to all treatments compared with organoids. See Supplementary Figs. S9 and S10 and Supplementary Table S8.](https://cdn.ncbi.nlm.nih.gov/pmc/blobs/85ca/10551667/6cdb60a644b3/2192fig5.jpg)
References
-
- Miller KD, Nogueira L, Devasia T, Mariotto AB, Yabroff KR, Jemal A, et al. Cancer treatment and survivorship statistics, 2022. CA Cancer J Clin 2022;72:409–36. - PubMed
-
- Schmitt M, Greten FR. The inflammatory pathogenesis of colorectal cancer. Nat Rev Immunol 2021;21:653–67. - PubMed
-
- Trinh A, Trumpi K, De Sousa E Melo F, Wang X, de Jong JH, Fessler E, et al. Practical and robust identification of molecular subtypes in colorectal cancer by immunohistochemistry. Clin Cancer Res 2017;23:387–98. - PubMed
Publication types
MeSH terms
Grants and funding
LinkOut - more resources
Full Text Sources
Medical
Miscellaneous
