. 2023 Oct 1;325(4):G318-G333.
doi: 10.1152/ajpgi.00119.2023. Epub 2023 Jul 25.

Panaxynol alleviates colorectal cancer in a murine model via suppressing macrophages and inflammation

Affiliations

Panaxynol alleviates colorectal cancer in a murine model via suppressing macrophages and inflammation

Sierra J McDonald et al. Am J Physiol Gastrointest Liver Physiol. .

Abstract

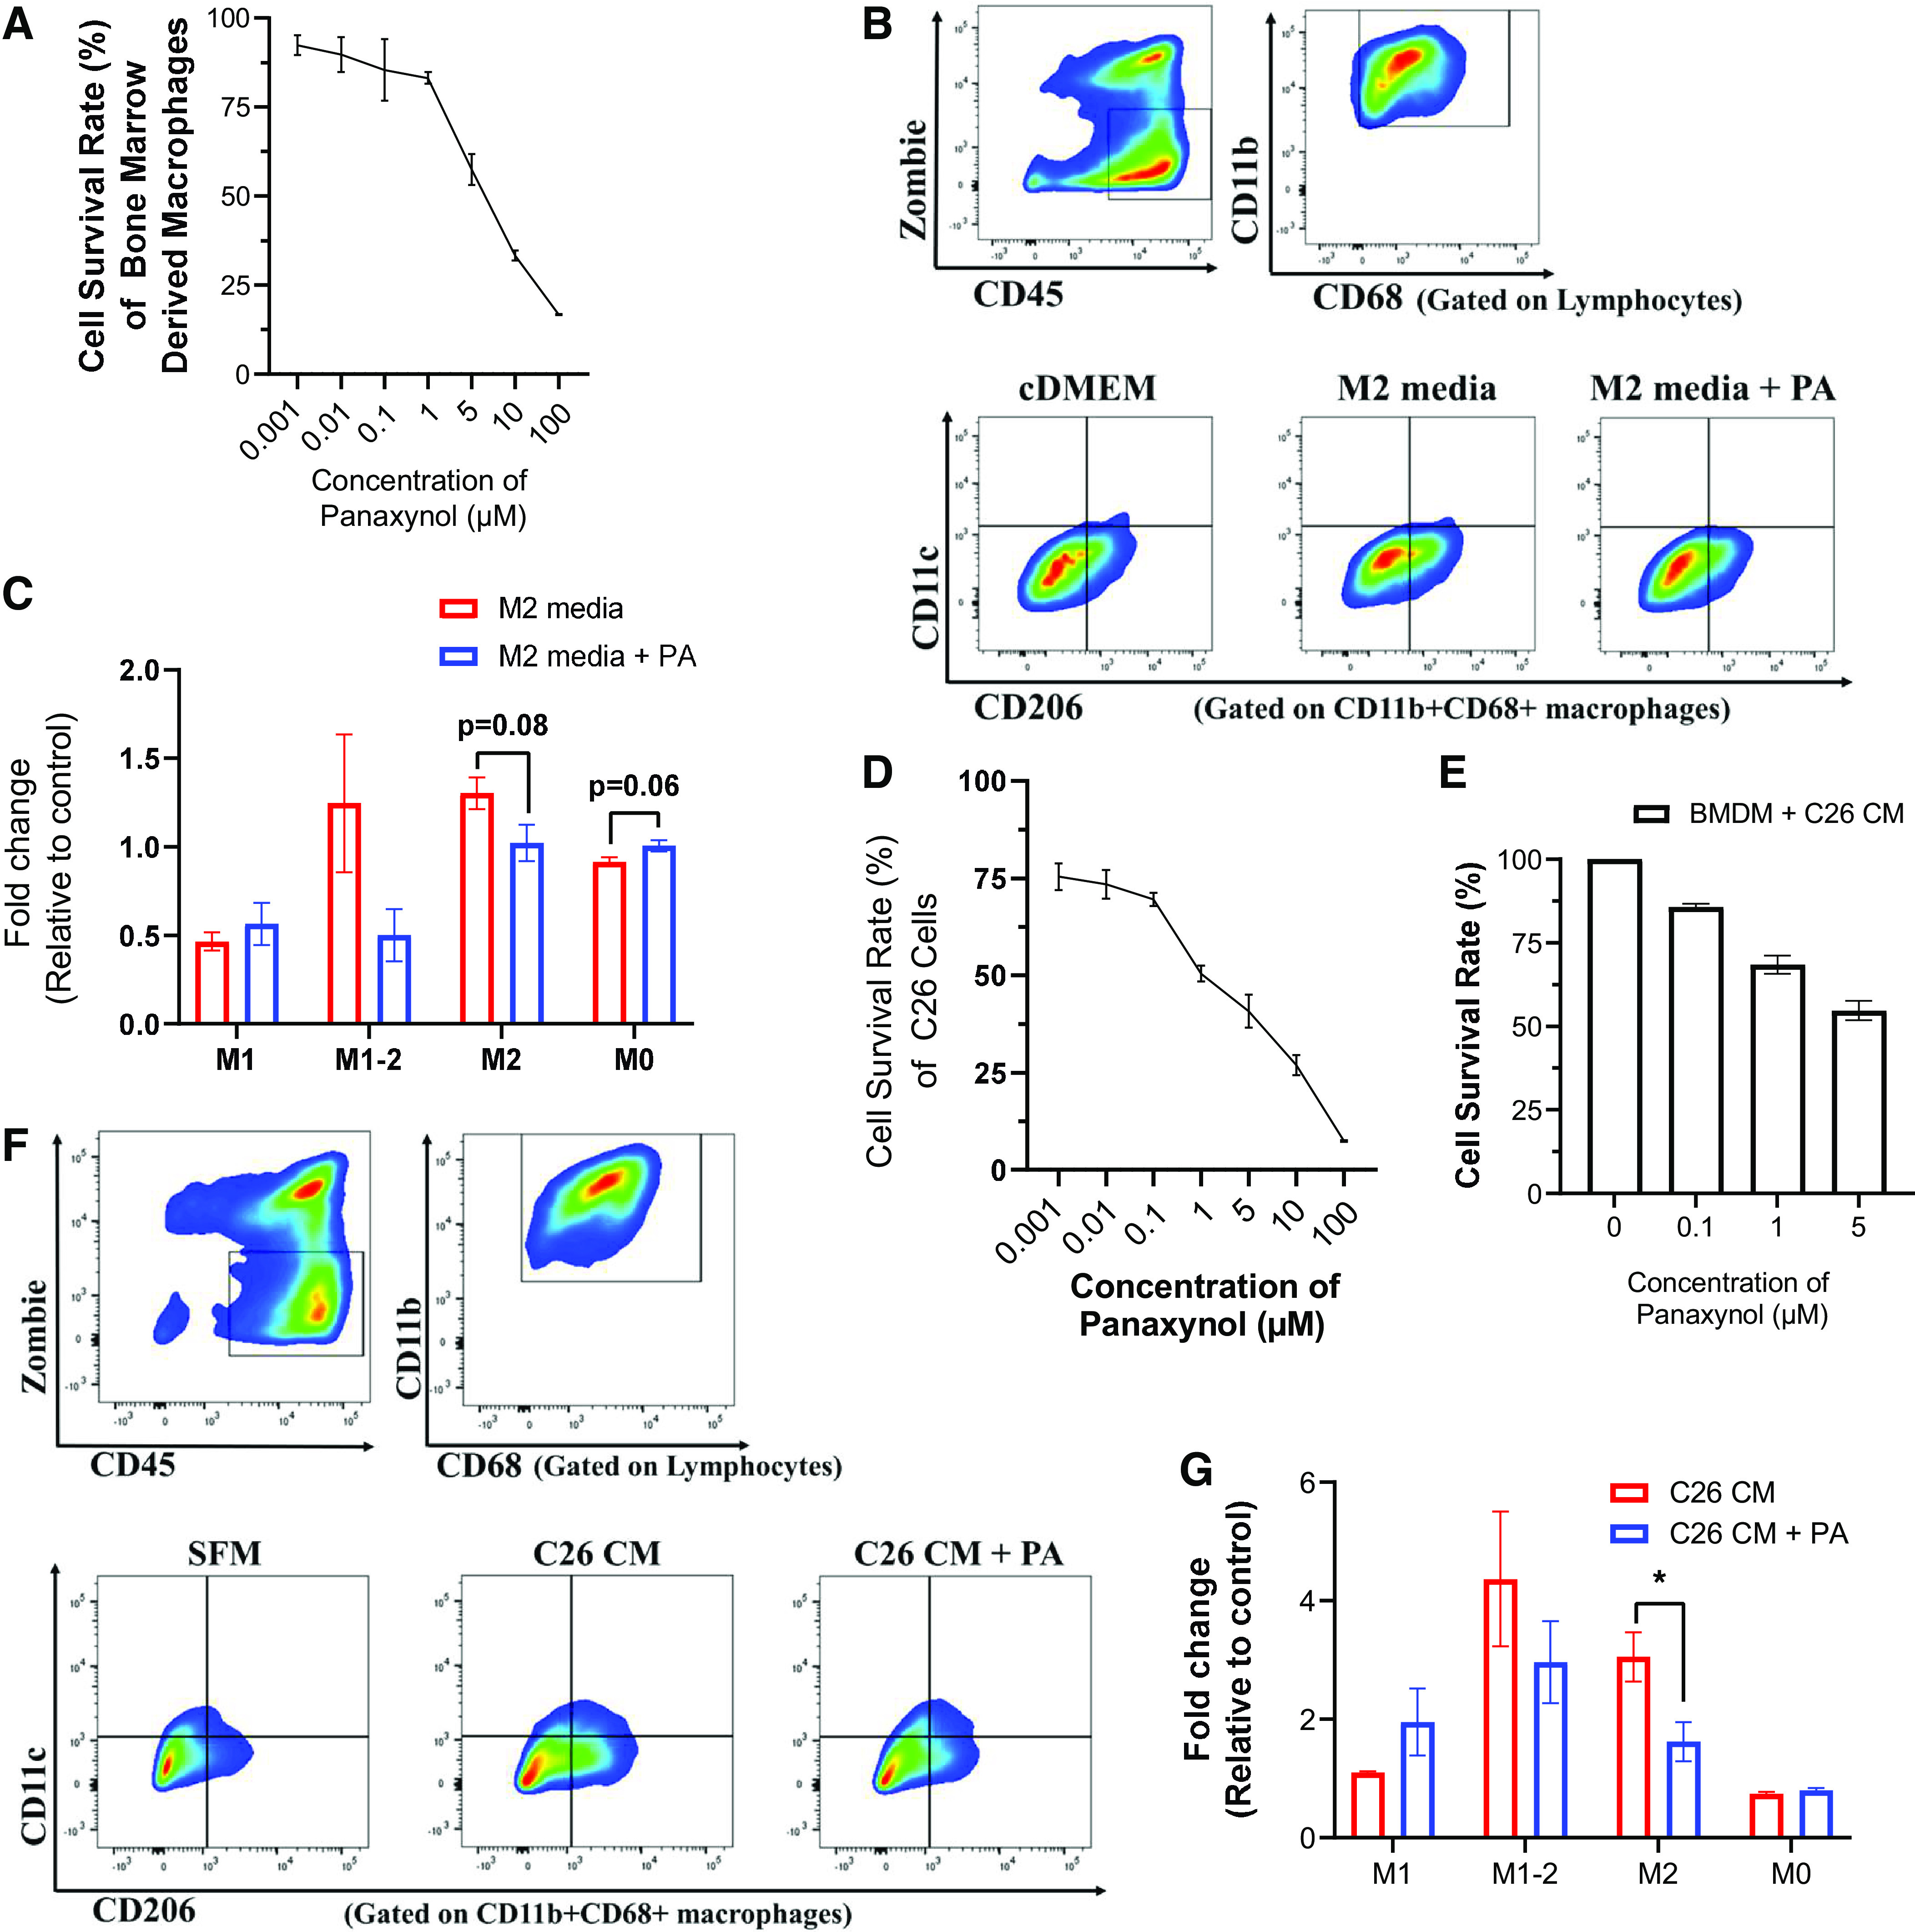
Currently available colorectal cancer (CRC) therapies have limited efficacy and severe adverse effects that may be overcome with the alternative use of natural compounds. We previously reported that panaxynol (PA), a bioactive component in American ginseng, possesses anticancer properties in vitro and suppresses murine colitis through its proapoptotic and anti-inflammatory properties. Because colitis is a predisposing factor of CRC and inflammation is a major driver of CRC, we sought to evaluate the therapeutic potential of PA in CRC. Azoxymethane-dextran sodium sulfate (AOM/DSS) mice (C57BL/6) were administered 2.5 mg/kg PA or vehicle 3 times/wk via oral gavage over 12 wk. PA improved clinical symptoms (P ≤ 0.05) and reduced tumorigenesis (P ≤ 0.05). This improvement may be reflective of PA's restorative effect on intestinal barrier function; PA upregulated the expression of essential tight junction and mucin genes (P ≤ 0.05) and increased the abundance of mucin-producing goblet cells (P ≤ 0.05). Given that macrophages play a substantial role in the pathogenesis of CRC and that we previously demonstrated that PA targets macrophages in colitis, we next assessed macrophages. We show that PA reduces the relative abundance of colonic macrophages within the lamina propria (P ≤ 0.05), and this was consistent with a reduction in the expression of important markers of macrophages and inflammation (P ≤ 0.05). We further confirmed PA's inhibitory effects on macrophages in vitro under CRC conditions (P ≤ 0.05). These results suggest that PA is a promising therapeutic compound to treat CRC and improve clinical symptoms given its ability to inhibit macrophages and modulate the inflammatory environment in the colon.NEW & NOTEWORTHY We report that panaxynol (PA) reduces colorectal cancer (CRC) by improving the colonic and tumor environment. Specifically, we demonstrate that PA improves crypt morphology, upregulates crucial tight junction and mucin genes, and promotes the abundance of mucin-producing goblet cells. Furthermore, PA reduces macrophages and associated inflammation, important drivers of CRC, in the colonic environment. This present study provides novel insights into the potential of PA as a therapeutic agent to ameliorate CRC tumorigenesis.

Keywords: AOM/DSS model; American ginseng; falcarinol; macrophages; natural compounds.


Conflict of interest statement

No conflicts of interest, financial or otherwise, are declared by the authors.

Figures

None
Graphical abstract
Figure 1.
Figure 1.
Panaxynol improves clinical symptoms and reduces inflammation in colon cancer. A: experimental design to induce azoxymethane-dextran sodium sulfate (AOM/DSS)-induced colorectal cancer (CRC) using 11-wk-old C57BL/6 female (n = 20) and male (n = 20) for 12 wk. B: probability of survival. C: overall symptom score accounting for percent body weight loss, stool consistency, and rectal bleeding. Significance was determined by multiple paired Student’s t tests between AOM/DSS-treated mice. D: circulating white blood cells (WBCs), lymphocytes (LYM), monocytes (MON), and neutrophils (NEU) determined in whole blood using VetScan HM5. Significance determined using ordinary one-way ANOVAs with Tukey multiple comparison test. E: neutrophil to lymphocyte ratio determined in whole blood. Significance determined using one-way ANOVA with Tukey multiple comparison test. For all data: *P ≤ 0.05; **P ≤ 0.005; and ***P ≤ 0.0005. PA, panaxynol; VEH, vehicle.
Figure 2.
Figure 2.
Panaxynol (PA) suppresses azoxymethane-dextran sodium sulfate (AOM/DSS) colorectal cancer. C57BL/6 cancer-free (n = 10), AOM/DSS + vehicle (VEH) (n = 14), AOM/DSS + PA (n = 17) mice after 12 wk of treatment. A: representative colonoscopy images. B: colonoscopy scores (n = 3/group). Significance was determined using an ordinary two-way ANOVA with Benjamini, Krieger, and Yekutieli multiple comparisons test. C: representative images of tumors in the distal (top) and proximal (bottom) portion of colons using a dissection microscope. DF: tumor count of total, small (≤1 mm), medium (1–2 mm), and large (>2 mm) tumors in AOM/DSS + VEH or AOM/DSS + PA female mice (D), male mice (E), and combined sexes (F). For tumor counts, significance was determined by multiple unpaired Student’s t tests. For all data: *P ≤ 0.05; **P ≤ 0.005; and ***P ≤ 0.0005.
Figure 3.
Figure 3.
Panaxynol (PA) increases apoptosis and reduces cell proliferation in colonic tumors. Immunohistochemistry of colonic tumors from azoxymethane-dextran sodium sulfate (AOM/DSS) + vehicle (VEH) and AOM/DSS + PA mice (n = 3/group) stained with TUNEL for detection of apoptotic cells and Ki67 to examine proliferation. A: representative ×20 images of colonic tumors stained with TUNEL (left) and Ki67 (right). Scale bar = 50 µm. B: percentage of apoptotic [positively stained TUNEL-diaminobenzidine (DAB)] cells relative to area (n = 3/group). C: gene expression analysis of Bax, a proapoptotic marker, within colonic tumors using qRT-PCR (n = 5/group). Data were normalized to AOM/DSS + VEH and compared with five reference targets (B2M, TBP, HPRT, HMBS, and H2AFV), which were evaluated for expression stability using GeNorm. D: percentage of Ki67 positive cells (positively stained Ki67-DAB) cells relative to area (n = 3/group). All significance was determined by unpaired Student’s t tests (***P ≤ 0.0005).
Figure 4.
Figure 4.
Panaxynol (PA) rescues intestinal barrier function. C57BL/6 cancer-free, azoxymethane-dextran sodium sulfate (AOM/DSS) + vehicle (VEH), AOM/DSS + PA mice after 12 wk of treatment. Representative images of hematoxylin and eosin (H&E; A) and alcian blue-stained (B) distal colons. C: average goblet cell count per crypt (n = 3/group). Significance determined using an ordinary one-way ANOVA with Tukey’s multiple comparisons test. D: RNA isolated from the proximal colons (n = 5–7/group) were used for gene analysis via qRT-PCR for tight junction permeability as indicated by occludin (OCLN), tight junction 3 (TJP3), mucin 1 (Muc1), and Muc2. Data were normalized to AOM/DSS + VEH and compared with five reference targets (B2M, TBP, HPRT, HMBS, and H2AFV) which were evaluated for expression stability using GeNorm. Significance was determined using unpaired Student’s t tests (P ≤ 0.05). For all data: *P ≤ 0.05; ***P ≤ 0.0005.
Figure 5.
Figure 5.
Panaxynol (PA) suppresses macrophages and improves the colonic environment in colorectal cancer. C57BL/6 cancer-free, azoxymethane-dextran sodium sulfate (AOM/DSS) + vehicle (VEH), AOM/DSS + PA mice were euthanized after 12 wk of treatment and distal colons were processed for flow analysis. A, B, F, and G: lamina propria (LP) cells were isolated from distal colons, gated for nondebris singlets, and considered live immune cells with ZombieGreenNeg/Low and CD45+. A: gating strategy of ZombieGreenNeg/Low and CD45+ immune cell population (top). From the LiveCD45+ population, CD11b+CD68+ cells were identified as macrophages (bottom). B: relative percentage of CD11b+CD68+ macrophages in the LP of colon (n = 5–8/group). Significance determined using an ordinary one-way ANOVA with Tukey’s multiple comparisons test. CE: RNA isolated from the proximal colons of AOM/DSS-treated VEH and PA mice were used for gene analysis via qRT-PCR (n = 5 or 6/group) using pan macrophage markers (CD68, Mrc1, and MSR1) (C); proinflammatory markers associated with M1 macrophages (IL-1β and IL-6) (D); and protumoral markers associated with M2 macrophages [IL-10, IL-13, and tumor growth factor β (TGF-β1)] (E). F: gating strategy of ZombieGreenNeg/Low and CD45+ immune cell population (top) of colonic LP cells. From the LiveCD45+ population, CD4+Ly6g+ cells were identified as neutrophils and representative flow plots are shown (bottom) (n = 2 or 3/group). G: RNA isolated from the proximal colons of C57BL/6 AOM/DSS + VEH and AOM/DSS + PA (n = 5 or 6/group) mice after 12 wk of treatment were used for gene analysis via qRT-PCR using neutrophil marker Ly6G. For all qRT-PCR, data were normalized to AOM/DSS + VEH and compared with five reference targets (B2M, TBP, HPRT, HMBS, and H2AFV) which were evaluated for expression stability using GeNorm; significance was determined using Student’s t tests. For all data: *P ≤ 0.05 and **P ≤ 0.005.
Figure 6.
Figure 6.
Panaxynol (PA) suppresses macrophages and improves the colonic environment in colon cancer. C57BL/6 cancer-free, azoxymethane-dextran sodium sulfate (AOM/DSS) + vehicle (VEH), AOM/DSS + PA mice were euthanized after 12 wk of treatment and colons following tumor removal were processed for flow analysis. A, B, E, and F: lamina propria (LP) cells were isolated from colons following tumor removal (n = 5–7/group), gated for nondebris singlets, and considered live immune cells with ZombieGreenNeg/Low and CD45+. A: gating strategy of ZombieGreenNeg/Low and CD45+ immune cell population (top). From the LiveCD45+ population, CD11b+CD68+ cells were identified as macrophages (bottom). B: relative percentage of CD11b+CD68+ macrophages in the LP of colon. Significance was determined using an ordinary one-way ANOVA with Tukey’s multiple comparisons test. C: RNA isolated from colonic tumors of AOM/DSS-treated VEH and PA mice were used for gene analysis via qRT-PCR (n = 4 or 5/group) using pan macrophage marker (CD68), proinflammatory marker associated with M1 macrophages (IL-6); and protumoral markers associated with M2 macrophages [IL-13 and tumor growth factor β (TGF-β1)]. D: representative ×20 images of immunofluorescence staining of pan macrophage marker F4/80 in colonic tumors of AOM/DSS+VEH and AOM/DSS+PA mice (n = 3/group). DAPI (blue) as an individual channel for visualization of nuclei (left), F4/80 (green) as an individual channel (middle) and merged (right). Scale bar = 100 µm. E: representative flow plots of TCRβ+FoxP3+ LP cells from colons following tumor removal in cancer-free, AOM/DSS +VEH, and AOM/DSS + PA mice were identified as regulatory T-cells (T-regs). F: relative percentage of TCRβ+FoxP3+ T-regs in the colonic LP. Significance was determined using an ordinary one-way ANOVA with Tukey’s multiple comparisons test. G: RNA isolated from colonic tumors of C57BL/6 AOM/DSS + VEH and AOM/DSS + PA (n = 4 or 5/group) mice after 12 wk of treatment were used for gene analysis via qRT-PCR using T-reg marker FoxP3. For all qRT-PCR, data were normalized to AOM/DSS + VEH and compared with five reference targets (B2M, TBP, HPRT, HMBS, and H2AFV), which were evaluated for expression stability using GeNorm; significance was determined using a Student’s t tests. For all data: *P ≤ 0.05 and **P ≤ 0.005.
Figure 7.
Figure 7.
Panaxynol (PA) reduces cell survival of bone marrow-derived macrophages and colorectal cancer cells and decreases protumoral M2 macrophages in vitro. A: percent cell survival rate of bone marrow-derived macrophages (BMDMs) treated with various concentrations of panaxynol in vitro for 24 h via Cell Counting Kit-8 (CCK-8). B and C: BMDMs under different conditions were gated for nondebris singlets and considered live immune cells with ZombieGreenNeg/Low and CD45+. From the Live CD45+ population, CD11b+CD68+ cells were identified as macrophages. From the CD11b+CD68+ macrophage population, CD206CD11c+ were identified as M1 macrophages; CD206+CD11c+ as M1-M2 transitional macrophages; CD206+CD11c cells as M2 macrophages; and CD206CD11c cells as M0 macrophages. B and C: flow plots identifying gating strategy for ZombieGreenNeg/LowCD45+ immune cells (top) and macrophage phenotype (bottom) using CD11c and CD206 expression in BMDMs incubated with cDMEM or M2-like macrophage media (IL-4) with or without 1 μM PA. C: relative fold change in percentage of macrophage phenotypes in BMDMs treated with or without 1 μM PA in the presence of M2-marophage stimulating media. Significance was determined using multiple Student’s t test (P ≤ 0.05). Percent cell survival rate of C26 colorectal cancer cells (D) or bone marrow-derived macrophages (BMDMs) (E) incubated with C26 tumor-conditioned media (C26 CM) treated with various concentrations of panaxynol in vitro. F and G: BMDMs were gated for nondebris singlets and considered live immune cells with ZombieGreenNeg/Low and CD45+. From the Live CD45+ population, CD11b+CD68+ cells were identified as macrophages. From the CD11b+CD68+ macrophage population, CD206CD11c+ were identified as M1 macrophages; CD206+CD11c+ as M1-M2 transitional macrophages; CD206+CD11c cells as M2 macrophages; and CD206CD11c cells as M0 macrophages. F: flow plots identifying gating strategy for ZombieGreenNeg/LowCD45+ immune cells (top left), CD11b+CD68+ macrophages (top right), and macrophage phenotype (bottom) using CD11c and CD206 expression in BMDMs incubated with SFM, C26 CM, or C26 CM+PA. G: relative fold change in percentage of macrophage phenotypes in BMDMs incubated with C26 CM or C26 CM + PA. All in vitro data are representative of three independent experiments; significance was determined using multiple Student’s t tests (P ≤ 0.05).

Comment in

References

    1. Sung H, Ferlay J, Siegel RL, Laversanne M, Soerjomataram I, Jemal A, Bray F. Global Cancer Statistics 2020: GLOBOCAN estimates of incidence and mortality worldwide for 36 cancers in 185 countries. CA Cancer J Clin 71: 209–249, 2021. doi:10.3322/caac.21660. - DOI - PubMed
    1. Chen C, Di Bartolomeo M, Corallo S, Strickler JH, Goyal L. Overcoming resistance to targeted therapies in gastrointestinal cancers: progress to date and progress to come. Am Soc Clin Oncol Educ Book 40: 161–173, 2020. doi:10.1200/EDBK_280871. - DOI - PubMed
    1. National Cancer Institute. SEER Stat Fact Sheets: Colon and Rectum Cancer (Online). National Cancer Institute, 2011. https://seer.cancer.gov/statfacts/html/colorect.html.
    1. Taieb J, André T, Auclin E. Refining adjuvant therapy for non-metastatic colon cancer, new standards and perspectives. Cancer Treat Rev 75: 1–11, 2019. doi:10.1016/j.ctrv.2019.02.002. - DOI - PubMed
    1. Hale KE. Toxicities of chemotherapy. In: Principles of Critical Care (4th ed.), edited by Hall JB, Schmidt GA, Kress JP.. New York: McGraw-Hill Education, chapt. 95, 2015.

Publication types

LinkOut - more resources