

A mixed-model approach for estimating drivers of microbiota community composition and differential taxonomic abundance
- PMID: 37489890
- PMCID: PMC10469806
- DOI: 10.1128/msystems.00040-23
A mixed-model approach for estimating drivers of microbiota community composition and differential taxonomic abundance
Abstract
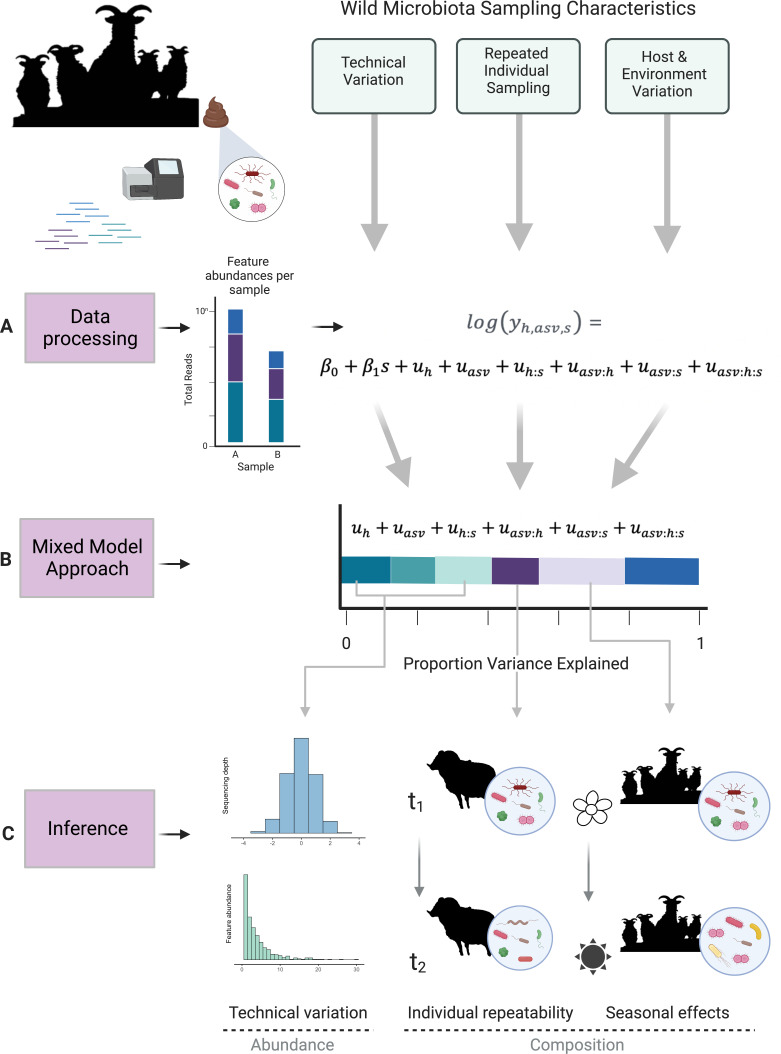
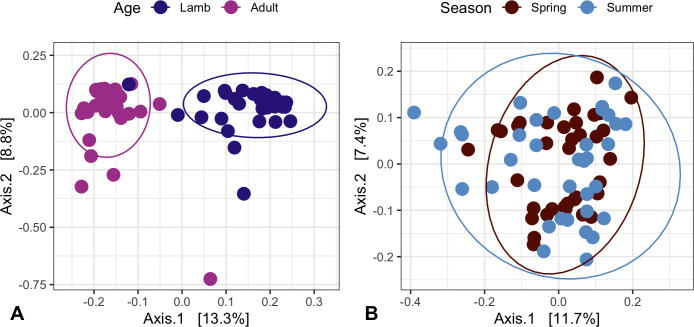
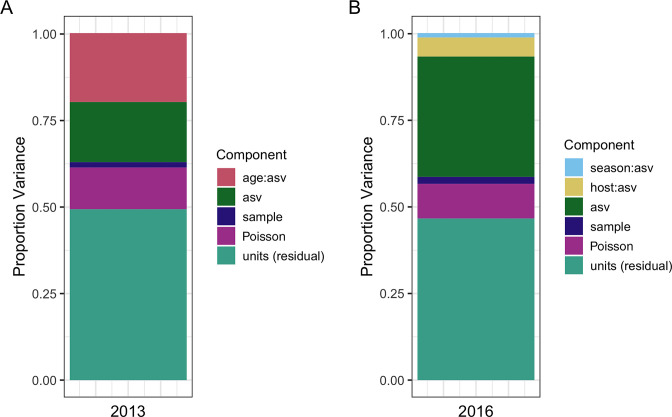
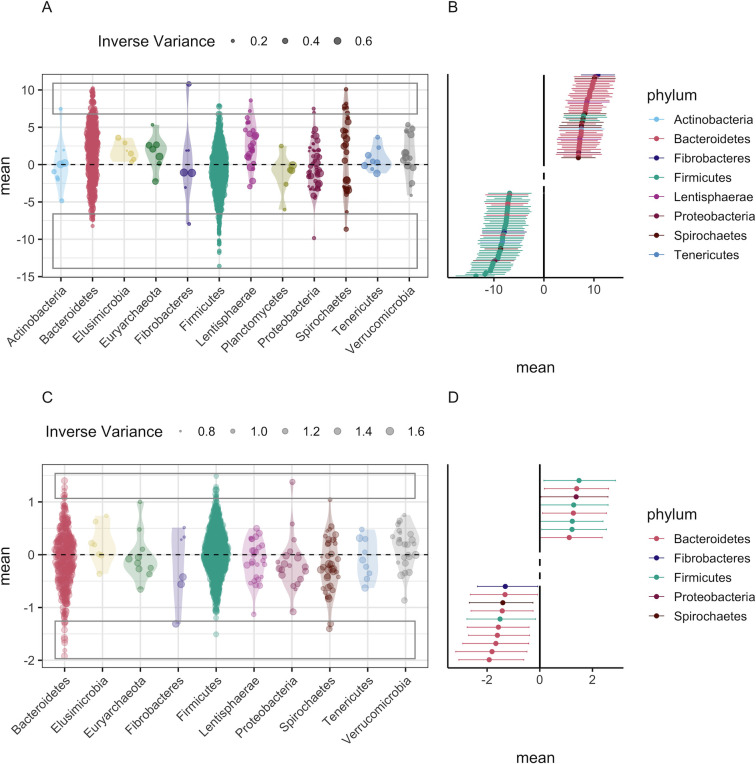
Next-generation sequencing (NGS) and metabarcoding approaches are increasingly applied to wild animal populations, but there is a disconnect between the widely applied generalized linear mixed model (GLMM) approaches commonly used to study phenotypic variation and the statistical toolkit from community ecology typically applied to metabarcoding data. Here, we describe the suitability of a novel GLMM-based approach for analyzing the taxon-specific sequence read counts derived from standard metabarcoding data. This approach allows decomposition of the contribution of different drivers to variation in community composition (e.g., age, season, individual) via interaction terms in the model random-effects structure. We provide guidance to implementing this approach and show how these models can identify how responsible specific taxonomic groups are for the effects attributed to different drivers. We applied this approach to two cross-sectional data sets from the Soay sheep population of St. Kilda. GLMMs showed agreement with dissimilarity-based approaches highlighting the substantial contribution of age and minimal contribution of season to microbiota community compositions, and simultaneously estimated the contribution of other technical and biological factors. We further used model predictions to show that age effects were principally due to increases in taxa of the phylum Bacteroidetes and declines in taxa of the phylum Firmicutes. This approach offers a powerful means for understanding the influence of drivers of community structure derived from metabarcoding data. We discuss how our approach could be readily adapted to allow researchers to estimate contributions of additional factors such as host or microbe phylogeny to answer emerging questions surrounding the ecological and evolutionary roles of within-host communities. IMPORTANCE NGS and fecal metabarcoding methods have provided powerful opportunities to study the wild gut microbiome. A wealth of data is, therefore, amassing across wild systems, generating the need for analytical approaches that can appropriately investigate simultaneous factors at the host and environmental scale that determine the composition of these communities. Here, we describe a generalized linear mixed-effects model (GLMM) approach to analyze read count data from metabarcoding of the gut microbiota, allowing us to quantify the contributions of multiple host and environmental factors to within-host community structure. Our approach provides outputs that are familiar to a majority of field ecologists and can be run using any standard mixed-effects modeling packages. We illustrate this approach using two metabarcoding data sets from the Soay sheep population of St. Kilda investigating age and season effects as worked examples.
Keywords: 16S; Bayesian estimation; amplicon sequence variants; community composition; differential abundance; generalized linear mixed-effects model; metabarcoding; microbiota.
Conflict of interest statement
The authors declare no conflict of interest.
Figures
References
-
- Cox-Foster DL, Conlan S, Holmes EC, Palacios G, Evans JD, Moran NA, Quan P-L, Briese T, Hornig M, Geiser DM, Martinson V, vanEngelsdorp D, Kalkstein AL, Drysdale A, Hui J, Zhai J, Cui L, Hutchison SK, Simons JF, Egholm M, Pettis JS, Lipkin WI. 2007. A metagenomic survey of microbes in honey bee colony collapse disorder. Science 318:283–287. doi: 10.1126/science.1146498 - DOI - PubMed
Publication types
MeSH terms
LinkOut - more resources
Full Text Sources
