. 2023 Sep 15;133(18):e168352.
doi: 10.1172/JCI168352.

SMAD4 maintains the fluid shear stress set point to protect against arterial-venous malformations

Affiliations

SMAD4 maintains the fluid shear stress set point to protect against arterial-venous malformations

Kuheli Banerjee et al. J Clin Invest. .

Abstract

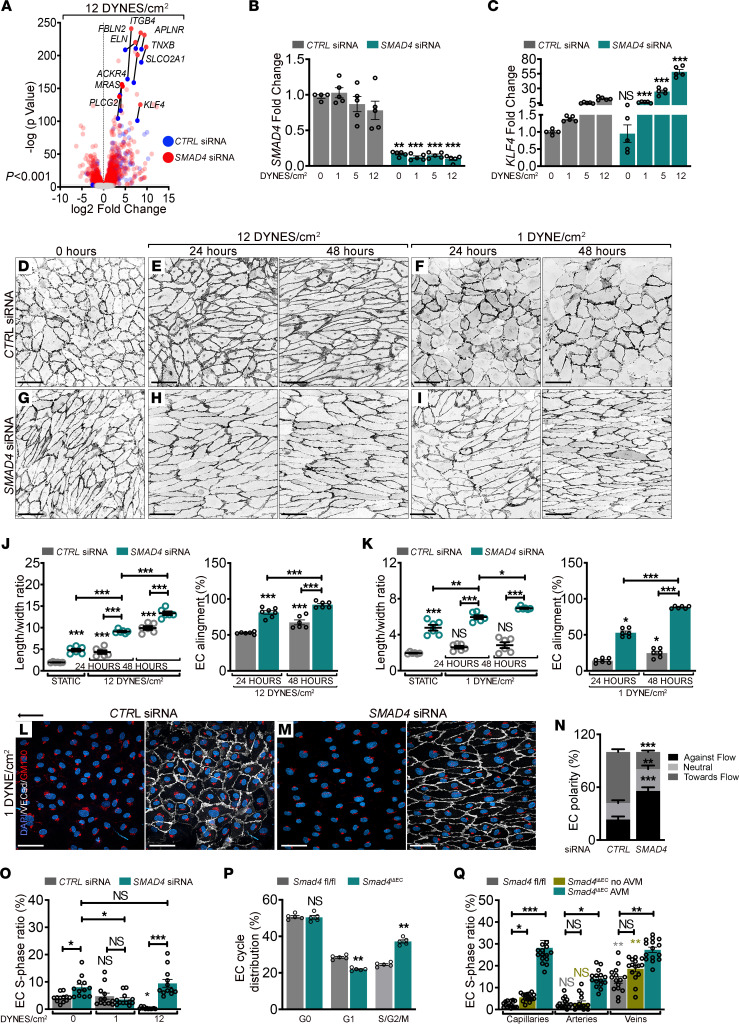
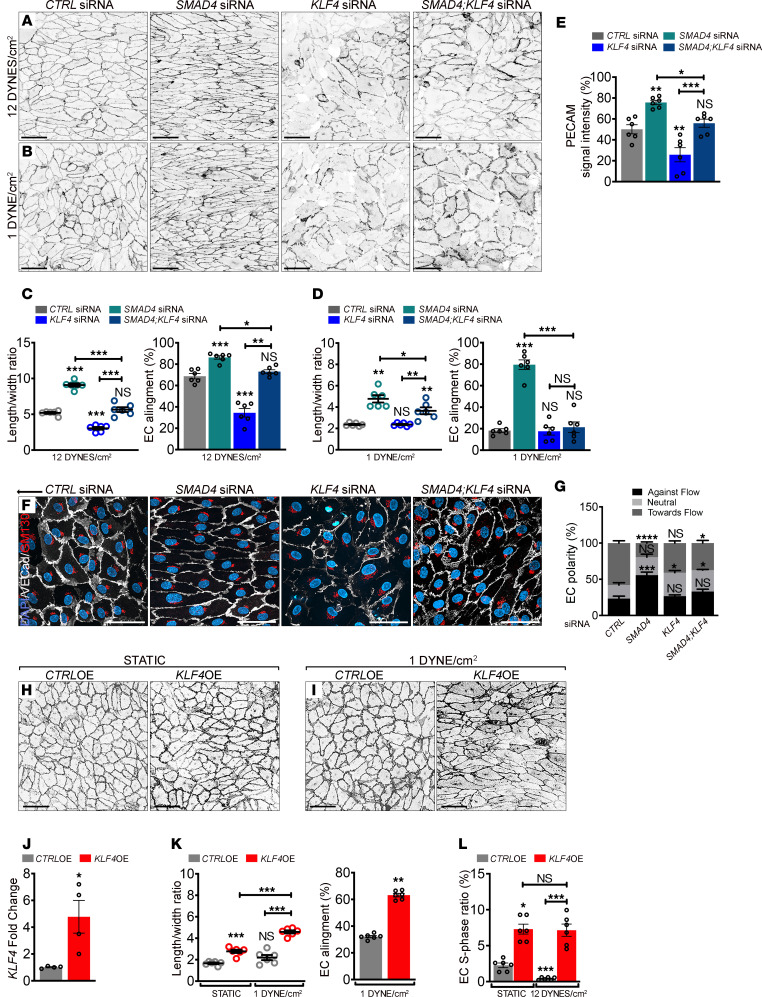
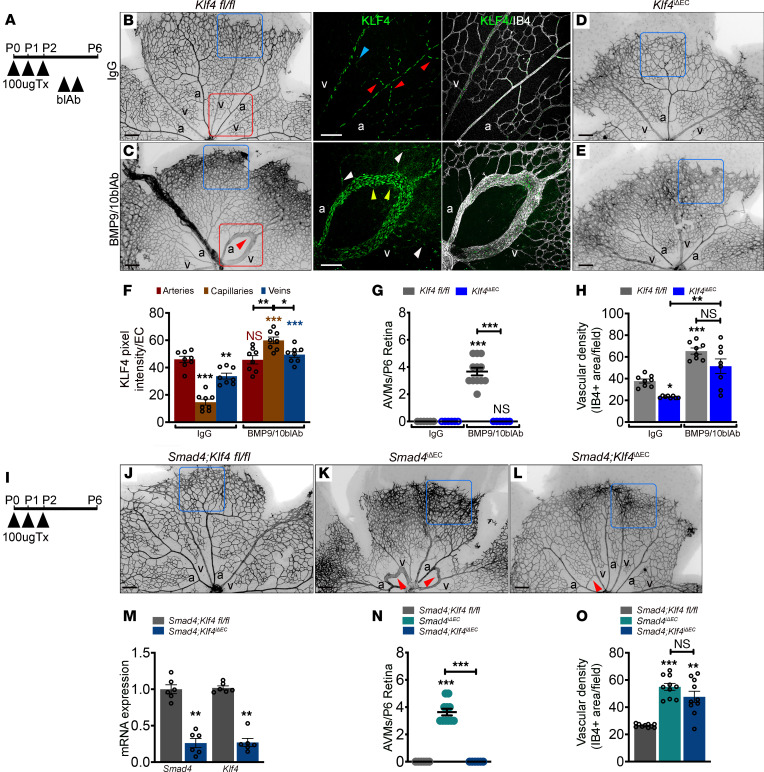
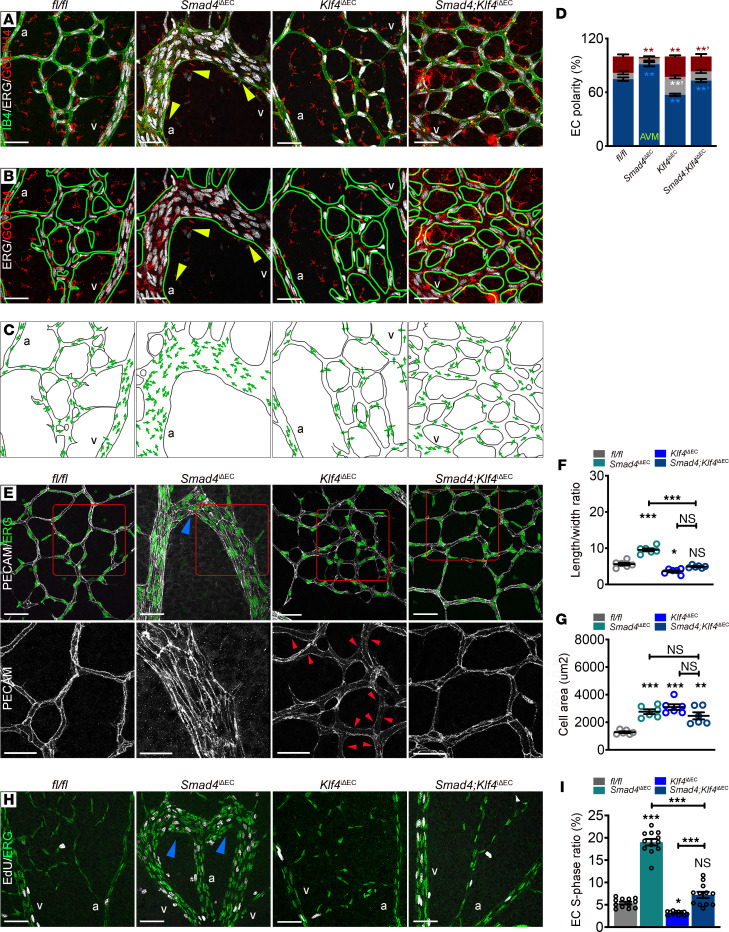
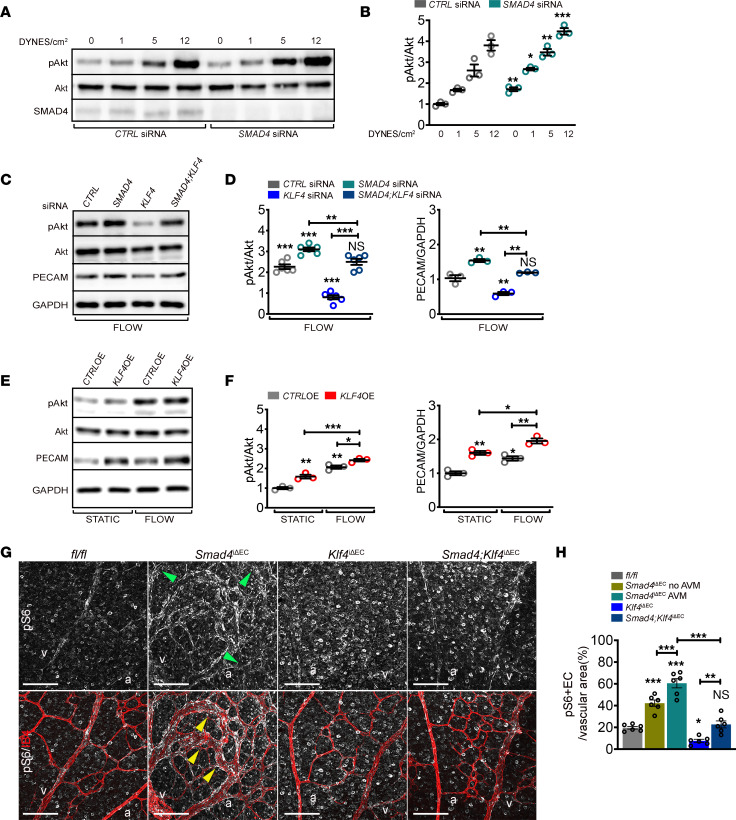
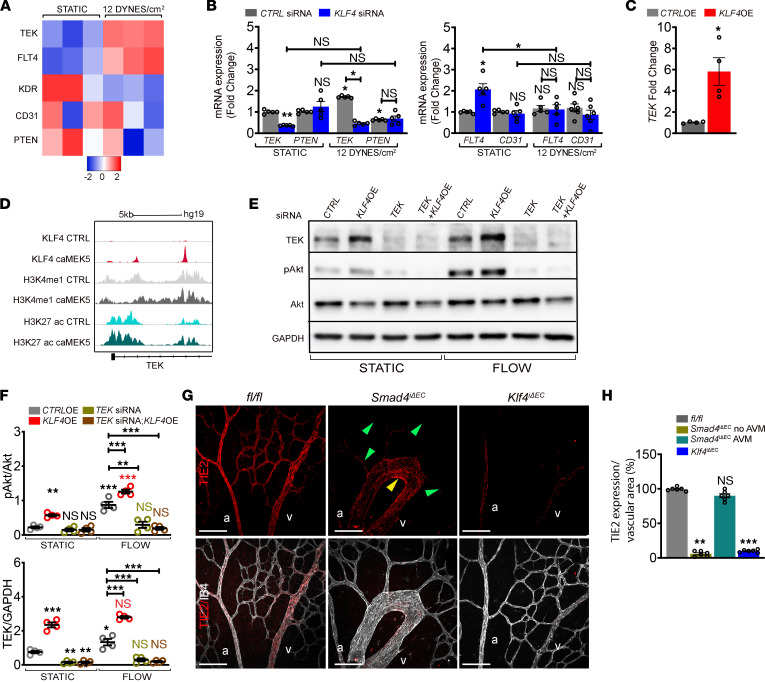
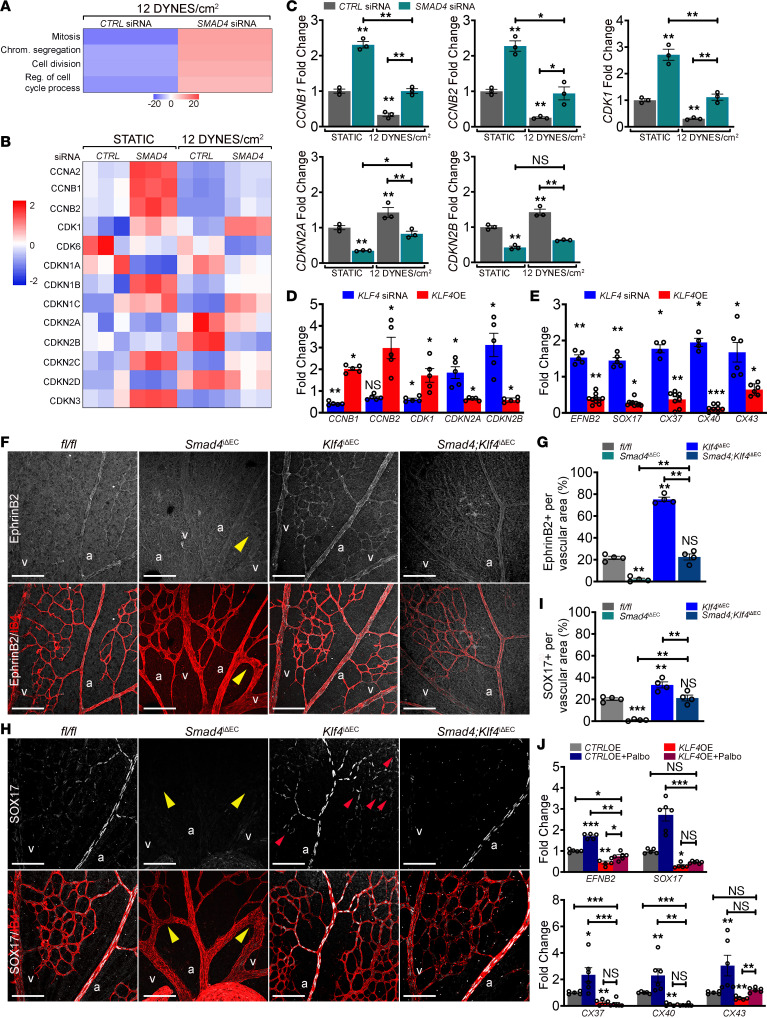
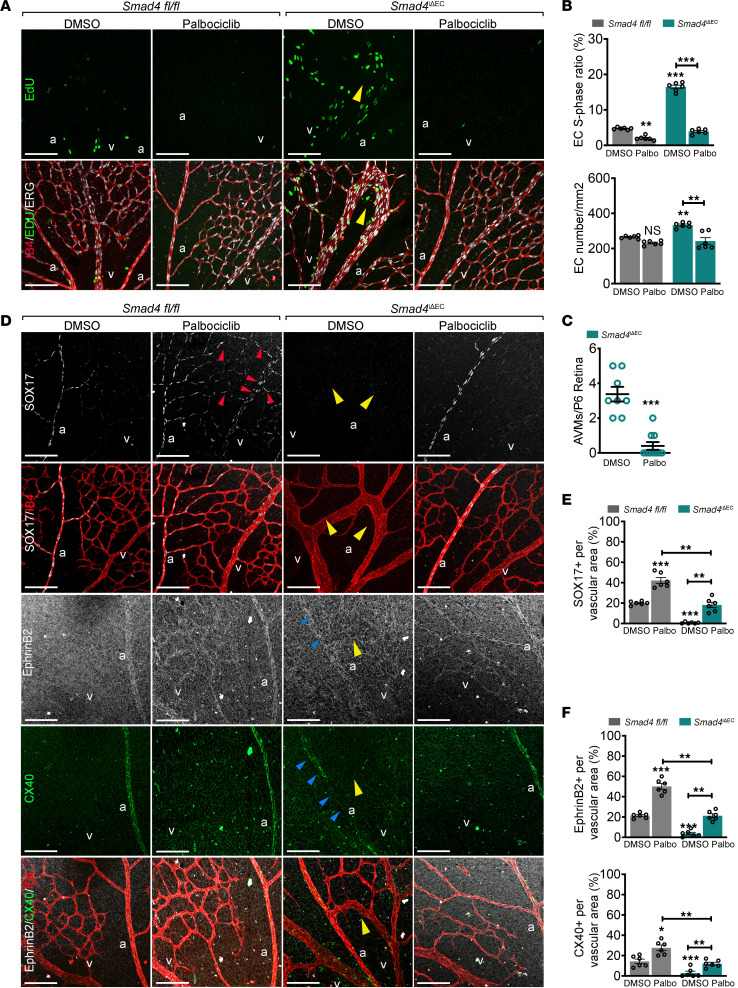
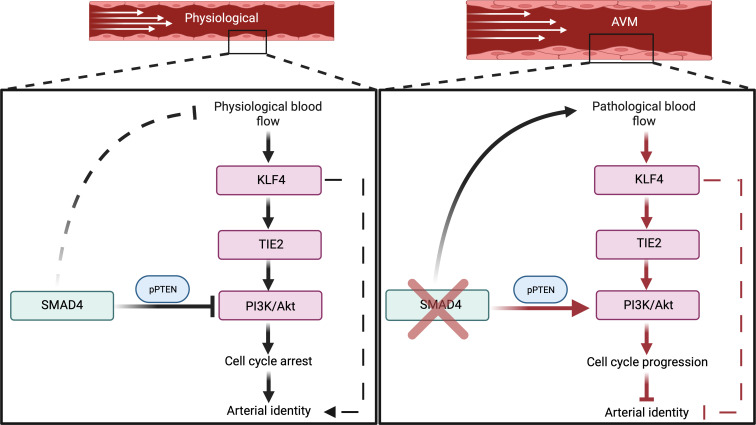
Vascular networks form, remodel, and mature under the influence of both fluid shear stress (FSS) and soluble factors. Physiological FSS promotes and maintains vascular stability via synergy with bone morphogenic proteins 9 and 10 (BMP9 and BMP10). Conversely, mutation of the BMP receptors activin-like kinase 1 (ALK1), endoglin (ENG), or the downstream effector, SMAD family member 4 (SMAD4) leads to hereditary hemorrhagic telangiectasia (HHT), characterized by fragile and leaky arterial-venous malformations (AVMs). How endothelial cells (ECs) integrate FSS and BMP signals in vascular development and homeostasis and how mutations give rise to vascular malformations is not well understood. Here, we aimed to elucidate the mechanism of synergy between FSS and SMAD signaling in vascular stability and how disruption of this synergy leads to AVMs. We found that loss of Smad4 increased the sensitivity of ECs to flow by lowering the FSS set point, with resulting AVMs exhibiting features of excessive flow-mediated morphological responses. Mechanistically, loss of SMAD4 disinhibits flow-mediated KLF4-TIE2-PI3K/Akt signaling, leading to cell cycle progression-mediated loss of arterial identity due to KLF4-mediated repression of cyclin dependent Kinase (CDK) inhibitors CDKN2A and CDKN2B. Thus, AVMs caused by Smad4 deletion are characterized by chronic high flow remodeling with excessive EC proliferation and loss of arterial identity as triggering events.

Keywords: Molecular biology; Vascular Biology.


Figures

Figure 1
Figure 1. SMAD4 maintains the FSS set point to restrict flow-mediated EC responses.
(A) Volcano plot highlighting the 10 most significantly upregulated genes upon 24 hours 12 DYNES/cm2 FSS in CTRL and SMAD4 siRNA HUVECs (n = 3/group). Color key shows log2 change after SMAD4 depletion. (B and C) qPCR for SMAD4 (B) and KLF4 (C) in CTRL and SMAD4 siRNAs HUVECs grown in static versus 1, 5, and 12 DYNES/cm2 FSS for 24 hours (n = 5/group). (DI) VE-Cadherin staining (negative images) of CTRL (DF) and SMAD4 (GI) siRNAs HUVECs grown in static (D and G), subject to 12 DYNES/cm2 (E and H) or 1 DYNE/cm2 (F and I) for 24 and 48 hours. Flow direction: right to left. (J and K) Quantification of length-to-width ratio and EC alignment parallel to flow direction (%) in CTRL and SMAD4 siRNA HUVECs in static and 12 DYNES/cm2 (J) or 1 DYNE/cm2 (K) (n = 6 average of 3 images (70–140 cells/image) per 3 independent experiments/group). (L and M) VE-Cadherin (white), GM130 (red), and DAPI (blue) staining of CTRL and SMAD4 siRNA HUVECs upon 24 hours 1 DYNE/cm2. Arrow indicates flow direction. (N) Quantification of EC polarization (%) against, with the flow’s direction, or nonoriented (neutral) in experiments from L and M (n = 12 images [50–100 cells/image] per 3 independent experiments/group). (O) S-phase ratio (EdU+) per total number of DAPI+ nuclei (%) in CTRL and SMAD4 siRNA HUVECs grown in static, 1, and 12 DYNES/cm2 for 24 hours (n = 12 images [200–250 cells/image] per 3 independent experiments/group). (P) FACS analysis in Smad4fl/fl and Smad4iΔEC P6 retinas (n = 5 retinas/group). (Q) S-phase ratio (EdU+/ERG+) per total ECs (ERG+) in capillaries, arteries, and veins of fl/fl and Smad4iΔEC retinas engaged or not in AVMs (n = 15 images from 4 retinas/group). Scale Bars: 100μm in panels DI, L, and M. Data are represented as mean ± SEM. Mann-Whitney test (B, C, N, and P) and 1-way Anova (J, K, O, and Q) were used to determine statistical significance. *P < 0.05,**P < 0.01,***P < 0.001.
Figure 2
Figure 2. KLF4 mediates the flow-induced hyperresponsiveness of SMAD4-depleted cells.
(A and B) Representative PECAM staining (negative images) of CTRL, SMAD4, and KLF4 and SMAD4;KLF4 siRNAs HUVECs subject to 12 DYNES/cm2 (A) and 1 DYNE/cm2 (B) for 24 hours. (C and D) Quantification of the length-to-width ratio and of EC alignment parallel to the flow direction (%) from experiments in A and B (average of n = 6 images (70–140 cells/image) per 3 independent experiments/group). (E) Quantification of PECAM signal intensity from experiments in A (n = 6 images per 3 independent experiments/group). (F) Colabeling for PECAM (white), GM130 (red), and DAPI (blue) of SMAD4 and KLF4 and SMAD4;KLF4 siRNAs HUVECs subject to 24 hours 1 DYNE/cm2. Black arrow indicates flow direction from right to left. (G) Quantification of cell polarization: against flow direction, with flow, or neutral (nonoriented) in pictures, as shown in F (n = 6 images (50–100 cells/image) per 3 independent experiments/group). (H and I) Representative VE-Cadherin staining (negative images) of HUVECs transfected with an empty lentiviral construct (CTRL OE) and an overexpression lentivirus for KLF4 (KLF4 OE) grown in static (H) or subject to 1 DYNE/cm2 for 48 hours (I). (J) KLF4 expression by qPCR (fold change) in CTRL-OE and KLF4-OE HUVECs (n = 4/group). (K) Quantification of the length-to-width ratio and of EC alignment parallel to the flow direction (%) in images as shown in H and I (n = 6 images (70–140 cells/image) per 3 independent experiments/group). (L) S-phase ratio ((EdU+) per total number of DAPI+ nuclei (%)) of CTRL-OE and KLF4-OE HUVECs grown in static and 12 DYNES/cm2 for 24 hours (n = 6 images (140–250 cells/image) per 3 independent experiments/group). Scale Bars: 100μm in A, B, H, and I, and 50μm in F. Data are represented as mean ± SEM. Mann-Whitney test (J and K-right), 1-way Anova (C, D, E, K-left, L), and Kruskal-Wallis tests (G) were used to determine statistical significance.*P < 0.05, **P < 0.01, ***P < 0.001.
Figure 3
Figure 3. Flow-induced KLF4 is a key determinant in AVM formation.
(A) Schematic of the experimental strategy. Arrowheads indicate intragastric injection of 100μg tamoxifen (Tx) at P0–P2 in Klf4fl/fl and Klf4iΔEC, i.p. injection of IgG and blocking antibodies for BMP9 and BMP10 (BMP9/10blAb) at P4 and P5 and analysis at P6. (BE) Representative IB4 labeling (negative images) of P6 Klf4fl/fl (B and C) and Klf4iΔEC (D and E) retinas treated with IgG (B and D) and BMP9/10blAb (C and E). Higher magnification of the small insets (red squares) from B and C labelled for KLF4 (green) and IB4 (white). Small red/blue arrowheads in B indicate the branch points in arteries and veins. Yellow/white arrowheads in C indicate increased KLF4 intensity in AVM capillary ECs and lower KLF4 in vessels outside of AVMs, respectively. (F) Quantification of KLF4 pixel intensity per EC in arteries, capillaries, and veins in Klf4fl/fl retinas treated with IgG and BMP9/10blAb (n = 8 images from 4 retinas/group). (G and H) Quantification of P6 AVM numbers (G) (n = 6 retinas/group) and of vascular density at the retinal front (%) (H) (n = 8 retinas/group) in the indicated genotypes. (I) Schematic of the experimental strategy used to delete Smad4 and Klf4 in neonates (P0–P6). (J–L) IB4 labeling (negative images) of P6 Smad4;Klf4fl/fl (J), Smad4iΔEC (K), and Smad4;Klf4iΔEC (L) retinas. (M) Smad4 and Klf4 mRNA expression in mouse lung ECs (mLECs) from P6 mice (n = 6 /group). (N and O) Quantification of AVM numbers (N) (n = 6 retinas/group) and of vascular density at the retinal front (%) (O) (n = 10 (2 images per retina)/group) of the indicated genotypes. Red arrows in C, K, and L mark AVMs. Blue squares in BE and JL indicate the vascular front. Scale Bars: 500 μm in BE and JL and 100 μm in higher magnification images from B and C. a, artery; v, vein. Data are represented as mean ± SEM. Statistical significance was determined by Mann-Whitney test (M) and 1-way Anova (F, G, H, N, and O).*P < 0.05, **P < 0.01, ***P < 0.001.
Figure 4
Figure 4. KLF4 mediates the shear stress–induced aberrant EC events within AVMs.
(AC) Representative confocal images of P6 Tx induced fl/fl, Smad4iΔEC, Klf4iΔEC, and Smad4;Klf4iΔEC retinal plexus labeled for ERG (nuclei-white), GOLPH4 (golgi-red), and IB4 (green) (A) and ERG, GOLPH4, and IB4 (green line) (B). Yellow arrowheads indicate the orientation of ECs within the AVM against the flow direction from vein toward the artery. (C) Panels illustrating EC polarization based on position of golgi in relation to the nucleus in the direction of migration (green arrows). (D) Quantification of EC polarization: against, with flow, and neutral (nonpolarized) in capillaries from P6 Tx-induced retinas from the indicated genotypes (n = 3 retinas/group). (E) Upper panel: confocal images of P6 Tx-induced fl/fl, Smad4iΔEC, Klf4iΔEC, and Smad4;Klf4iΔEC retinal plexus labeled for PECAM (white) and ERG (green). Lower panel: magnified pictures (red insets in upper panels) labeled for PECAM (white). Small red arrowheads indicate loss of PECAM at cell-cell junctions in Klf4iΔEC retinas. (F and G) Quantification of length/width ratio (F) and of cell area (G) in capillary ECs in the indicated genotypes (n = 6 [2 images (average of 50–100 cells/image) per retina]/group). (H) Representative labeling for EdU (white) and ERG (green) in vascular plexus of retinas from P6 fl/fl, Smad4iΔEC, Klf4iΔEC, and Smad4;Klf4iΔEC mice. Blue arrowheads in E and H indicate AVMs. (I) S-phase ratio (EdU+/ERG+) per total amount of ECs (ERG+) in the vascular plexus of the indicated genotypes (%) (n = 12 images from 4 retinas/group). Scale Bars: 50μm in AC, E (upper panel) and H; 20μm in magnified images (lower panel) from E. 1-way Anova (D, F, G, and I) was used to determine statistical significance. Data are represented as mean ± SEM. *P < 0.05, **P < 0.01, ***P < 0.001. a, artery; v, vein.
Figure 5
Figure 5. Flow-induced KLF4 acts upstream of mechanosensory complex PI3K/Akt.
(A) Western Blot (WB) for pAkt, Akt, and SMAD4 of HUVECs transfected with CTRL or SMAD4 siRNAs grown in static or subject to 1, 5, and 12 DYNES/cm2 for 4 hours. (B) Quantifications of pAkt levels normalized to total Akt for the indicated conditions (n = 3/group). (C) WB for pAkt, total Akt, PECAM, and GAPDH of CTRL, SMAD4, KLF4, and SMAD4;KLF4 siRNAs HUVECs subjected to 12 DYNES/cm2 for 4 hours. (D) Quantification of pAkt/Akt (n = 6/group) and PECAM/GAPDH (n = 3/group) in the indicated genotypes. (E) WB for pAkt, total Akt, PECAM, and GAPDH in CTRL-OE and KLF4-OE cells grown in static versus 12 DYNES/cm2 for 4 hours. (F) Quantification of pAkt/Akt and PECAM/GAPDH in the indicated genotypes (n = 3/group). (G) Anti-phosphoS6 (pS6) (white-upper panel) and colabeling for pS6 (white) and IB4 (red) (lower panel) of retinal flat mounts from Tx-induced P6 fl/fl, Smad4iΔEC, Klf4iΔEC, and Smad4;Klf4iΔEC. Green and yellow arrowheads indicate non-AVM regions and AVM regions, respectively. (H) Quantification of pS6 levels in the vascular plexus of fl/fl, Smad4iΔEC (in regions free of AVMs and within the AVMs), Klf4iΔEC, and Smad4;Klf4iΔEC (n = 6 [2 images/retina]/group). a, artery; v, vein. Scale bars: 50μm in G. Mann-Whitney test (B), 1-way Anova (D, F, and H) were used to determine statistical significance. Data are represented as mean ± SEM. *P < 0.05, **P < 0.01, ***P < 0.001.
Figure 6
Figure 6. KLF4-mediated TEK expression is required for flow-induced PI3K/Akt activation.
(A) Heatmap of potential mediators of PI3K signaling in CTRL siRNA HUVECs grown in static versus subject to 12 DYNES/cm2; n = 3/group. Color key shows log2 change upon FSS stimulation. (B) qPCR for TEK and PTEN (left panel) and FLT4 and CD31 (right panel) in CTRL versus KLF4 siRNAs HUVECs grown in static or subject to 12 DYNES/cm2 (n = 5/group). (C) TEK mRNA expression in CTRL-OE versus KLF4-OE HUVECs (n = 4/group). (D) Reanalysis of previous published CHIP-Seq data of KLF4 overexpression (caMEK5) in primary human pulmonary artery endothelial cells (PAEC) with the Integrative Genomics Viewer (IGV). Two distinct peaks within enhancer regions of the TEK gene were identified. (E) WB for indicated proteins of HUVECs transfected with CTRL and TEK siRNAs and CTRL-OE and KLF4-OE constructs grown in static or subject to 12 DYNES/cm2 for 4 hours. (F) Quantification of pAkt/Akt and TEK/GAPDH in indicated genotypes (n = 4/group). (G) Labeling of Tx-induced P6 fl/fl, Smad4iΔEC and Klf4iΔEC retinas with anti-TIE2 antibody (red) and IB4 (white). Green and yellow arrowheads indicate non-AVM versus AVM region, respectively. (H) Quantification of TIE2 expression per vascular area in the indicated genotypes (n = 6 [2 images/retina]/group). a, artery; v, vein. Scale Bars: 100μm in G. Mann-Whitney test (C) and 1-way Anova (B, F, and H) were used to determine statistical significance.Data are represented as mean ± SEM. *P < 0.05, **P < 0.01, ***P < 0.001.
Figure 7
Figure 7. Smad4 LOF blocks flow-mediated cell cycle arrest resulting in loss of arterial identity.
(A) Significantly changed GO terms in CTRL versus SMAD4 siRNAs HUVECs subject to 12 DYNES/cm2. n = 3/group. (B) Heatmap for the expression of cell cycle regulators in CTRL versus SMAD4 siRNAs HUVECs grown in static and subject to 12DYNES/cm2 (n = 3/group). Color key shows log2 changes. (C) qPCR for CCNB1, CCNB2, CDK1, CDKN2A, and CDKN2B in CTRL versus SMAD4 siRNAs HUVECs grown in static versus subject to 12DYNES/cm2 (n = 3/group). (D and E) qPCR for CCNB1, CCNB2, CDK1, CDKN2A, and CDKN2B (D) and for EFNB2, SOX17, CX37, CX40, and CX43 (E) in KLF4 siRNAs and KLF4 OE as fold change in relation to CTRL siRNA and CTRL-OE HUVECs (n = 5–10/group). (F and H) Representative confocal images of labeled retinas for EphrinB2 (white) (F), SOX17 (white) (H) and IB4 (red) from Tx induced P6 fl/fl, Smad4iΔEC, Klf4iΔEC, and Smad4;Klf4iΔEC mice. (G and I) Quantification of EphrinB2 (G) and SOX17 (I) signals in the vascular plexus from the indicated genotypes (n = 4 retinas/group). (J) qPCR for EFNB2, SOX17, CX37, CX40, and CX43 in KLF4 OE and Palbociclib treated HUVECs (n = 5–6/group). Scale Bars: 100μm in F and H. a, artery; v, vein. Mann Whitney test (D and E) and 1-way Anova (C,G,I,J) were used to determine statistical significance.Data are represented as mean ± SEM. *P < 0.05, **P < 0.01, ***P < 0.001.
Figure 8
Figure 8. G1 arrest restores arterial identity and rescues AVM formation.
(A) Confocal images of P6 Smad4fl/fl and Smad4iΔEC retinas treated with DMSO or Palbociclib labeled for EdU (green; upper panel) and EdU (green), ERG (white) and IB4 (red) (lower panel). (B) Quantification of the number of EdU+/ERG+ ECs per total number of ERG+ ECs (%) and the total number of ECs. (C) Quantification of the number of AVMs in the vascular plexus from indicated genotypes. (D) Representative confocal images of retinas stained for SOX17 (white) and IB4 (red), and EphrinB2 (white), CX40 (green), and IB4 (red) from the indicated genotypes, DMSO versus Palbociclib treated. (E and F) Quantification of SOX17 (E), EphrinB2, and CX40 signals (F) per vascular area in the plexus of Smad4iΔEC retinas DMSO versus Palbociclib treated (n =6 images/3 retina/group). Yellow arrows in A and D mark AVMs. Red and blue arrows in D point to gain (red) and loss (blue) of SOX17, Ephrinb2, and CX40 expression in vascular plexus. Scale Bars: 100μm in A and D. a, artery; v, vein. Mann-Whitney test (C). 1-way Anova (B, E, and F) were used to determine statistical significance. Data are represented as mean ± SEM. *P < 0.05, **P < 0.01, ***P < 0.001.
Figure 9
Figure 9. Working model for SMAD4-FSS crosstalk in maintaining EC quiescence:
SMAD4 restricts flow-induced KLF4-TIE2-Akt activation to promote EC cycle arrest in G1 and maintenance of arterial identity under P-FSS. Loss of Smad4 results in overactivation of KLF4-TIE2-Akt signaling in response to pathological shear stress leading to cell cycle progression–mediated loss of arterial identity and AVM formation.

References

    1. Baeyens N, et al. Endothelial fluid shear stress sensing in vascular health and disease. J Clin Invest. 2016;126(3):821–828. doi: 10.1172/JCI83083. - DOI - PMC - PubMed
    1. Fang JS, et al. Shear-induced Notch-Cx37-p27 axis arrests endothelial cell cycle to enable arterial specification. Nat Commun. 2017;(8):2149. doi: 10.1038/s41467-017-01742-7. - DOI - PMC - PubMed
    1. McCue S, et al. Shear stress regulates forward and reverse planar cell polarity of vascular endothelium in vivo and in vitro. Circ Res. 2006;98(7):939–946. doi: 10.1161/01.RES.0000216595.15868.55. - DOI - PubMed
    1. Franco CA, et al. Correction: dynamic endothelial cell rearrangements drive developmental vessel regression. PLoS Biol. 2015;13(5):e1002163. doi: 10.1371/journal.pbio.1002163. - DOI - PMC - PubMed
    1. Lee HW, et al. role of venous endothelial cells in developmental and pathologic angiogenesis. Circulation. 2021;144(16):1308–1322. doi: 10.1161/CIRCULATIONAHA.121.054071. - DOI - PMC - PubMed

Publication types

MeSH terms

Substances