. 2023 Oct 13;29(20):4166-4177.
doi: 10.1158/1078-0432.CCR-23-0956.

Baseline Mutations and ctDNA Dynamics as Prognostic and Predictive Factors in ER-Positive/HER2-Negative Metastatic Breast Cancer Patients

Affiliations

Baseline Mutations and ctDNA Dynamics as Prognostic and Predictive Factors in ER-Positive/HER2-Negative Metastatic Breast Cancer Patients

Javier Pascual et al. Clin Cancer Res. .

Abstract

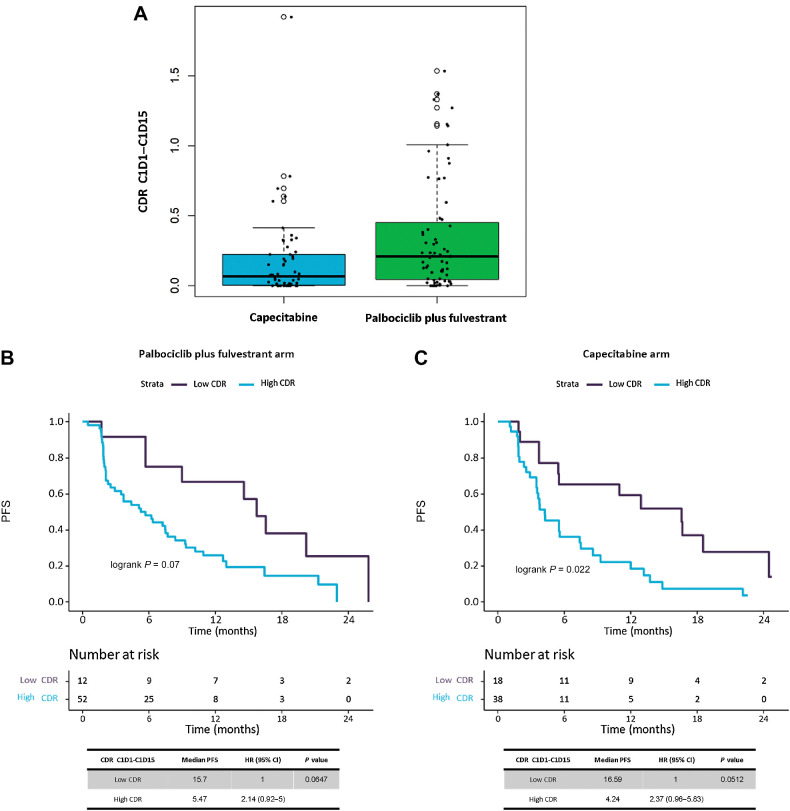
Purpose: Prognostic and predictive biomarkers to cyclin-dependent kinases 4 and 6 inhibitors are lacking. Circulating tumor DNA (ctDNA) can be used to profile these patients and dynamic changes in ctDNA could be an early predictor of treatment efficacy. Here, we conducted plasma ctDNA profiling in patients from the PEARL trial comparing palbociclib+fulvestrant versus capecitabine to investigate associations between baseline genomic landscape and on-treatment ctDNA dynamics with treatment efficacy.

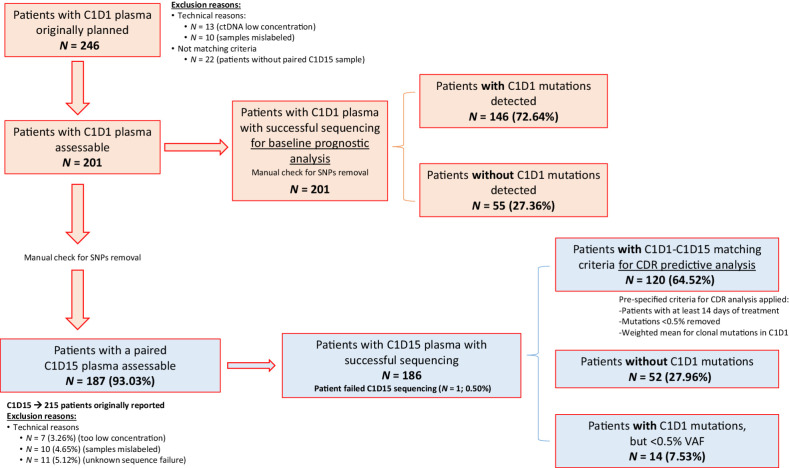
Experimental design: Correlative blood samples were collected at baseline [cycle 1-day 1 (C1D1)] and prior to treatment [cycle 1-day 15 (C1D15)]. Plasma ctDNA was sequenced with a custom error-corrected capture panel, with both univariate and multivariate Cox models used for treatment efficacy associations. A prespecified methodology measuring ctDNA changes in clonal mutations between C1D1 and C1D15 was used for the on-treatment ctDNA dynamic model.

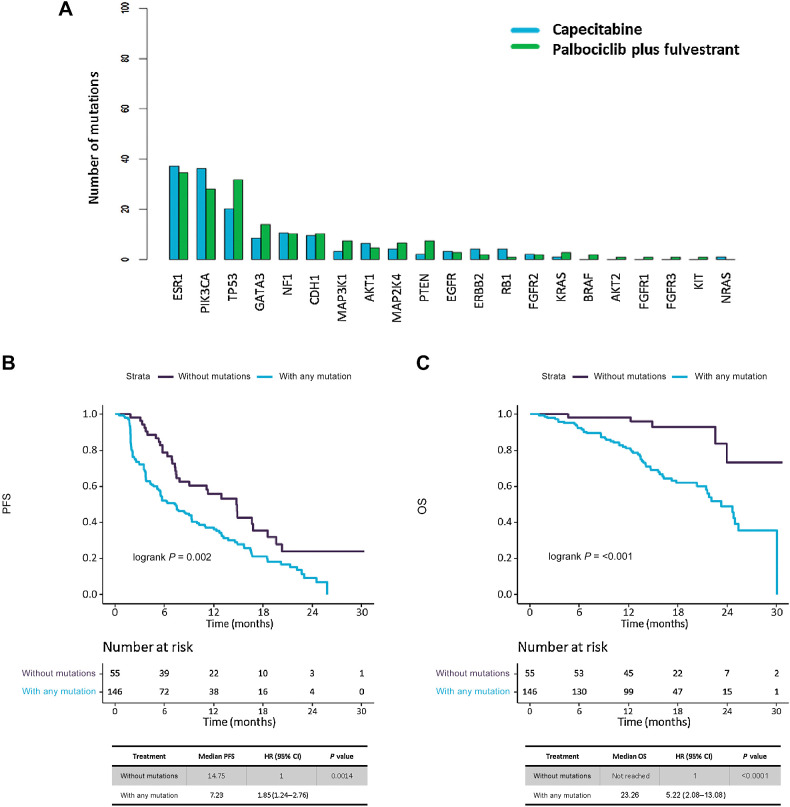
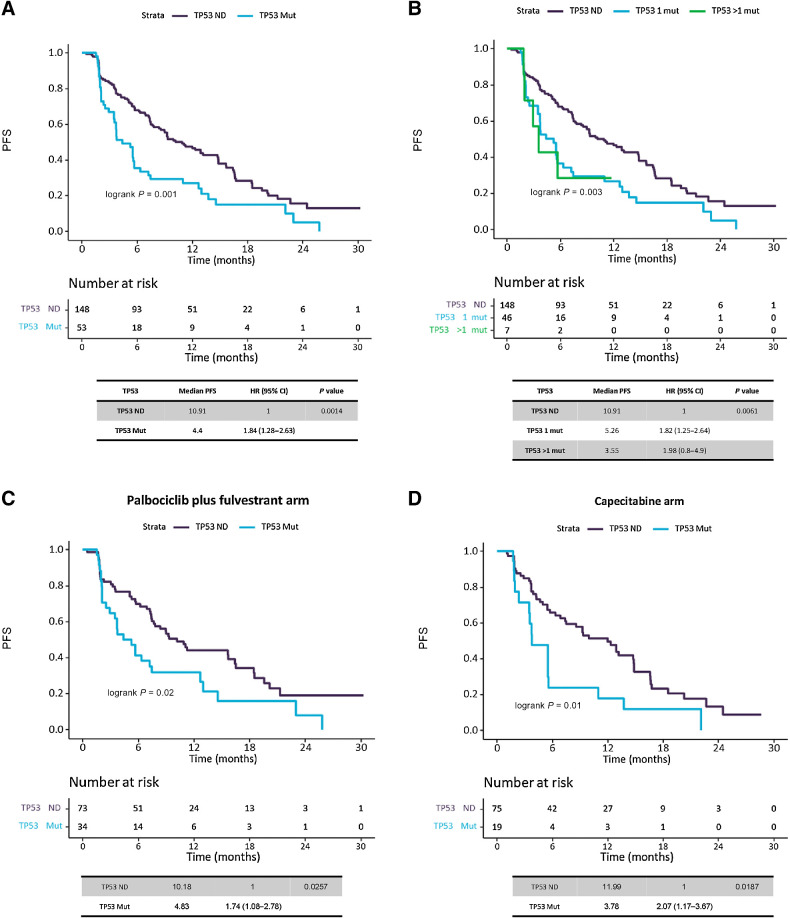
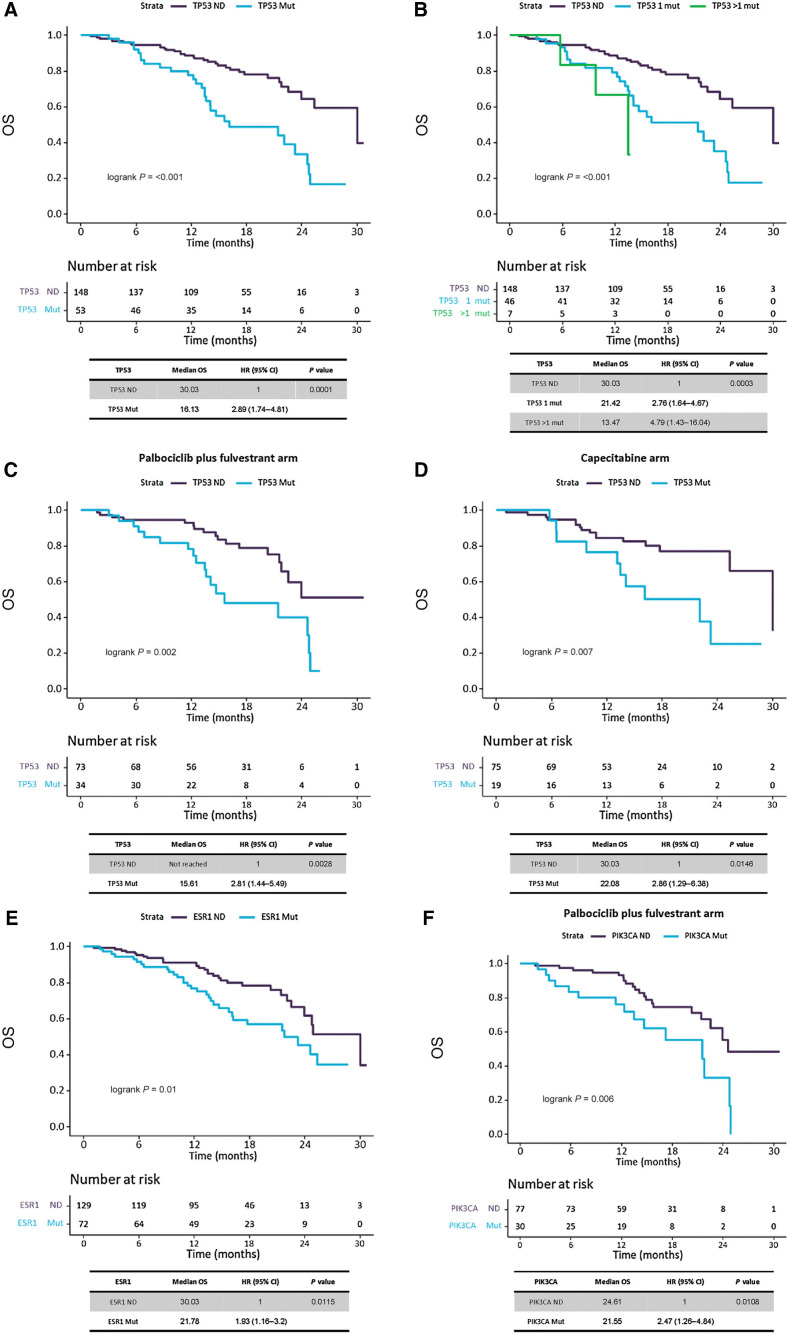
Results: 201 patients were profiled at baseline, with ctDNA detection associated with worse progression-free survival (PFS)/overall survival (OS). Detectable TP53 mutation showed worse PFS and OS in both treatment arms, even after restricting population to baseline ctDNA detection. ESR1 mutations were associated with worse OS overall, which was lost when restricting population to baseline ctDNA detection. PIK3CA mutations confer worse OS only to patients on the palbociclib+fulvestrant treatment arm. ctDNA dynamics analysis (n = 120) showed higher ctDNA suppression in the capecitabine arm. Patients without ctDNA suppression showed worse PFS in both treatment arms.

Conclusions: We show impaired survival irrespective of endocrine or chemotherapy-based treatments for patients with hormone receptor-positive/HER2-negative metastatic breast cancer harboring plasma TP53 mutations. Early ctDNA suppression may provide treatment efficacy predictions. Further validation to fully demonstrate clinical utility of ctDNA dynamics is warranted.


Figures

Figure 1. CONSORT diagram of the study population and samples. Blood samples were collected for ctDNA analysis from -7 days to C1D1 for baseline prognostic analysis and C1D15 when available. A total of 246 different patients with C1D1 were considered. 13 patients had DNA concentrations too low (under 0.10 ng/μL) so were excluded. From remaining 233, 22 did not have an additional follow-up sample at C1D15 to have a paired analysis, so were also excluded. From remaining 211, 10 samples were excluded as result of mislabeling during aliquoting, resulting in a total of 201 final different patients included in the analysis, all with a baseline and at least 1 follow-up sample.
Figure 1.
CONSORT diagram of the study population and samples. Blood samples were collected for ctDNA analysis from -7 days to C1D1 for baseline prognostic analysis and C1D15 when available. A total of 246 different patients with C1D1 were considered. 13 patients had DNA concentrations too low (under 0.10 ng/μL) so were excluded. From remaining 233, 22 did not have an additional follow-up sample at C1D15 to have a paired analysis, so were also excluded. From remaining 211, 10 samples were excluded as result of mislabeling during aliquoting, resulting in a total of 201 final different patients included in the analysis, all with a baseline and at least 1 follow-up sample.
Figure 2. Mutation distribution across study population, and analysis of ctDNA detection effect in survival. A, Bar plot showing distribution of mutations in study population, by mutated genes and treatment arms. B and C, Kaplan–Meier survival curves, including risk table (time in months, m), to measure presence of any mutation (ctDNA detection) effect in survival, among patients with and without any mutation detected. B, PFS, and (C) OS.
Figure 2.
Mutation distribution across study population, and analysis of ctDNA detection effect in survival. A, Bar plot showing distribution of mutations in study population, by mutated genes and treatment arms. B and C, Kaplan–Meier survival curves, including risk table (time in months, m), to measure presence of any mutation (ctDNA detection) effect in survival, among patients with and without any mutation detected. B, PFS, and (C) OS.
Figure 3. Analysis of TP53 mutation effect in PFS. Kaplan–Meier survival curves, including risk table (time in months, m), to measure the effect of TP53 mutations in PFS. A, Survival analysis on TP53 gene mutations, regardless treatment, by presence/absence of mutations. B, Survival analysis on TP53 gene mutations, regardless treatment, by number of mutations (0 mutations, 1 mutation or more than 1 mutations). C, Survival analysis on TP53 gene mutations, in palbociclib plus fulvestrant treated patients, by presence/absence of mutations. D, Survival analysis on TP53 gene mutations, in capecitabine treated patients, by presence/absence of mutations.
Figure 3.
Analysis of TP53 mutation effect in PFS. Kaplan–Meier survival curves, including risk table (time in months, m), to measure the effect of TP53 mutations in PFS. A, Survival analysis on TP53 gene mutations, regardless treatment, by presence/absence of mutations. B, Survival analysis on TP53 gene mutations, regardless treatment, by number of mutations (0 mutations, 1 mutation or more than 1 mutations). C, Survival analysis on TP53 gene mutations, in palbociclib plus fulvestrant treated patients, by presence/absence of mutations. D, Survival analysis on TP53 gene mutations, in capecitabine treated patients, by presence/absence of mutations.
Figure 4. Analysis of TP53, ESR1 and PIK3CA mutation effect in OS. Kaplan–Meier survival curves, including risk table (time in months, m), to measure the effect of TP53 mutations in OS. A, Survival analysis on TP53 gene mutations, regardless treatment, by presence/absence of mutations. B, Survival analysis on TP53 gene mutations, regardless treatment, by number of mutations (0 mutations, 1 mutation or more than 1 mutations). C, Survival analysis on TP53 gene mutations, in palbociclib plus fulvestrant treated patients, by presence/absence of mutations. D, Survival analysis on TP53 gene mutations, in capecitabine treated patients, by presence/absence of mutations. E, Survival analysis on ESR1 gene mutations, regardless treatment, by presence/absence of mutations. F, Survival analysis on PIK3CA gene mutations, in palbociclib plus fulvestrant treated patients, by presence/absence of mutations.
Figure 4.
Analysis of TP53, ESR1 and PIK3CA mutation effect in OS. Kaplan–Meier survival curves, including risk table (time in months, m), to measure the effect of TP53 mutations in OS. A, Survival analysis on TP53 gene mutations, regardless treatment, by presence/absence of mutations. B, Survival analysis on TP53 gene mutations, regardless treatment, by number of mutations (0 mutations, 1 mutation or more than 1 mutations). C, Survival analysis on TP53 gene mutations, in palbociclib plus fulvestrant treated patients, by presence/absence of mutations. D, Survival analysis on TP53 gene mutations, in capecitabine treated patients, by presence/absence of mutations. E, Survival analysis on ESR1 gene mutations, regardless treatment, by presence/absence of mutations. F, Survival analysis on PIK3CA gene mutations, in palbociclib plus fulvestrant treated patients, by presence/absence of mutations.
Figure 5. Longitudinal predictive ctDNA analysis by use of median CDR methodology, calculated at C1D15 timepoint. A, Boxplot graph showing distribution of CDR C1D15 values in patients by treatment arms, palbociclib plus fulvestrant vs. capecitabine. B and C, Kaplan–Meier survival curves, including risk table (time in months, m), to measure the effect of CDR (Low vs. High) in PFS by treatment arm, (B) in palbociclib plus fulvestrant treated patients and (C) in capecitabine treated patients. Median CDR between C1D15–C1D1, calculated with prespecified methodology, offered a CDR value optimal cutoff of 0.0247 for palbociclib plus fulvestrant arm, while it was of 0.0127 for the capecitabine treatment arm. Those optimal cut-off values were used to create Low versus High CDR groups, in both treatment arms.
Figure 5.
Longitudinal predictive ctDNA analysis by use of median CDR methodology, calculated at C1D15 timepoint. A, Boxplot graph showing distribution of CDR C1D15 values in patients by treatment arms, palbociclib plus fulvestrant vs. capecitabine. B and C, Kaplan–Meier survival curves, including risk table (time in months, m), to measure the effect of CDR (Low vs. High) in PFS by treatment arm, (B) in palbociclib plus fulvestrant treated patients and (C) in capecitabine treated patients. Median CDR between C1D15–C1D1, calculated with prespecified methodology, offered a CDR value optimal cutoff of 0.0247 for palbociclib plus fulvestrant arm, while it was of 0.0127 for the capecitabine treatment arm. Those optimal cut-off values were used to create Low versus High CDR groups, in both treatment arms.

References

    1. Finn RS, Martin M, Rugo HS, Jones S, Im S-A, Gelmon K, et al. . Palbociclib and letrozole in advanced breast cancer. N Engl J Med 2016;375:1925–36. - PubMed
    1. Hortobagyi GN, Stemmer SM, Burris HA, Yap Y-S, Sonke GS, Paluch-Shimon S, et al. . Ribociclib as first-line therapy for HR-positive, advanced breast cancer. N Engl J Med 2016;375:1738–48. - PubMed
    1. Goetz MP, Toi M, Campone M, Sohn J, Paluch-Shimon S, Huober J, et al. . MONARCH 3: abemaciclib as initial therapy for advanced breast cancer. J Clin Oncol 2017;35:3638–46. - PubMed
    1. Turner NC, Ro J, André F, Loi S, Verma S, Iwata H, et al. . Palbociclib in hormone receptor–positive advanced breast cancer. N Engl J Med 2015;373:209–19. - PubMed
    1. Slamon DJ, Neven P, Chia S, Fasching PA, De Laurentiis M, Im S-A, et al. . Phase III randomized study of ribociclib and fulvestrant in hormone receptor–positive, human epidermal growth factor receptor 2–negative advanced breast cancer: MONALEESA-3. J Clin Oncol 2018;36:2465–72. - PubMed