. 2023 Aug;120(31):e2220068120.
doi: 10.1073/pnas.2220068120. Epub 2023 Jul 25.

Fast protein folding is governed by memory-dependent friction

Affiliations

Fast protein folding is governed by memory-dependent friction

Benjamin A Dalton et al. Proc Natl Acad Sci U S A. 2023 Aug.

Abstract

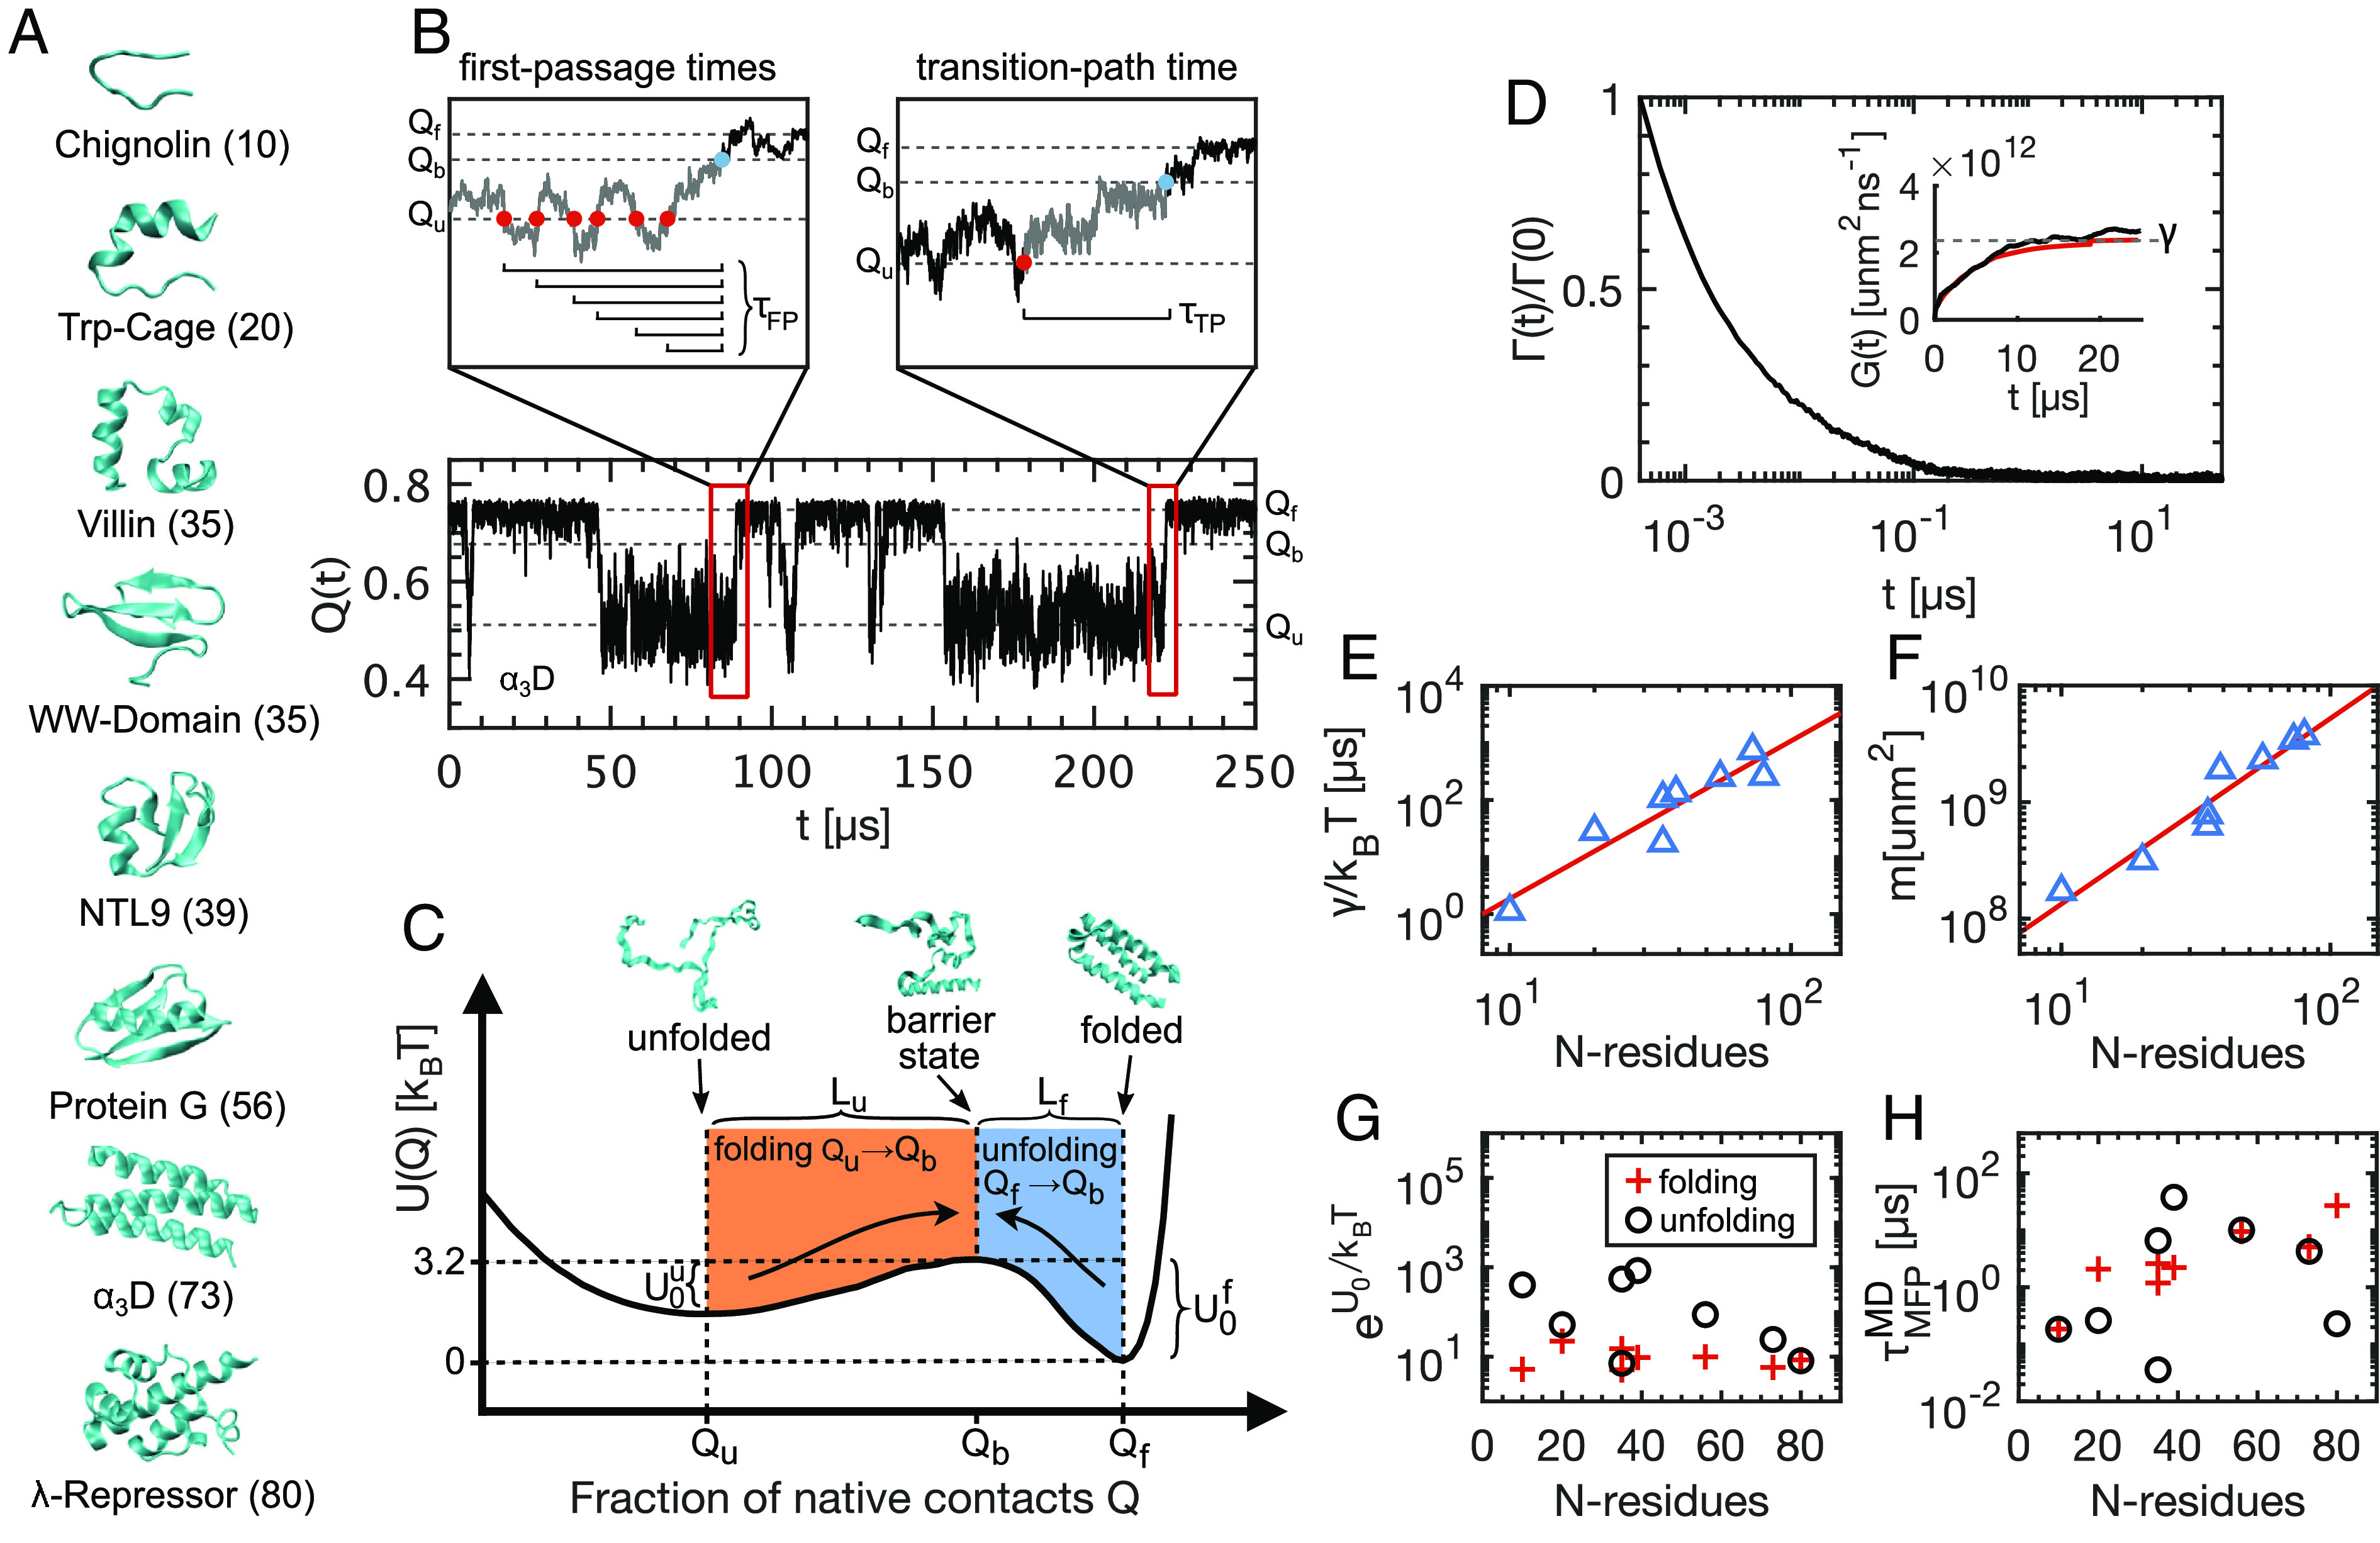
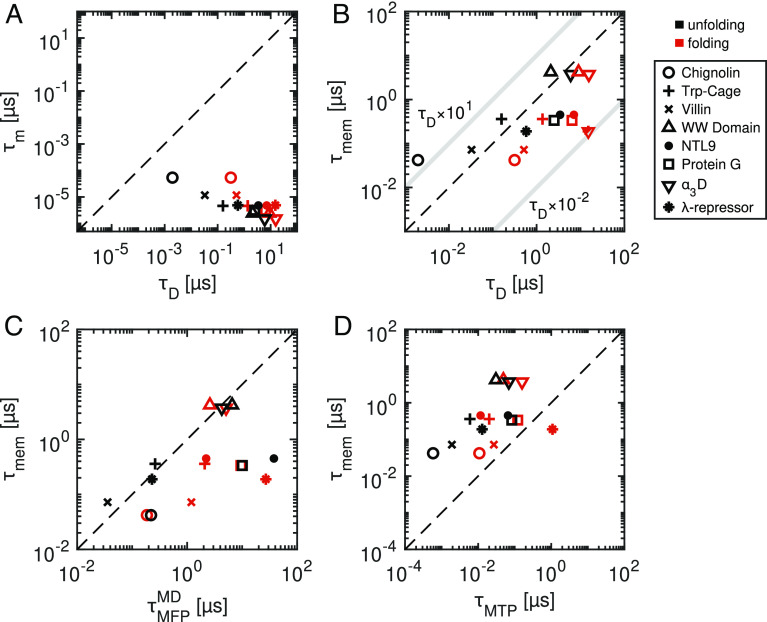
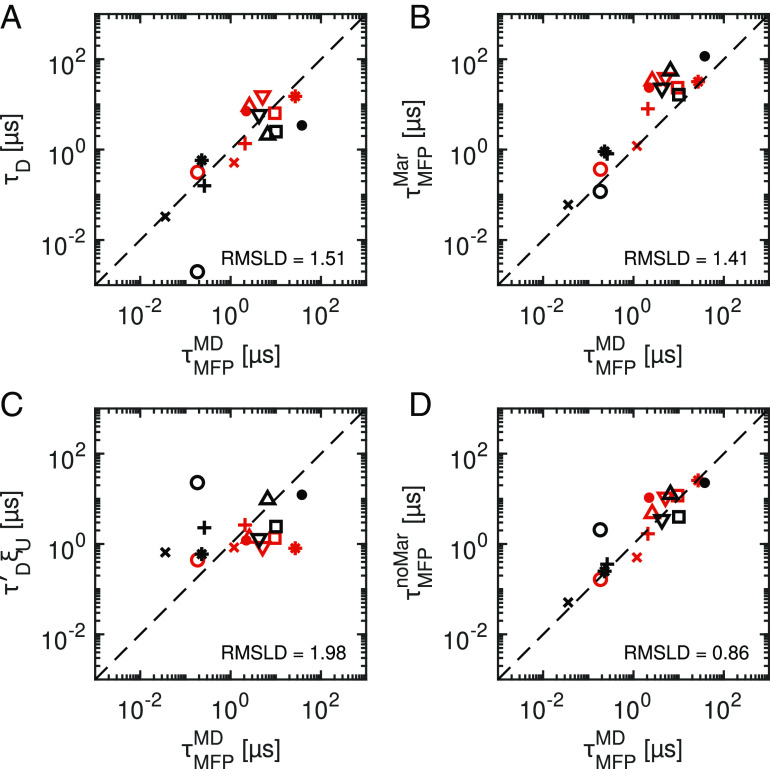
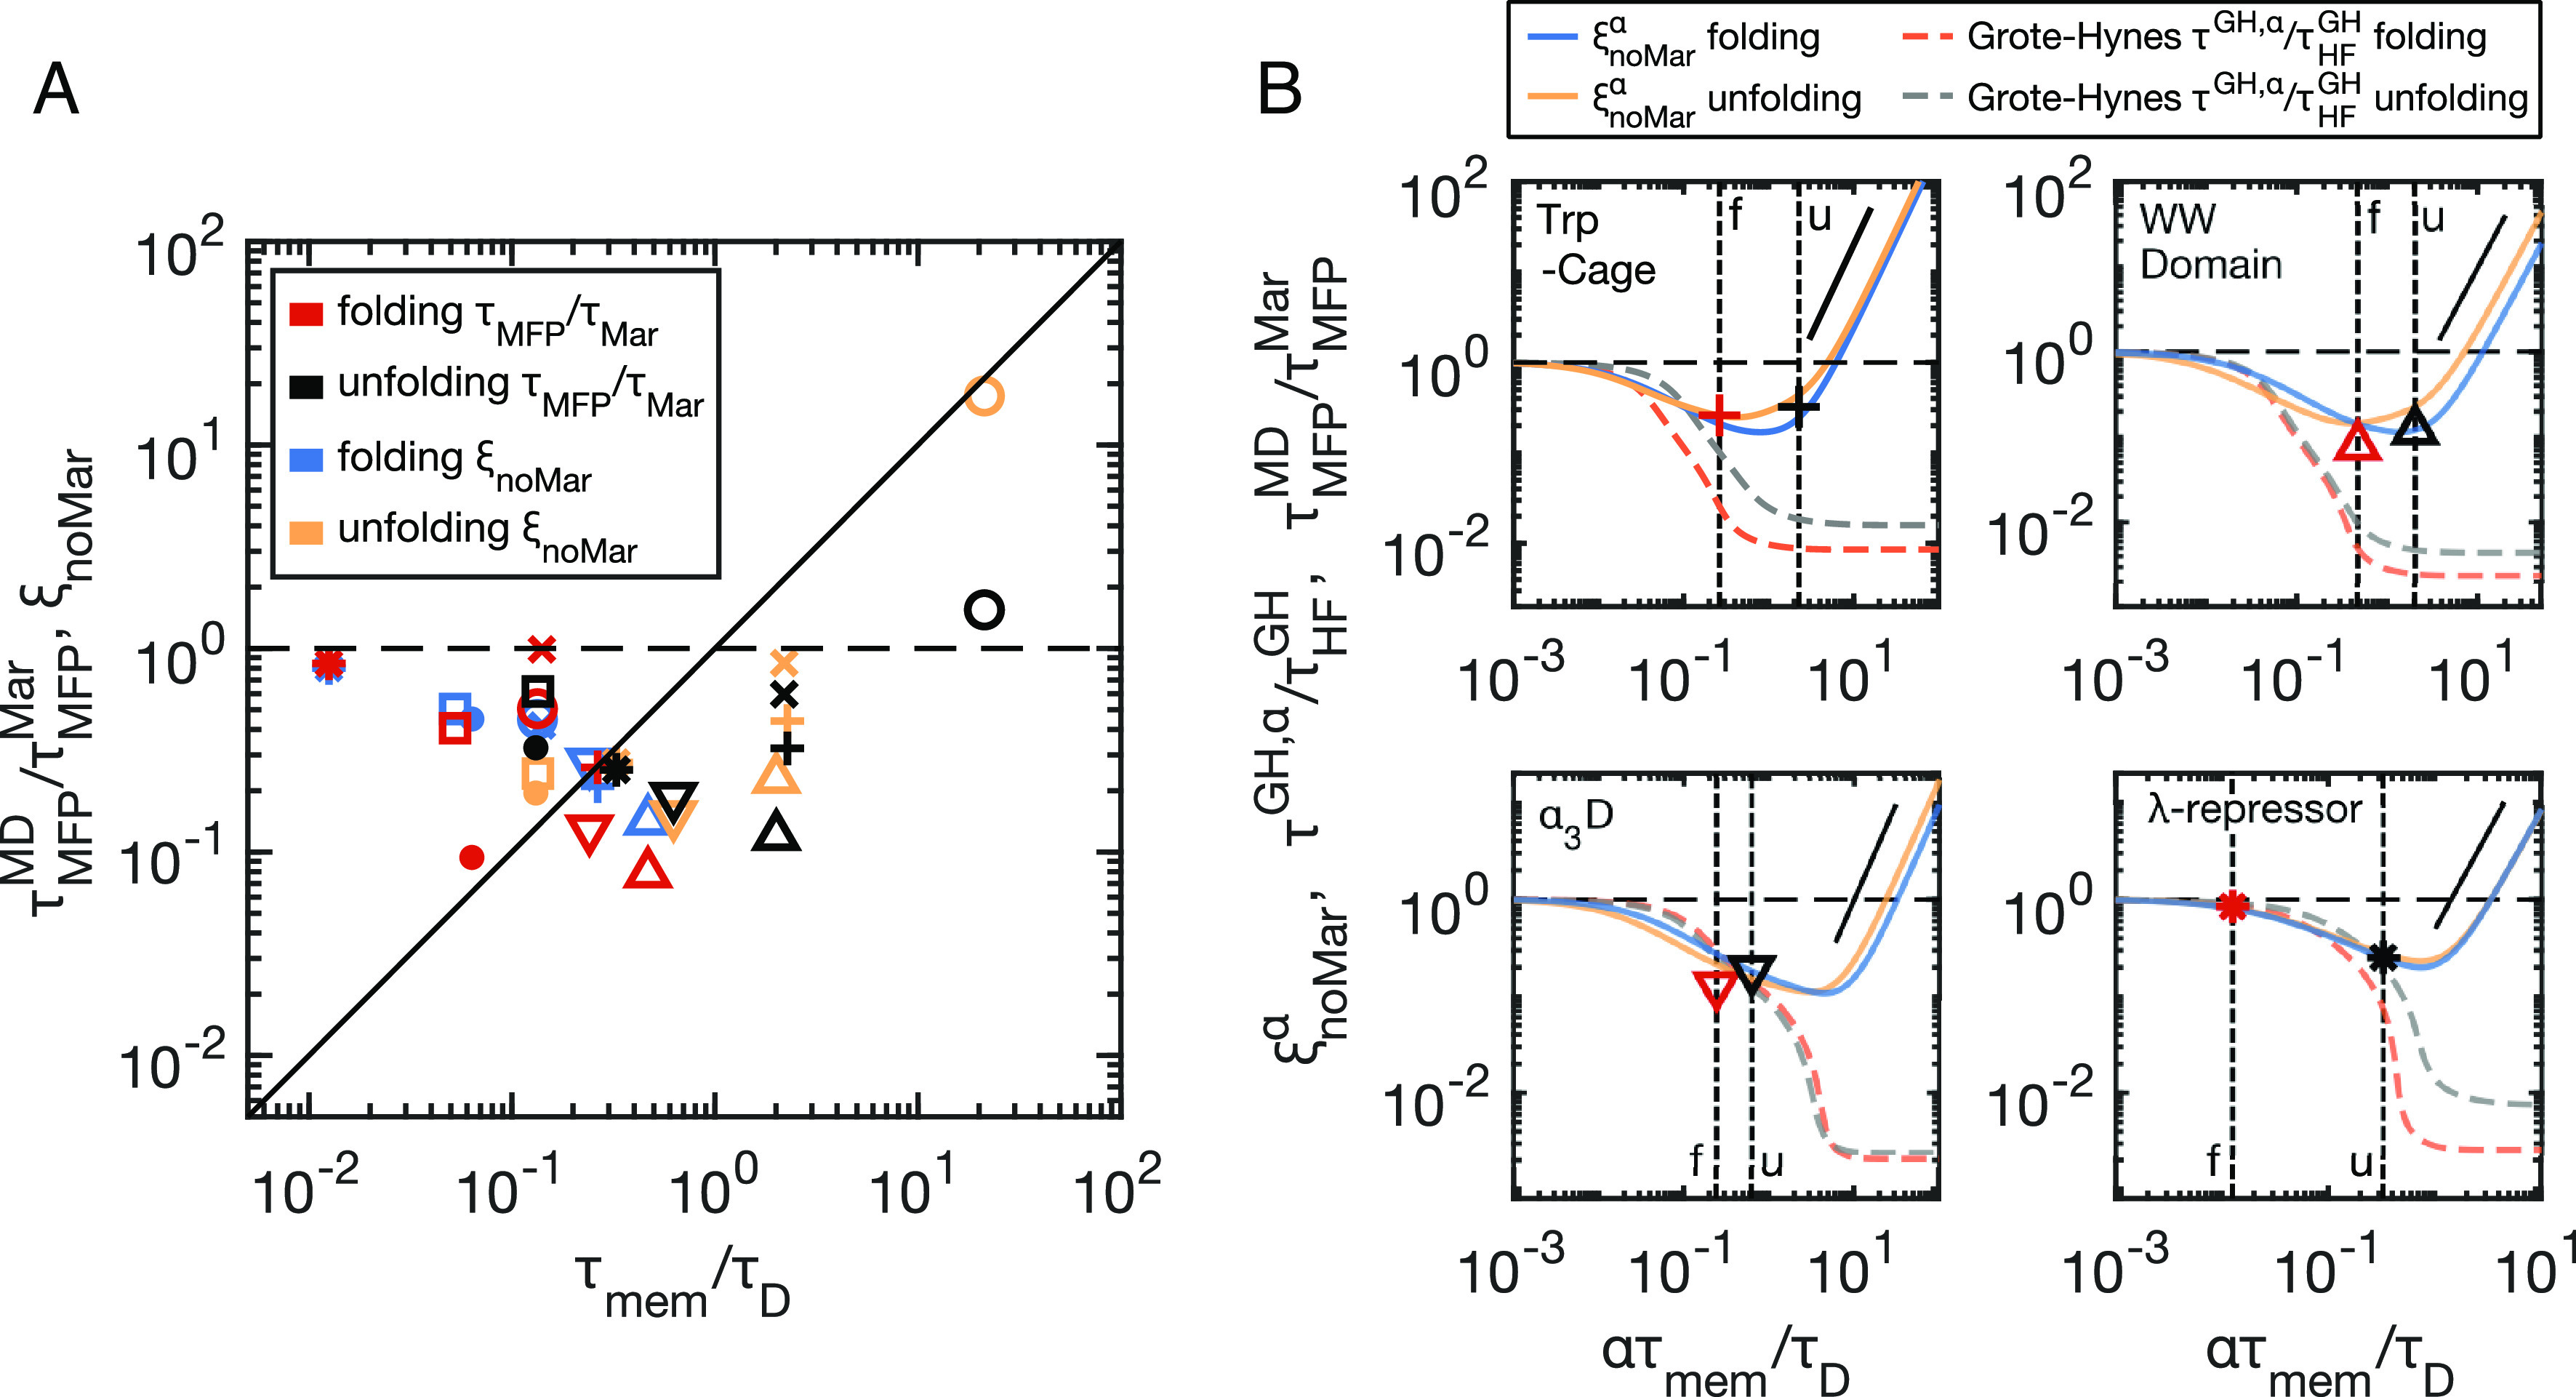
When described by a low-dimensional reaction coordinate, the folding rates of most proteins are determined by a subtle interplay between free-energy barriers, which separate folded and unfolded states, and friction. While it is commonplace to extract free-energy profiles from molecular trajectories, a direct evaluation of friction is far more elusive and typically relies on fits of measured reaction rates to memoryless reaction-rate theories. Here, using memory-kernel extraction methods founded on a generalized Langevin equation (GLE) formalism, we directly calculate the time-dependent friction acting on the fraction of native contacts reaction coordinate Q, evaluated for eight fast-folding proteins, taken from a published set of large-scale molecular dynamics protein simulations. Our results reveal that, across the diverse range of proteins represented in this dataset, friction is more influential than free-energy barriers in determining protein folding rates. We also show that proteins fold in a regime where the finite decay time of friction significantly reduces the folding times, in some instances by as much as a factor of 10, compared to predictions based on memoryless friction.

Keywords: generalized Langevin equation; molecular friction; non-Markovian dynamics; protein folding; reaction rate theory.


Conflict of interest statement

The authors declare no competing interest.

Figures

Fig. 1.
Fig. 1.
The folding and unfolding of eight fast-folding proteins. (A) Native states for all proteins with the number of amino acids indicated. All protein trajectories are taken from ref. . (B) 250 μs trajectory segment for the Q(t) reaction coordinate (α3D protein). Left magnification: a sequence of folding first-passage events, from the unfolded state Qu to the barrier topQb. Right magnification: an example folding transition path and corresponding transition path time τTP. (C) Free-energy profile for the α3D protein. Configuration snapshots show example unfolded, barrier-top, and folded states. Qu, Qb, and Qf are the reaction coordinate values in the unfolded, barrier-top, and folded states, respectively. For α3D, the barrier faced by the unfolded protein, U0u=U(Qb)U(Qu)=1.8kBT, is less than the barrier faced by the folded protein U0f=U(Qb)U(Qf)=3.2kBT. The distance from the unfolded state to the barrier top Lu = Qb − Qu is greater than the distance from the folded state to the barrier top Lf = Qf − Qb. (D) Normalized GLE memory kernel Γ(t), extracted from Q(t) for the α3D protein. Inset: Running integral G(t) (black line), the limiting total friction γ (dashed line), and an exponential fit (red curve). (E) Total friction γ for each protein, divided by kBT, plotted as a function of the number of residues N, (power law with exponent ∼2.8 (red line)). (F) Effective mass m, plotted as a function of N (power law with exponent ∼1.5 (red line)). (G) and (H) show the Arrhenius factor eU0/kBT and barrier crossing times τMFPMD for folding and unfolding transitions individually.
Fig. 2.
Fig. 2.
Comparison of relevant time scales for protein folding and unfolding kinetics. (A) The inertia time scales τm compared to the diffusion times τD, showing that all systems are in the over-damped regime. (B) Memory decay time scales τmem, calculated from the first moment of the memory kernel Γ(t), compared to the diffusion times τD . The light gray lines indicate the bounding regime for τmem between τD × 10−2 and τD × 101, which is the domain in which memory-induced kinetic acceleration is expected. (C) Memory times τmem compared to the folding and unfolding times, expressed as the mean first-passage times τMFPMD. (D) Memory times compared to the transition path times τMTP leading from the folded and unfolded state minima to the barrier tops. The broken lines in each plot indicate exact equivalence between the respective times.
Fig. 3.
Fig. 3.
Comparison of simulated protein folding and unfolding times τMFPMD with predictions on different levels of theory. (A) Diffusion times τD, according to Eq. 2, which do not depend on free-energy barriers. (B) Markovian predictions τMFPMar, according to Eq. 3, which use the extracted free-energy profile for each protein. (C) Free-energy-dependent factor ξU that accounts for the effect of the free energy profile but not for the friction, according to Eq. 3. (D) Non-Markovian predictions τMFPnoMar, according to Eq. 5. Multiexponential memory kernels are explicitly accounted for. The root-mean-squared deviations of the logarithmically transformed data (RMSLD) provides a measure of relative deviations for each model prediction from the observed data τMFPMD over the combined set of folding and unfolding times. A lower RMSLD indicates that a given model prediction is more accurate, where the dashed lines indicate an exact prediction. In (C), τD is calculated using γ = 1.1 × 109unm2μs−1 for all proteins, chosen to minimize the RMSLD. See Fig. 2 for symbol legend.
Fig. 4.
Fig. 4.
Barrier crossing times indicate memory-induced speed up. (A) Deviations from Markovian barrier crossing kinetics, plotted as a function of rescaled memory times τmem/τD, for the folding and unfolding of all eight proteins. Rescaled MD simulation values for each protein (τMFPMD/τMFPMar, red and black symbols) are compared to multimodal, non-Markovian prediction (ξnoMar, Eq. 4, blue and yellow symbols). See Fig. 2 for symbol legend. (B) Reaction-time curves generated by scaling all memory times by a common factor α. Vertical dashed lines indicate α = 1, which are different for folding (f) and unfolding (u) due to unique τD values. The multimodal non-Markovian prediction (ξnoMarα from Eq. 4—folding (blue) and unfolding (yellow)) is compared to the Grote–Hynes prediction (τGH, α from Eq. M6), rescaled by the memoryless, high-friction limit (τHFGH - Eq. M10) for folding (orange) and unfolding (grey). The blue and yellow symbols shown in (A) for the four example proteins coincide with the curve intercepts of the α = 1 lines in (B) for ξnoMarα. The red and black symbols are the same as those shown in (A), corresponding to the MD results for each protein, located at α = 1. The solid black lines show quadratic scaling, predicted for ξnoMar in the long memory-time limit. Dashed horizontal black lines show unity for all plots.

References

    1. Bryngelson J. D., Wolynes P. G., Intermediates and barrier crossing in a random energy model (with applications to protein folding). J. Phys. Chem. 93, 6902–6915 (1989).
    1. Bryngelson J. D., Onuchic J. N., Socci N. D., Wolynes P. G., Funnels, pathways, and the energy landscape of protein folding: A synthesis. Proteins: Struct. 21 (1995). - PubMed
    1. Dill K. A., Chan H. S., From Levinthal to pathways to funnels. Nat. Struct. Biol. 4, 10–19 (1997). - PubMed
    1. Schuler B., Eaton W. A., Protein folding studied by single-molecule FRET. Curr. Opin. Struct. Biol. 18, 16–26 (2008). - PMC - PubMed
    1. Hinczewski M., Gebhardt J. C. M., Rief M., Thirumalai D., From mechanical folding trajectories to intrinsic energy landscapes of biopolymers. Proc. Natl. Acad. Sci. 110, 4500–4505 (2013). - PMC - PubMed

Publication types

LinkOut - more resources