. 2023 Aug 9;31(8):1404-1416.e4.
doi: 10.1016/j.chom.2023.06.015. Epub 2023 Jul 24.

T cell reactivity to Bordetella pertussis is highly diverse regardless of childhood vaccination

Affiliations

T cell reactivity to Bordetella pertussis is highly diverse regardless of childhood vaccination

Ricardo da Silva Antunes et al. Cell Host Microbe. .

Abstract

The incidence of whooping cough due to Bordetella pertussis (BP) infections has increased recently. It is believed that the shift from whole-cell pertussis (wP) vaccines to acellular pertussis (aP) vaccines may be contributing to this rise. While T cells are key in controlling and preventing disease, nearly all knowledge relates to antigens in aP vaccines. A whole-genome mapping of human BP-specific CD4+ T cell responses was performed in healthy vaccinated adults and revealed unexpected broad reactivity to hundreds of antigens. The overall pattern and magnitude of T cell responses to aP and non-aP vaccine antigens are similar regardless of childhood vaccination, suggesting that asymptomatic infections drive the pattern of T cell reactivity in adults. Lastly, lack of Th1/Th2 polarization to non-aP vaccine antigens suggests these antigens have the potential to counteract aP vaccination Th2 bias. These findings enhance our insights into human T cell responses to BP and identify potential targets for next-generation pertussis vaccines.

Keywords: ORF; T cell; accelular vaccine; antigen; asymptomatic; childhood vaccination; epitope; infection; pertussis; polarization; whole-cell vaccine.


Conflict of interest statement

Declaration of interests The La Jolla Institute for Immunology has filed for patent protection for various aspects of the BP epitope pools design.

Figures

Figure 1.
Figure 1.. Schematic of BP genome-wide screening and summary of experimental design and strategy.
(A) CD4+ T cell reactivity spanning the entire BP proteome was assayed with a library of 24,877 peptides in 3 sequential steps, directly ex vivo using a high throughput Activation Induced Marker (AIM) assay flow cytometry methodology. (B) Dot plots show representative AIM+ CD4+ T cell responses after stimulation with a single peptide (red box) or with negative (DMSO) and positive (PHA) controls. (C-E) An example of the entire BP peptide library screening and epitope identification for a representative individual donor is shown. (C) Screening of entire library organized in 133 pools of 188 15-mer peptides (MegaPools; MP). (D) Deconvolution of one positive representative MP (MP#39) into 8 pools of 22–24 individual peptides (MesoPools; MS). (E) Deconvolution of one positive representative MS (MS#39.7) for assessment of individual peptide response (n=24). Associated percentage of response (magnitude) for each pool/peptide is indicated in y axis. Dotted lines represent the cut-off value associated with the threshold of positivity (TP).
Figure 2.
Figure 2.. Large breadth of BP-specific CD4+ T cell responses in humans.
(A) Dominance of epitope response across the entire cohort (n=40) indicated by proportion of donors who responded to the specified number of epitopes. (B) Proportion of the number of epitopes that account for the response of each individual ORFs. (C, D) Breadth of epitope (C) or antigen (D) response ranked on the basis of % of total response (Black dashed line). Grey dotted lines indicate the top 50, 75 and 90 percent of total response and associated number of epitopes or ORFs. (E) Overall map of CD4+ T cell responses by antigen (ORF) reactivity across the entire cohort (n=40) showing the position of each individual ORF identified across the aligned BP genome, using the Tohama I and D420 BP strains as reference. The y-axis indicates the percentage of the total response (recognition of all antigens) for each ORF, calculated by summing all the reactivity of individual epitopes for a recognized ORF across all 40 donors. Each bar represents an individual ORF and annotation of specific antigens is shown (red – aP vaccine antigens; green – dominant non-aP vaccine antigens).
Figure 3.
Figure 3.. aP and non-aP vaccine antigens are similarly recognized in aP- and wP-primed donors.
Graphs show comparison of responses between aP- and wP-primed donors in terms of (A,D) magnitude, (B,E) number of epitopes, and (C,F) number of ORFs for aP vaccine antigens (Grey triangles, upper panel) or non-aP vaccine antigens (Grey circles, bottom panel), respectively. Each symbol denotes an individual donor (n=40; 20 in each group). Bars represent geometric mean ± geometric SD. p values calculated by Mann-Whitney statistical analysis are indicated.
Figure 4.
Figure 4.. Sequence conservation is not a major driver of immunogenicity.
Peptide homology amongst different BP strains or Bordetella genus was evaluated for the entire set of peptides tested in this study. (A) percent of homology across different BP strains for unrecognized (negative), unconfirmed or confirmed (positive) non-aP vaccine derived peptides (B) percent of positive peptides across different BP strains for peptide conservation in non-aP vaccine derived peptides. (C) percent of variable peptides across different BP strains for negative, unconfirmed or positive non-aP vaccine derived peptides. (D) percent of homology across different BP strains for negative, unconfirmed or positive aP vaccine derived peptides (E) percent of positive peptides across different BP strains for peptide conservation in aP vaccine derived peptides. (F) percent of conserved peptides across different BP strains for negative, unconfirmed or positive aP vaccine derived peptides. (G) percent of homology across different Bordetella for negative, unconfirmed or positive non-aP vaccine derived peptides (H) percent of positive peptides across different Bordetella for peptide conservation in non-aP vaccine derived peptides. (I) percent of variable peptides across different Bordetella for negative, unconfirmed or positive non-aP vaccine derived peptides. (J) percent of homology across different Bordetella for negative, unconfirmed or positive aP vaccine derived peptides (K) percent of positive peptides across different Bordetella for peptide conservation in aP vaccine derived peptides. (L) percent of variable peptides across different Bordetella for negative, unconfirmed or positive aP vaccine derived peptides. p values calculated by Kruskal-Wallis test adjusted with Dunn’s test for multiple comparisons are indicated.
Figure 5.
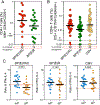
Figure 5.. Th2 polarization is specific to the aP vaccine antigens, in individuals originally primed with aP vaccine.
Antigen specific CD4+ T cell responses from aP and non-aP vaccine antigens were detected with BP(E)VAC and BP(E)R peptide pools respectively. (A) percentage of AIM+ (OX40+CD25+) CD4+ T cells after stimulation of PBMCs with peptide pools (n=20) (B) percentage of ICS+cytokine+ (CD154+) CD4+ T cells after stimulation of PBMCs with peptide pools (n=40). Black dotted lines represent the cut-off value associated with the threshold of positivity (TP) and percentage of donor recognition is indicated for each stimuli. (C) Polarization of CD4+ T cell responses represented as ratio of IFNγ/IL-4 cytokine response for each individual pool (n=40; 20 for aP and 20 for wP groups). Red dotted line indicates a Ratio=1. In all graphs, each circle represents a donor. Tick black lines represent geometric mean ± geometric SD, and p values were calculated by Mann-Whitney.
Figure 6.
Figure 6.. non-aP vaccine antigen responses are not polarized as function of priming childhood vaccination.
Antigen specific CD4+ T cell responses from 11 individual non-aP vaccine dominant antigens were detected with overlapping (O) peptide pools and represented as the sum of all MPs responses (BP(O)1-15) or as each individual MP response (ANT1-ANT11). BP(E)VAC pool was used as control respectively. (A) percentage of AIM+ (OX40+CD25+) CD4+ T cells after stimulation of PBMCs with peptide pools (n=20) (B) percentage of ICS+cytokine+ (CD154+) CD4+ T cells after stimulation of PBMCs with peptide pools (BP(E)VAC, n=40; BP(O)1-15, n=20; ANT1, 3, 8, and 9, n=34; all other ANT, n=20). Black dotted lines represent the cut-off value associated with the threshold of positivity (TP) and percentage of donor recognition is indicated for each stimuli. (C) Polarization of CD4+ T cell responses represented as ratio of IFNγ/IL-4 cytokine response for each individual pool (n=34; 17 for aP and 17 for wP groups). Red dotted line indicates a Ratio=1. In all graphs, each circle represents a donor. Tick black lines represent geometric mean ± geometric SD, and p values were calculated by Mann-Whitney.

References

    1. CDC (2023). Pertusis (Whooping Cough).
    1. Klein NP (2014). Licensed pertussis vaccines in the United States. History and current state. Hum Vaccin Immunother 10, 2684–2690. 10.4161/hv.29576. - DOI - PMC - PubMed
    1. Esposito S, Stefanelli P, Fry NK, Fedele G, He Q, Paterson P, Tan T, Knuf M, Rodrigo C, Weil Olivier C, et al. (2019). Pertussis Prevention: Reasons for Resurgence, and Differences in the Current Acellular Pertussis Vaccines. Front Immunol 10, 1344. 10.3389/fimmu.2019.01344. - DOI - PMC - PubMed
    1. Kuehn BM (2021). Resurgence of Pertussis Linked With Switch to Acellular Vaccine. JAMA 326, 300. 10.1001/jama.2021.11153. - DOI - PubMed
    1. Chen Z, and He Q (2017). Immune persistence after pertussis vaccination. Hum Vaccin Immunother 13, 744–756. 10.1080/21645515.2016.1259780. - DOI - PMC - PubMed

Substances