. 2023 Jul 1;37(13-14):570-589.
doi: 10.1101/gad.350594.123. Epub 2023 Jul 25.

Histone bivalency regulates the timing of cerebellar granule cell development

Affiliations

Histone bivalency regulates the timing of cerebellar granule cell development

Kärt Mätlik et al. Genes Dev. .

Abstract

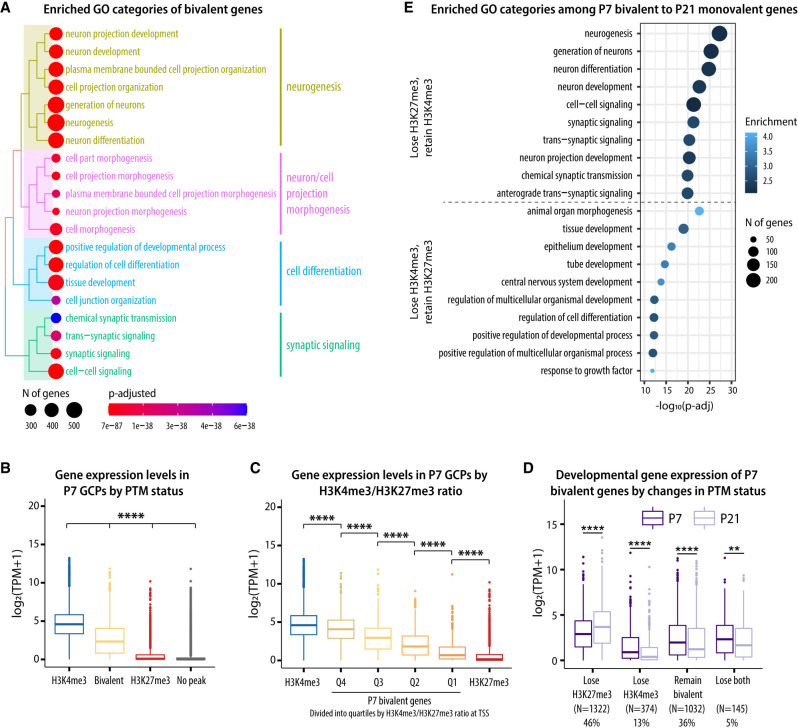
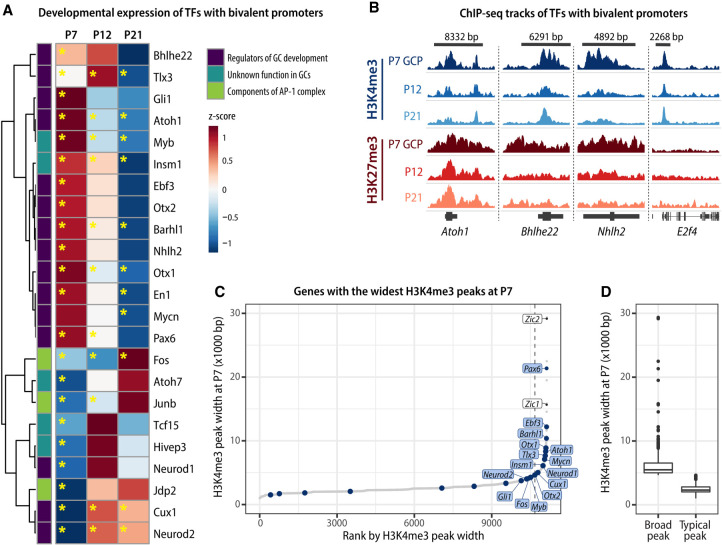
Developing neurons undergo a progression of morphological and gene expression changes as they transition from neuronal progenitors to mature neurons. Here we used RNA-seq and H3K4me3 and H3K27me3 ChIP-seq to analyze how chromatin modifications control gene expression in a specific type of CNS neuron: the mouse cerebellar granule cell (GC). We found that in proliferating GC progenitors (GCPs), H3K4me3/H3K27me3 bivalency is common at neuronal genes and undergoes dynamic changes that correlate with gene expression during migration and circuit formation. Expressing a fluorescent sensor for bivalent domains revealed subnuclear bivalent foci in proliferating GCPs. Inhibiting H3K27 methyltransferases EZH1 and EZH2 in vitro and in organotypic cerebellar slices dramatically altered the expression of bivalent genes, induced the down-regulation of migration-related genes and up-regulation of synaptic genes, inhibited glial-guided migration, and accelerated terminal differentiation. Thus, histone bivalency is required to regulate the timing of the progression from progenitor cells to mature neurons.

Keywords: H3K27me3; cerebellum; glial-guided migration; granule cells; histone bivalency; mouse.


Figures

Figure 1.
Figure 1.
Characterization of gene expression and chromatin landscape in developing mouse cerebellar granule cells. (A) Schematic of postnatal GC development. During late embryogenesis and the first postnatal week, granule cell progenitors (GCPs) undergo clonal expansion in the external granule cell layer (EGL). Upon exiting the cell cycle, immature GCs extend parallel fibers and a leading process and begin glial-guided migration along Bergmann glia fibers. After passing the Purkinje cell layer (PL), the GCs stop migrating and extend dendrites, forming synapses with mossy fiber afferents to form the cerebellar circuitry. (IGL) Internal granule layer, (ML) molecular layer, (P) postnatal day. (B) Genome browser view of representative genes undergoing gene expression and histone modification changes during GC development. Representative ChIP-seq and TRAP RNA-seq samples are shown. H3K4me3 (n = 2–3 samples/group) and H3K27me3 (n = 4–5 samples/group) ChIP-seq was performed on chromatin isolated from GCPs (P7) or from GC nuclei sorted using FANS (P12 and P21). RNA-seq was performed on TRAP RNA isolated from P5–P7 Tg(Atoh1-Egfp-L10a) GCPs (P7-GCP; n = 4 samples/group) or from the cerebellar lysates of Tg(Neurod1-Egfp-L10a) mice at P7 (P7-GC), P12, and P21 (n = 5 mice/group). (C, left) Heat map depicting differentially expressed (DE) genes in developing GCs. DE genes (P-adj < 0.01, log2FC ≥ 1) were identified by pairwise comparisons between groups using DESeq2 and sorted by the highest expressed genes at each age. (Right) Gene ontology (GO) analysis of the highest expressed genes at each developmental time point, identified using clusterProfiler. The GO biological process categories were sorted by the adjusted P-value, and the top five enriched nonredundant categories are shown for each age. (D) Relative signal of the histone modifications H3K4me3 and H3K27me3 around transcription start sites (TSSs) at P7, P12, and P21, grouped into quintiles based on gene expression levels.
Figure 2.
Figure 2.
H3K4me3/H3K27me3 bivalent promoters are prevalent in proliferating GC progenitors. (A) Genomic distribution of bivalent peaks. Bivalent peaks were defined as regions where H3K4me3 and H3K27me3 peaks overlapped. The genomic distribution of the identified bivalent peaks was determined using the ChIPseeker package. (B) Enrichment map depicting ChIP-seq normalized reads in P7 GCPs, centered at TSS ± 2.5 kb, sorted by H3K4me3 signal, and grouped by TSS status (H3K4me3-only, bivalent, or H3K27me3-only). (C) Genome browser view of representative bivalent genes. Shaded areas denote the bivalent regions around the TSS. (D) Venn diagrams depicting the number of bivalent, H3K4me3-only, and H3K27me3-only genes across GC development. Examples of bivalent genes are shown. Note that bivalent genes are particularly common in P7 GCPs, while the majority of H3K4me3-only and H3K27me3-only genes are stable between P7 and P21. (E) Alluvial plot showing the dynamics of histone post-translational modifications between P7 and P21. Bars represent PTM statuses at promoters, and lines indicate the changes in PTMs over development. Only genes that are either bivalent or H3K27me3-only at any age are shown. Bivalent genes are highlighted with dark-gray bars. Groups that contain <0.5% of included genes were omitted for simplicity. Note that a major fraction of P7 bivalent genes become H3K4me3-only by P12 or P21, whereas most P7 H3K27me3-only genes remain H3K27me3-only until P21.
Figure 3.
Figure 3.
Identification of bivalent domains ex vivo. (A) Schematic of the cMAP3 bivalency probe used to detect truly bivalent domains ex vivo. The probe consists of a fluorophore (Emerald) fused with H3K27me3 and H3K4me3 reader domains. The plasmid coexpresses tdTomato under IRES for assessing GC morphology. (B) Representative images of GCs electroporated with the cMAP3 bivalency probe, showing the subnuclear localization of bivalent domains. Scale bar, 5 µm.
Figure 4.
Figure 4.
H3K4me3/H3K27me3 bivalency predicts gene expression levels in GCs. (A) Enriched GO (biological process) categories of bivalent genes identified using the clusterProfiler package. The top 20 identified categories were plotted using the treeplot function to visualize the relationship between the categories. (B) At P7, bivalent genes are expressed at lower levels than H3K4me3-only genes but at higher levels than H3K27me3 or no-peak genes. Kruskal–Wallis one-way ANOVA followed by Dunn's post hoc test. (****) P < 0.0001 between all comparisons. (C) The expression of bivalent genes correlates with H3K4me3/H3K27me3 ratio at the TSS. One-way ANOVA followed by Tukey HSD post hoc test. Correction for multiple comparisons was performed considering all comparisons, but only significances between adjacent groups are shown. (****) P < 0.0001. (D) Changes in the PTM status of bivalent genes correlate with gene expression across GC development. Pairwise t-test, adjusted for multiple comparisons using the BH method. (**) P < 0.01, (****) P < 0.0001. (E) Enriched GO (biological process) categories among genes that change from bivalent to monovalent between P7 and P21, identified with clusterProfile.
Figure 5.
Figure 5.
Transcription factors that establish GC identity are bivalent. (A) Heat map depicting the developmental gene expression dynamics of selected transcription factors with bivalent promoters. Yellow asterisks denote the time points when the genes are bivalent. (B) Integrative Genome Browser view of H3K4me3 and H3K27me3 signal at selected transcription factors during GC development. The indicated bivalent TFs are marked with broad domains of H3K4me3, which are found on genes involved in maintaining cellular identity. Peak widths are indicated at the top of the tracks. (C) P7 H3K4me3 peaks ranked by width in base pairs. The dashed line denotes the cutoff point between “broad” (n = 495) and “typical” (n = 10,673) peaks, determined using the elbow point method. Peaks annotated to the promoters of bivalent TF genes are shown in blue. (D) Widths of broad and typical H3K4me3 peaks in proliferating GCPs at P7.
Figure 6.
Figure 6.
The effect of EZH1/2 inhibition on gene expression in cultured GCs. (A) Developmental expression of H3K27 methyltransferases Ezh1 and Ezh2, based on TRAP RNA-seq (n = 4–5/group). (B) Immunoblot detection of H3K27me3 levels in GCs cultured for 5 d in vitro (DIV) in the presence of vehicle control (DMSO) or increasing concentrations of EZH1/2 inhibitor UNC1999 (in nanomolar). H3 was used as a loading control. (C) Heat map depicting differentially expressed genes in response to EZH1/2 inhibition after treatment with 100 nM UNC1999, compared with DMSO. (D) The percent of genes in each PTM category (based on P7 GCP ChIP-seq) that were up-regulated or down-regulated in cultured GCs in response to UNC1999 treatment compared with DMSO. More than 10% of all bivalent genes were differentially expressed, and the differentially expressed bivalent genes were significantly more likely to be up-regulated than down-regulated. Statistical analysis indicates the difference between the distribution of up-regulated and down-regulated genes between each PTM group. Pairwise Fisher test was performed using the rstatix package, and P-values were corrected for multiple comparisons using the FDR method. (**) P < 0.01, (***) P < 0.001, (****) P < 0.0001. (EG) Volcano plots depicting differentially expressed bivalent (E), H3K4me3-only (F), or H3K27me3-only (G) genes in response to UNC1999 treatment, compared with DMSO. The number of up-regulated or down-regulated genes is indicated at the top of the chart. (H) Genome browser representation of RNA-seq tracks of selected bivalent genes at 5 DIV. Actb is shown as a control. (I) Volcano plot depicting differentially expressed genes (P-adj < 0.05, indicated with red) in response to UNC1999 treatment compared with DMSO. Up-regulated genes include several well-known marker genes of mature GCs, such as Gabra6, Cbln3, and Grm4. (J) Enriched GO categories of up-regulated and down-regulated genes after UNC1999 treatment compared with DMSO, identified using clusterProfiler package. The GO biological process categories were sorted by the adjusted P-value, and the top five enriched nonredundant categories are shown for each group.
Figure 7.
Figure 7.
H3K4me3/H3K27me3 bivalency regulates the timing of GC neuronal maturation. (A) Schematic of the experimental design. A plasmid encoding the Venus fluorophore was electroporated into the cerebellum, and organotypic cerebellar slices were made and cultured in the presence of vehicle control (DMSO) or 200 nM UNC1999 for 60 h. The morphology and subcortical localization of GCs were evaluated to identify GCs at different stages of development. (B) Images of electroporated GCs in ex vivo cerebellar slices treated with vehicle control (DMSO) or UNC1999 for 60 h. Control cells exhibit a bipolar morphology typical of migrating GCs, with a leading process oriented in the direction of migration (white arrows) and few multipolar cells (white asterisks). In contrast, cells treated with UNC1999 displayed inhibited migration and multipolar morphology. Scale bar, 25 µm. (C) GC migration distance after vehicle control (DMSO) or UNC1999 treatment, measured as the distance of the cell soma to the outer edge of the parallel fiber axons. Each replicate included slices from two to three P8 mouse pups per condition. GC migration distance was quantified from four replicates for a total of 868 cells (DMSO) or 2334 cells (UNC1999). (D) Quantification of the percentage of bipolar and multipolar GCs out of all Venus-expressing cells in the molecular layer. Each replicate included slices from two to three postnatal P8 mouse pups per condition. For the vehicle control (DMSO) condition, regions of interest were imaged from five replicates for a total of 593 cells. For the UNC1999 condition, regions of interest were imaged from four replicates for a total of 880 cells. (E) Images of electroporated GCs in ex vivo cerebellar slices prepared from wild-type (Ezh1wt/wt;Atoh1-Cre) and Ezh1 cKO (Ezh1fl/fl;Atoh1-Cre) mice. Similar to UNC1999-treated GCs, Ezh1 cKO cells display an increased number of multipolar GCs (white asterisks) and fewer migrating GCs with a bipolar morphology (white arrows). Scale bar, 25 µm. (F) GC migration distance in wild-type and Ezh1 cKO cells. Distances were measured from three P8 mouse pups per genotype. GC migration distance was quantified from a total of 981 cells (wild type) or 1066 cells (Ezh1 cKO). (G) Quantification of the percentage of bipolar and multipolar GCs out of all Venus-expressing cells in the molecular layer. Cells were counted from three P8 mouse pups per genotype. Regions of interest were imaged from slices prepared from each mouse pup for each condition for a total of 378 cells (wild type) or 512 cells (Ezh1 cKO). Student's t-test. (**) P < 0.01, (****) P < 0.0001.

Update of

References

    1. Aoyama K, Oshima M, Koide S, Suzuki E, Mochizuki-Kashio M, Kato Y, Tara S, Shinoda D, Hiura N, Nakajima-Takagi Y, et al. 2018. Ezh1 targets bivalent genes to maintain self-renewing stem cells in Ezh2-insufficient myelodysplastic syndrome. iScience 9: 161–174. 10.1016/j.isci.2018.10.008 - DOI - PMC - PubMed
    1. Barski A, Cuddapah S, Cui K, Roh TY, Schones DE, Wang Z, Wei G, Chepelev I, Zhao K. 2007. High-resolution profiling of histone methylations in the human genome. Cell 129: 823–837. 10.1016/j.cell.2007.05.009 - DOI - PubMed
    1. Behesti H, Kocabas A, Buchholz DE, Carroll TS, Hatten ME. 2021. Altered temporal sequence of transcriptional regulators in the generation of human cerebellar granule cells. Elife 10: 67074. 10.7554/eLife.67074 - DOI - PMC - PubMed
    1. Benayoun BA, Pollina EA, Ucar D, Mahmoudi S, Karra K, Wong ED, Devarajan K, Daugherty AC, Kundaje AB, Mancini E, et al. 2014. H3K4me3 breadth is linked to cell identity and transcriptional consistency. Cell 158: 673–688. 10.1016/j.cell.2014.06.027 - DOI - PMC - PubMed
    1. Bernstein BE, Kamal M, Lindblad-Toh K, Bekiranov S, Bailey DK, Huebert DJ, McMahon S, Karlsson EK, Kulbokas EJ, Gingeras TR, et al. 2005. Genomic maps and comparative analysis of histone modifications in human and mouse. Cell 120: 169–181. 10.1016/j.cell.2005.01.001 - DOI - PubMed

Publication types