. 2023 Jul 25;10(1):34.
doi: 10.1186/s40779-023-00470-y.

RARRES2 regulates lipid metabolic reprogramming to mediate the development of brain metastasis in triple negative breast cancer

Affiliations

RARRES2 regulates lipid metabolic reprogramming to mediate the development of brain metastasis in triple negative breast cancer

Yi-Qun Li et al. Mil Med Res. .

Abstract

Background: Triple negative breast cancer (TNBC), the most aggressive subtype of breast cancer, is characterized by a high incidence of brain metastasis (BrM) and a poor prognosis. As the most lethal form of breast cancer, BrM remains a major clinical challenge due to its rising incidence and lack of effective treatment strategies. Recent evidence suggested a potential role of lipid metabolic reprogramming in breast cancer brain metastasis (BCBrM), but the underlying mechanisms are far from being fully elucidated.

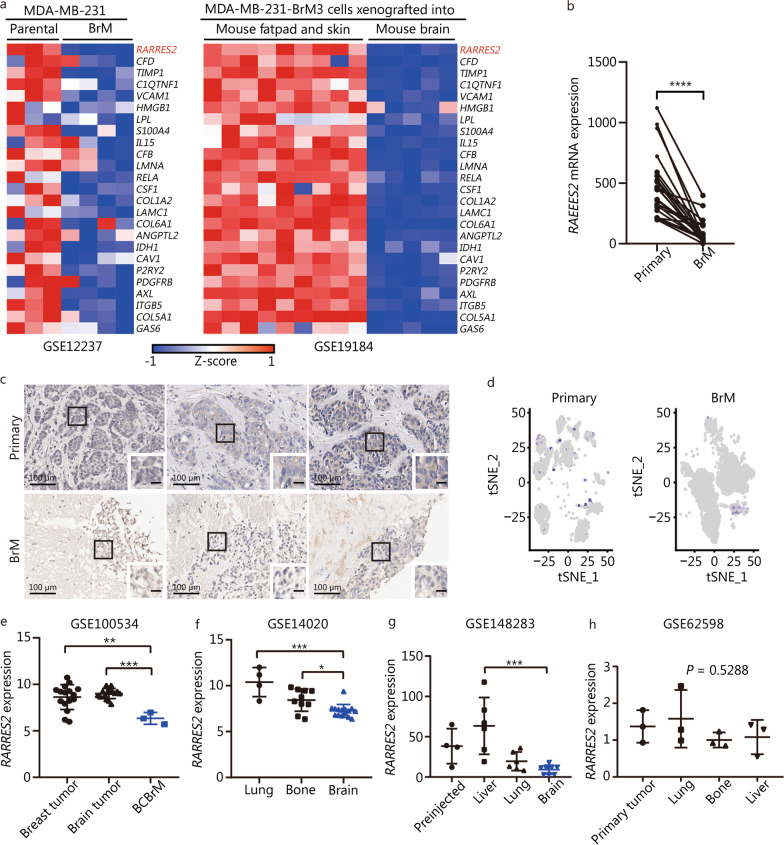
Methods: Through analysis of BCBrM transcriptome data from mice and patients, and immunohistochemical validation on patient tissues, we identified and verified the specific down-regulation of retinoic acid receptor responder 2 (RARRES2), a multifunctional adipokine and chemokine, in BrM of TNBC. We investigated the effect of aberrant RARRES2 expression of BrM in both in vitro and in vivo studies. Key signaling pathway components were evaluated using multi-omics approaches. Lipidomics were performed to elucidate the regulation of lipid metabolic reprogramming of RARRES2.

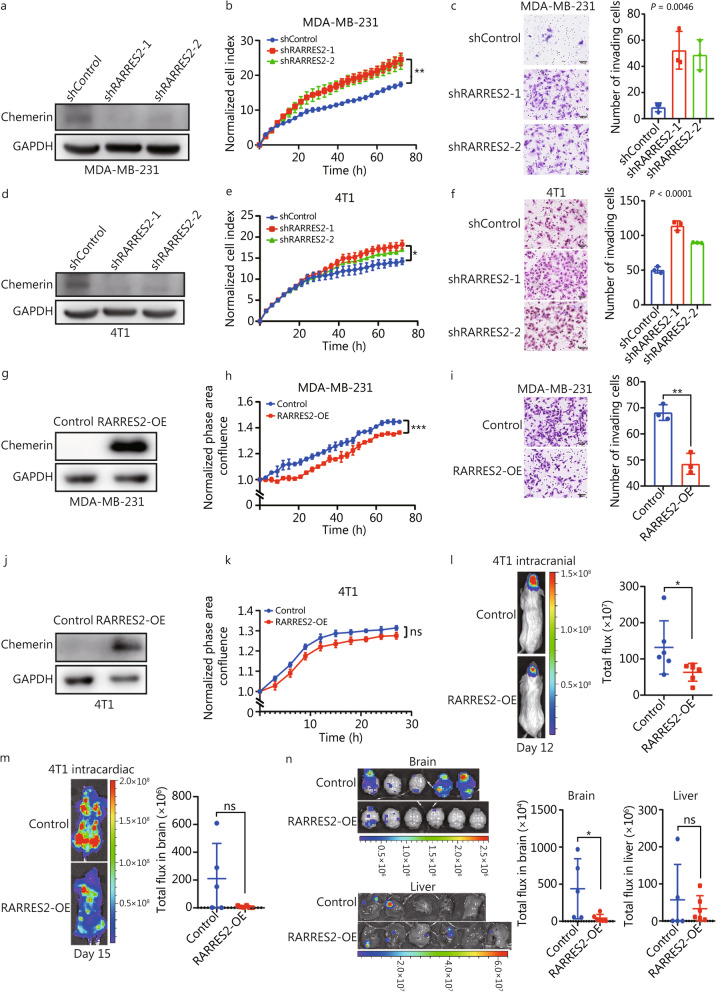
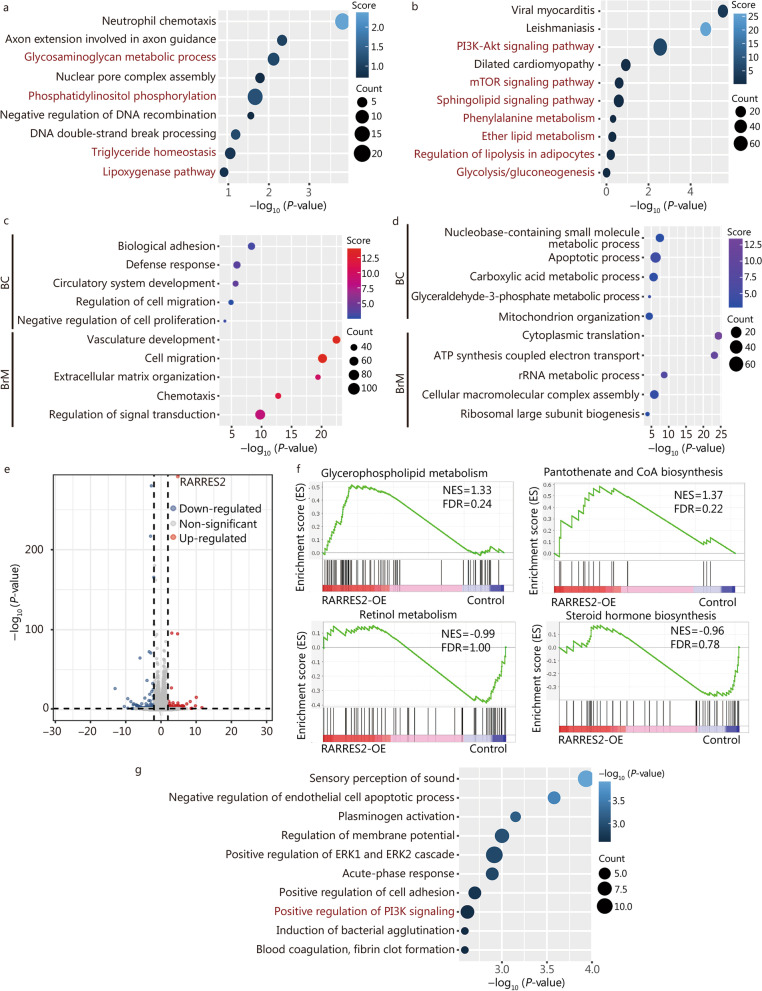
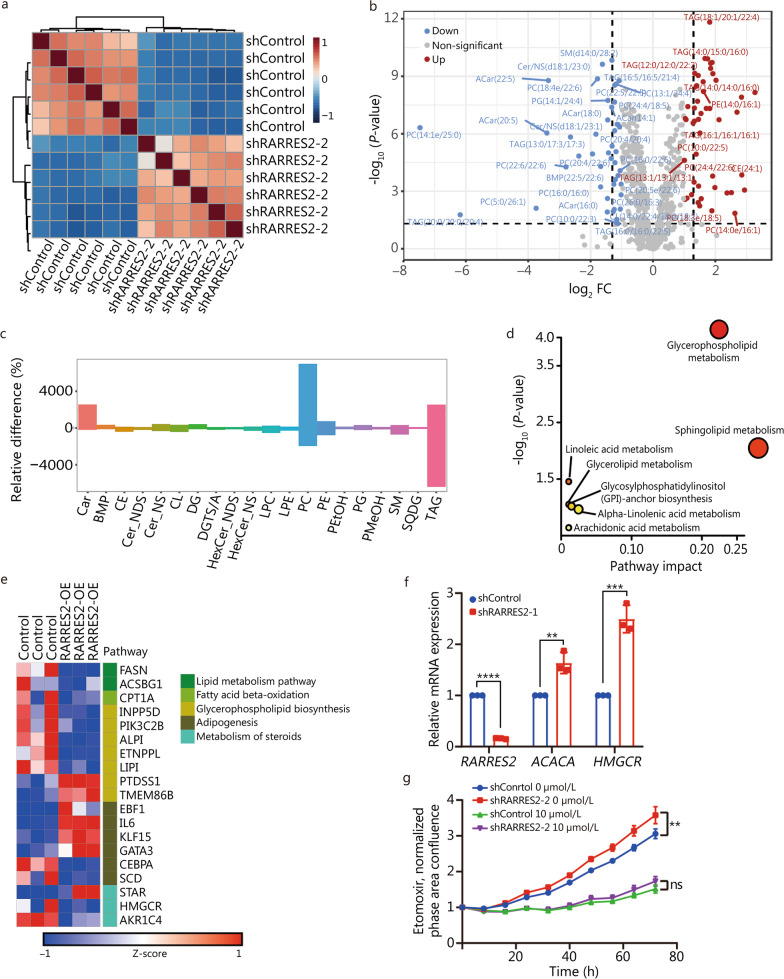
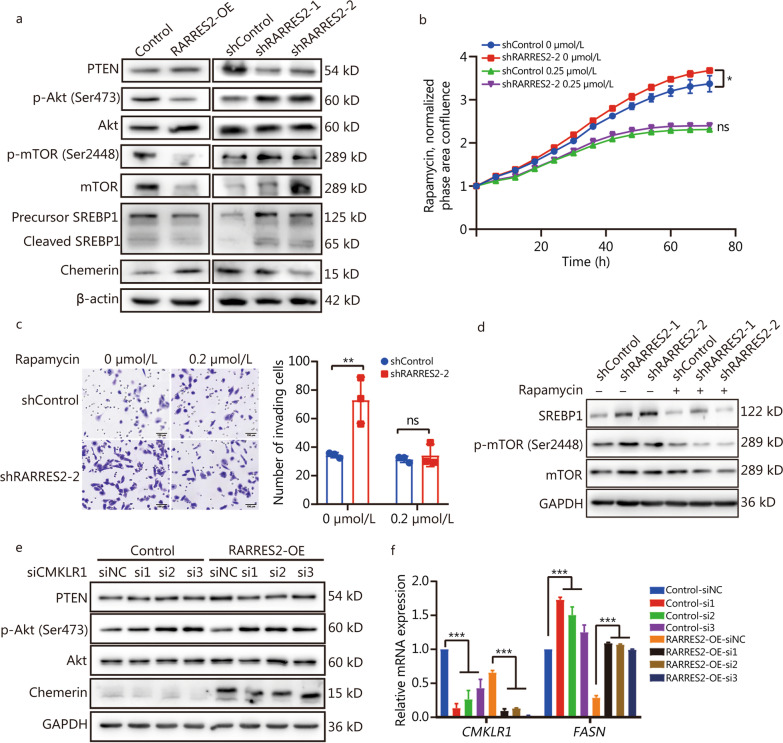
Results: We found that down-regulation of RARRES2 is specifically associated with BCBrM, and that RARRES2 deficiency promoted BCBrM through lipid metabolic reprogramming. Mechanistically, reduced expression of RARRES2 in brain metastatic potential TNBC cells resulted in increased levels of glycerophospholipid and decreased levels of triacylglycerols by regulating phosphatase and tensin homologue (PTEN)-mammalian target of rapamycin (mTOR)-sterol regulatory element-binding protein 1 (SREBP1) signaling pathway to facilitate the survival of breast cancer cells in the unique brain microenvironment.

Conclusions: Our work uncovers an essential role of RARRES2 in linking lipid metabolic reprogramming and the development of BrM. RARRES2-dependent metabolic functions may serve as potential biomarkers or therapeutic targets for BCBrM.

Keywords: Brain metastasis (BrM); Breast cancer; Lipid metabolic reprogramming; RARRES2.


Conflict of interest statement

The authors declare there is no competing interests.

Figures

Fig. 1
Fig. 1
RARRES2 is downregulated in breast cancer brain metastasis (BrM). a Heatmap showing transcription levels of 25 common adipokine-related genes in parental and MDA-MB-231 BrM cells (left), and in MDA-MB-231-BrM3 cells xenografted into mouse fatpad and skin or brain (right). Data came from the public datasets indicated at the bottom of the heatmaps. Blue indicates lower expression, while red indicates higher expression. b Comparison of RARRES2 expression between paired primary breast tumors (n = 22) and metastatic tumors to the brain (n = 22). ****P < 0.0001 (paired-sample t test). c Immunohistochemistry staining for RARRES2 in formalin-fixed, paraffin-embedded sections from primary triple negative breast cancer (TNBC, upper row) or tumors that had metastasized to the brain (lower row) in our patient. The black boxes indicate the area shown at higher magnification (Scale bar = 10 μm) in the insets at the lower right of each micrograph (Scale bar = 100 μm). d scRNA-seq data analysis of RARRES2 expression from human TNBC (Primary) and BrM cancer epithelial cells, presented as tSNE plots. e RARRES2 expression in human breast tumor tissues (n = 16), brain tumor tissues (n = 16), and BCBrM tissues (n = 3). Data were from the public dataset GSE100534. **P = 0.0016, ***P = 0.0003 (one-way ANOVA followed by Dunnett’s multiple-comparisons test). f RARRES2 expression in human breast cancer that had metastasized to lung (n = 4), bone (n = 10) or brain (n = 15). Data were from the public dataset GSE14020. *P = 0.019, ***< 0.001 (one-way ANOVA followed by Dunnett’s multiple-comparisons test). g RARRES2 expression in breast cancer cells before injection (n = 4) into mice and after metastasis to the liver (n = 6), lung (n = 6), or brain (n = 8). Data came from GSE148283. ***P = 0.0003 (one-way ANOVA followed by Dunnett’s multiple-comparisons test). h RARRES2 expression in primary breast tumors (n = 3) and tumors that had metastasized to the lung (n = 3), bone (n = 3) or liver (n = 3) in mice. Data came from the public dataset GSE62598. The P-value was determined using one-way ANOVA. RARRES2 retinoic acid receptor responder 2, BCBrM breast cancer brain metastasis, scRNA-seq single-cell RNA-sequencing
Fig. 2
Fig. 2
RARRES2-OE inhibits metastasis of breast cancer to the brain. a–c MDA-MB-231 cells were stably transduced with lentivirus encoding short hairpin RNAs targeting RARRES2 (shRARRES2-1 and -2) or negative control RNA (shControl). Then, the cells were assayed for RARRES2 expression (a), proliferation (b) and invasion (c). Significance was assessed in panel (b) using two-way ANOVA with Geisser-Greenhouse correction (**P = 0.0023) or in panel c using one-way ANOVA followed by Dunnett’s multiple-comparisons test. d-f The experiments in panels a–c were repeated using cultures of 4T1 cells. In panel e, *P = 0.0177. g–i Immunoblot of lysate confirming overexpression of RARRES2 (g), cell proliferation assay (h) and invasion assay (i) from MDA-MB-231 cells infected with control or encoding RARRES2 lentivirus (RARRES2-OE). Two-way ANOVA with Geisser-Greenhouse correction (h), ***P = 0.0005. Two-tailed unpaired sample t-test (i), **P = 0.0025. j, k Same as g, h for 4T1 cells, P = 0.1053 (k). l Bioluminescence imaging (BLI) at 12 d after intracranial injection of RARRES2-OE and Control 4T1 cells. The dots on the right represent the photon flux in brain for each mouse at day 12 (n = 6 for each group). *P = 0.0303 (two-sided Mann–Whitney test). m BLI at 15 d after intracardiac injection of RARRES2-OE and Control 4T1 cells. The dots on the right represent the photon flux in brain for each mouse at day 15 (n = 5 for Control, n = 6 for RARRES2-OE). Two-tailed unpaired-samples t test. n BLI of brain and liver from mice receiving intracardiac injection in the experiments. The dots on the right represent the photon flux in brain or liver for each mouse at day 15 (n = 5 for Control, n = 6 for RARRES2-OE). *P = 0.0401 (two-tailed unpaired-samples t test). RARRES2 retinoic acid receptor responder 2, RARRES2-OE RARRES2 overexpression, ns non-significant
Fig. 3
Fig. 3
Enrichment analyses indicate RARRES2 regulates lipid metabolic reprogramming and PI3K signaling pathway in breast cancer. a and b RARRES2 co-expression genes in TCGA-BRCA were analyzed for enrichment in Gene Ontology (GO) biological processes (a) and Kyoto Encyclopedia of Genes and Genomes (KEGG) pathways (b). The size of each bubble represents the number of genes, while the color represents the enrichment score. c and d GO biological process enrichment analysis of RARRES2 positive (c) or negative (d) co-expression genes in scRNA-seq of primary and BrM cancer epithelial cells mentioned in Fig. 1d. e Volcano plot showing the differentially expressed genes between RARRES2-OE and control MDA-MB-231 cells. Genes expressed at significantly higher levels in RARRES2-OE group are shown in red; genes expressed at significantly lower levels, blue; genes expressed non-significantly differently in the two cell lines, gray. The dashed lines indicate the cut-off in log2 (FC) and log10 (P-value) for a gene to be considered differentially expressed. f Gene set enrichment analysis of the differentially expressed genes between RARRES2-OE and control MDA-MB-231 cells showed upregulation of glycerophospholipid metabolism and biosynthesis of pantothenate and CoA, as well as downregulation of retinol metabolism and steroid hormone biosynthesis. g Differentially expressed genes in panel (e) were analyzed for enrichment in GO biological processes. The size of each bubble represents the number of genes in the process, while the color represents the -log10 (P-value). RARRES2 retinoic acid receptor responder 2, PI3K phosphatidylinositol 3-kinase, FC fold change, BrM brain metastasis, scRNA-seq single-cell RNA-sequencing, RARRES2-OE RARRES2 overexpression, mTOR mammalian target of rapamycin, NES normalized enrichment score, FDR false discovery rate
Fig. 4
Fig. 4
RARRES2 regulates lipid metabolism in MDA-MB-231 cells. a Correlation heatmap shows the lipid profiles between shRARRES2-2 and shControl MDA-MB-231 cells detected by untargeted lipidomic analysis. b Volcano plot showing the differentially expressed lipid metabolites in shRARRES2 in comparison to shControl samples. Blue and red circles represent lipid species that were significantly downregulated and upregulated, respectively, in shRARRES2 cells. c Relative differences in the content of lipid species between shRARRES2 and shControl MDA-MB-231 cells. d Metabolic pathways that were significantly upregulated in shRARRES2 MDA-MB-231 cells, based on our lipidomic profiling and the KEGG human metabolome database. e Heatmap of lipid metabolism genes differentially expressed between RARRES2-OE and control MDA-MB-231 cells. Each column in the matrix corresponds to a sample. Blue squares indicate genes downregulated in RARRES2-OE cells; red squares indicate genes upregulated in RARRES2-OE cells. f mRNA levels of ACACA and HMGCR in shRARRES2-1 and shControl MDA-MB-231 cells were examined by RT-qPCR. Levels of mRNA were normalized to those of GAPDH. **P = 0.006, ***P = 0.0007, ****P < 0.0001 (two-tailed unpaired-samples t test). g Viability of shRARRES2-2 and control MDA-MB-231 cells treated with 10 μmol/L etomoxir. The differences were tested for their significance using two-way ANOVA with Geisser-Greenhouse correction: **P = 0.0079. RARRES2 retinoic acid receptor responder 2, KEGG Kyoto Encyclopedia of Genes and Genomes, ACACA acetyl-CoA carboxylase alpha, HMGCR hydroxymethylglutaryl-CoA reductase, RT-qPCR real-time quantitative polymerase chain reaction, Car acylcarnitine, BMP bismonoacylglycerophosphate, CE cholesteryl ester, Cer_NDS ceramide non-hydroxyfatty acid-dihydrosphingosine, Cer_NS ceramide non-hydroxyfatty acid-sphingosine, CL cardiolipin, DG diacylglycerol, DGTS/A diacylglyceryl trimethylhomoserine/diacylglyceryl hydroxymethyl-N,N,N-trimethyl-β-alanine, HexCer_NDS hexosylceramide non-hydroxyfatty acid-sphingosine, HexCer_NS hexosylceramide non-hydroxyfatty acid-dihydrosphingosine, LPC lysophophatidylcholine, LPE lysophosphatidylethanolamine, PC phosphatidylcholine, PE phosphatidylethanolamine, PEtOH phosphatidylethanol, PG phosphatidylglycerol, PMeOH phosphatidylmethanol, SM sphingomyelin, SQDG sulfoquinovosyl diacylglycerol, TAG triacylglycerol, RARRES2-OE RARRES2 overexpression, ns non-significant
Fig. 5
Fig. 5
RARRES2 negatively regulates the PTEN-mTOR-SREBP1 axis. a Western blotting analysis of the levels of PTEN, Akt, p-Akt (Ser473), mTOR, p-mTOR (Ser2448), SREBP1 and Chemerin in RARRES2-OE, shRARRES2 and control MDA-MB-231 cells. b Viability of shRARRES2-2 and control MDA-MB-231 cells treated with 0.25 μmol/L rapamycin. Two-way ANOVA with Geisser-Greenhouse correction: *P = 0.0017. c Rapamycin treatment (0.2 μmol/L) rescues cell invasion in shRARRES2-2 MDA-MB-231 cells (Scale bar = 100 μm). Two-way ANOVA with Sidak’s multiple comparisons test: **P = 0.0133. d Western blotting analysis of the levels of mTOR, p-mTOR (Ser2448) and SREBP1 in shRARRES2 and control MDA-MB-231 cells treated with 0.2 μmol/L rapamycin. e Western blotting of total lysates of RARRES2-OE and control MDA-MB-231 cells, which were transfected with short interfering RNA against CMKLR1 (si1 – 3) or a negative-control RNA (siNC). f mRNA levels of CMKLR1 and FASN in the cultures described in panel (e). Levels of mRNAs were normalized to those of GAPDH. ***P < 0.001 (one-way ANOVA followed by Dunnett’s multiple-comparisons test). RARRES2 retinoic acid receptor responder 2, mTOR mammalian target of rapamycin, SREBP sterol regulatory element-binding protein, CMKLR1 chemokine-like receptor-1, FASN fatty acid synthase, RARRES2-OE RARRES2 overexpression, ns non-significant

Comment in

References

    1. Siegel RL, Miller KD, Fuchs HE, Jemal A. Cancer statistics, 2021. CA Cancer J Clin. 2021;71(1):7–33. doi: 10.3322/caac.21654. - DOI - PubMed
    1. Lin NU, Bellon JR, Winer EP. CNS metastases in breast cancer. J Clin Oncol. 2004;22(17):3608–3617. doi: 10.1200/JCO.2004.01.175. - DOI - PubMed
    1. Lin NU, Vanderplas A, Hughes ME, Theriault RL, Edge SB, Wong YN, et al. Clinicopathologic features, patterns of recurrence, and survival among women with triple-negative breast cancer in the National Comprehensive Cancer Network. Cancer. 2012;118(22):5463–5472. doi: 10.1002/cncr.27581. - DOI - PMC - PubMed
    1. Boire A, Brastianos PK, Garzia L, Valiente M. Brain metastasis. Nat Rev Cancer. 2020;20(1):4–11. doi: 10.1038/s41568-019-0220-y. - DOI - PubMed
    1. Sirhan Z, Thyagarajan A, Sahu RP. The efficacy of tucatinib-based therapeutic approaches for HER2-positive breast cancer. Mil Med Res. 2022;9(1):39. - PMC - PubMed

Publication types