Meta-Analysis
. 2023 Jul 25;14(1):4473.
doi: 10.1038/s41467-023-40069-4.

Overcoming attenuation bias in regressions using polygenic indices

Affiliations
Meta-Analysis

Overcoming attenuation bias in regressions using polygenic indices

Hans van Kippersluis et al. Nat Commun. .

Abstract

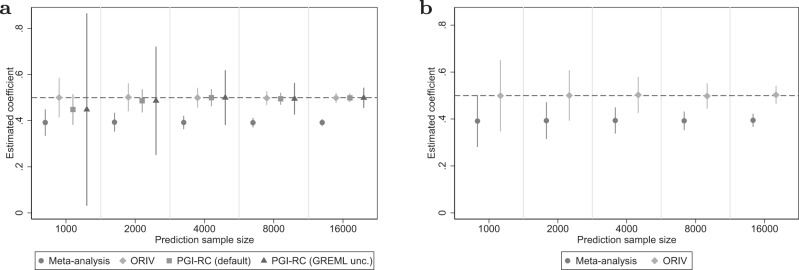
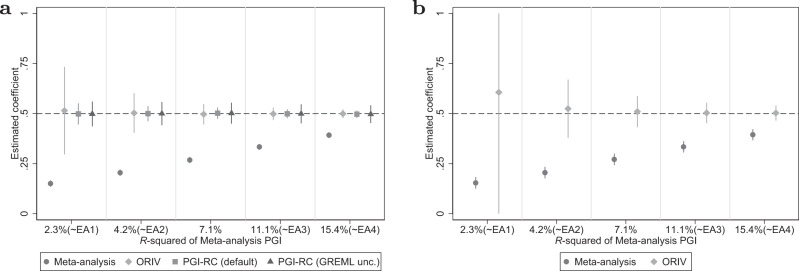
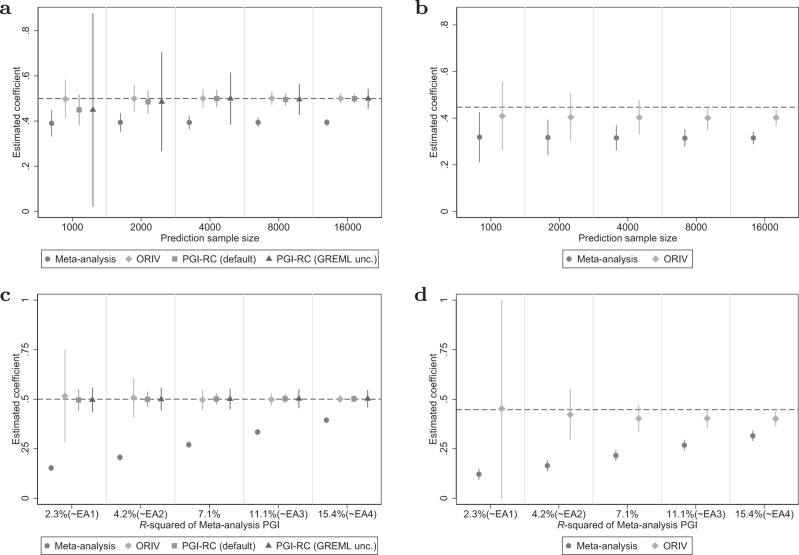
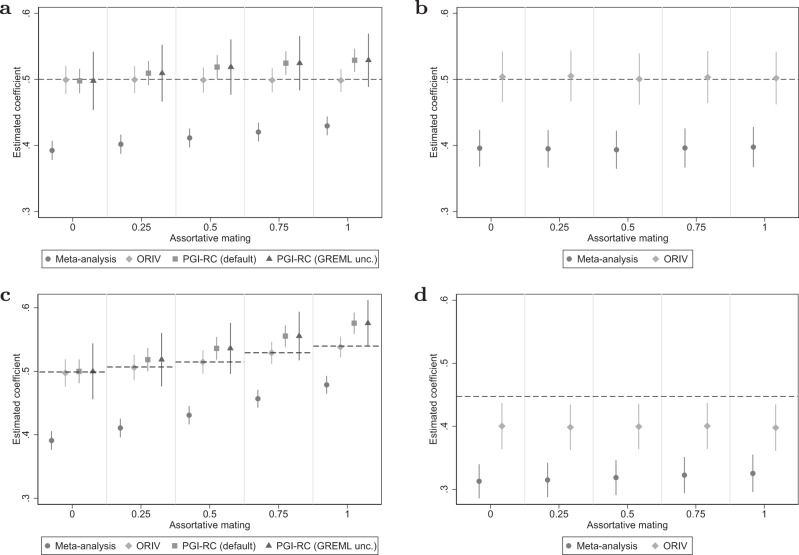
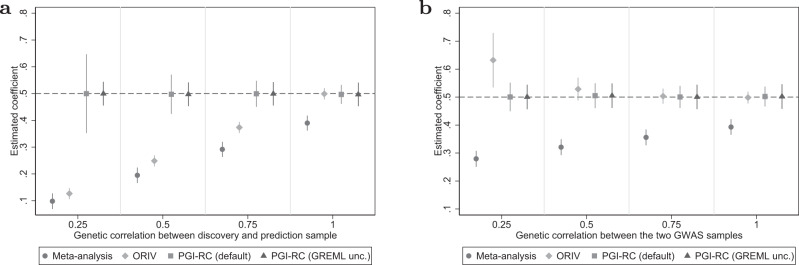
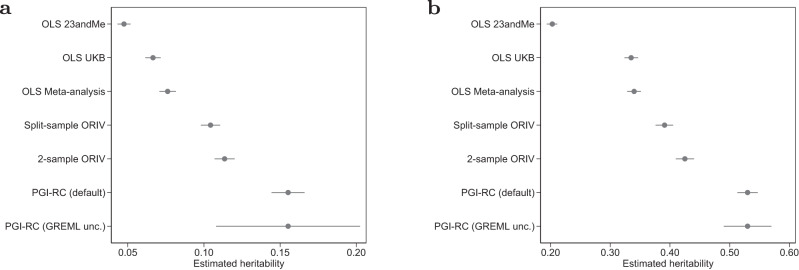
Measurement error in polygenic indices (PGIs) attenuates the estimation of their effects in regression models. We analyze and compare two approaches addressing this attenuation bias: Obviously Related Instrumental Variables (ORIV) and the PGI Repository Correction (PGI-RC). Through simulations, we show that the PGI-RC performs slightly better than ORIV, unless the prediction sample is very small (N < 1000) or when there is considerable assortative mating. Within families, ORIV is the best choice since the PGI-RC correction factor is generally not available. We verify the empirical validity of the simulations by predicting educational attainment and height in a sample of siblings from the UK Biobank. We show that applying ORIV between families increases the standardized effect of the PGI by 12% (height) and by 22% (educational attainment) compared to a meta-analysis-based PGI, yet estimates remain slightly below the PGI-RC estimates. Furthermore, within-family ORIV regression provides the tightest lower bound for the direct genetic effect, increasing the lower bound for the standardized direct genetic effect on educational attainment from 0.14 to 0.18 (+29%), and for height from 0.54 to 0.61 (+13%) compared to a meta-analysis-based PGI.


Conflict of interest statement

The authors declare no competing interests.

Figures

Fig. 1
Fig. 1. Variation in prediction sample size.
a Between-family analyses. b Within-family analyses. Data are presented as the estimated coefficients +/− 1.96 times the standard error (95% confidence interval) for the Polygenic Index (PGI) using meta-analysis (circles), Obviously Related Instrumental Variables (ORIV, rhombuses), the default PGI-RC procedure (squares), and the PGI-RC procedure, taking into account uncertainty in the GREML estimates (triangles) in the baseline scenario (no genetic nurture, no assortative mating) and holding constant the GWAS discovery sample such that the resulting meta-analysis PGI has an R2 of 15.4%. The horizontal dashed line represents the true coefficient. The simulation results are based on 100 replications.
Fig. 2
Fig. 2. Variation in GWAS sample size.
a Between-family analyses. b Within-family analyses. Data are presented as the estimated coefficients +/− 1.96 times the standard error (95% confidence interval) for the Polygenic Index (PGI) using meta-analysis (circles), Obviously Related Instrumental Variables (ORIV, rhombuses), the default PGI-RC procedure (squares), and the PGI-RC procedure, taking into account uncertainty in the GREML estimates (triangles) in the baseline scenario (no genetic nurture, no assortative mating) and holding constant the prediction sample at N = 16,000. The confidence interval for EA1 in the within-family analysis extends beyond the displayed range (−0.08 to −1.29). The dashed line represents the true coefficient. The simulation results are based on 100 replications.
Fig. 3
Fig. 3. Genetic nurture.
a, c Between-family analyses. b, d Within-family analyses. Data are presented as the estimated coefficients +/− 1.96 times the standard error (95% confidence interval) for the Polygenic Index (PGI) using meta-analysis (circles), Obviously Related Instrumental Variables (ORIV, rhombuses), the default PGI-RC procedure (squares), and the PGI-RC procedure, taking into account uncertainty in the GREML estimates (triangles). The top panels are for a scenario with genetic nurture but no assortative mating, and holding constant the GWAS discovery sample such that the resulting meta-analysis PGI has an R2 of 15.4%. The bottom panels are the same but now holding the discovery sample fixed at N = 16, 000. The dashed line represents the true coefficient, which is equal to 0.5 (i.e., the square root of hSNP2) in the between-family design, and equal to the square root of the direct genetic effect h2=0.2 in the within-family design. The simulation results are based on 100 replications.
Fig. 4
Fig. 4. Assortative mating.
a, c Between-family analyses. b, d Within-family analyses. Data are presented as the estimated coefficients +/− 1.96 times the standard error (95% confidence interval) for the Polygenic Index (PGI) using meta-analysis (circles), Obviously Related Instrumental Variables (ORIV, rhombuses), the default PGI-RC procedure (squares), and the PGI-RC procedure, taking into account uncertainty in the GREML estimates (triangles). The top two panels do not include genetic nurture while the bottom two panels model genetic nurture in addition to AM. The simulations hold constant the Genome-wide Association Study (GWAS) discovery sample such that the resulting meta-analysis PGI has an R2 of 15.4%, and the prediction sample size is held fixed at N = 16,000. The dashed line represents the true coefficient, which is equal to 0.5 (i.e., the square root of hSNP2) in the between-family analysis, and equal to the square root of the direct genetic effect h2=0.2 in the within-family analysis. The simulation results are based on 100 replications.
Fig. 5
Fig. 5. Genetic correlation.
Data are presented as the estimated coefficients +/− 1.96 times the standard error (95% confidence interval) for the Polygenic Index (PGI) using meta-analysis (circles), Obviously Related Instrumental Variables (ORIV, rhombuses), the default PGI-RC procedure (squares), and the PGI-RC procedure, taking into account uncertainty in the GREML estimates (triangles) in a scenario without genetic nurture, without assortative mating, and varying levels of genetic correlation between the GWAS and prediction samples (a) and between two GWAS samples that are meta-analyzed or used by ORIV (b). The simulations hold constant the Genome-wide Association Study (GWAS) discovery sample such that the resulting meta-analysis PGI has an R2 of 15.4%, and the prediction sample size is held fixed at N = 16,000. Between-family analyses only. The dashed line represents the true coefficient. The simulation results are based on 100 replications.
Fig. 6
Fig. 6. Empirically estimated SNP-based heritability.
a Educational Attainment. b Height. Data are presented as the estimated coefficients +/− 1.96 times the standard error (95% confidence interval) for the Polygenic Index (PGI) using OLS and IV regressions in terms of implied heritability estimates for a educational attainment (EA) and b height. n = 35,282 independent individuals. The implied heritability is computed on the basis of the square of the standardized coefficients (see Eq. (24)), and its standard error is obtained using the Delta method. Rest as in Table 2.

References

    1. Visscher PM, et al. 10 years of GWAS discovery: biology, function, and translation. Am. J. Hum. Genet. 2017;101:5–22. doi: 10.1016/j.ajhg.2017.06.005. - DOI - PMC - PubMed
    1. Chabris CF, Lee JJ, Cesarini D, Benjamin DJ, Laibson DI. The fourth law of behavior genetics. Curr. Dir. Psychol. Sci. 2015;24:304–312. doi: 10.1177/0963721415580430. - DOI - PMC - PubMed
    1. Janssens ACJW, et al. Predictive testing for complex diseases using multiple genes: fact or fiction? Genet. Med. 2006;8:395–400. doi: 10.1097/01.gim.0000229689.18263.f4. - DOI - PubMed
    1. Dudbridge F. Polygenic epidemiology. Gen. Epidemiol. 2016;40:268–272. doi: 10.1002/gepi.21966. - DOI - PMC - PubMed
    1. Harden KP. Reports of my death were greatly exaggerated: behavior genetics in the postgenomic era. Annu. Rev. Psychol. 2021;72:37–60. doi: 10.1146/annurev-psych-052220-103822. - DOI - PMC - PubMed

Publication types