. 2023 Aug 9;43(32):5810-5830.
doi: 10.1523/JNEUROSCI.0697-23.2023. Epub 2023 Jul 25.

Brain-Wide Projections and Differential Encoding of Prefrontal Neuronal Classes Underlying Learned and Innate Threat Avoidance

Affiliations

Brain-Wide Projections and Differential Encoding of Prefrontal Neuronal Classes Underlying Learned and Innate Threat Avoidance

Michael W Gongwer et al. J Neurosci. .

Abstract

To understand how the brain produces behavior, we must elucidate the relationships between neuronal connectivity and function. The medial prefrontal cortex (mPFC) is critical for complex functions including decision-making and mood. mPFC projection neurons collateralize extensively, but the relationships between mPFC neuronal activity and brain-wide connectivity are poorly understood. We performed whole-brain connectivity mapping and fiber photometry to better understand the mPFC circuits that control threat avoidance in male and female mice. Using tissue clearing and light sheet fluorescence microscopy (LSFM), we mapped the brain-wide axon collaterals of populations of mPFC neurons that project to nucleus accumbens (NAc), ventral tegmental area (VTA), or contralateral mPFC (cmPFC). We present DeepTraCE (deep learning-based tracing with combined enhancement), for quantifying bulk-labeled axonal projections in images of cleared tissue, and DeepCOUNT (deep-learning based counting of objects via 3D U-net pixel tagging), for quantifying cell bodies. Anatomical maps produced with DeepTraCE aligned with known axonal projection patterns and revealed class-specific topographic projections within regions. Using TRAP2 mice and DeepCOUNT, we analyzed whole-brain functional connectivity underlying threat avoidance. PL was the most highly connected node with functional connections to subsets of PL-cPL, PL-NAc, and PL-VTA target sites. Using fiber photometry, we found that during threat avoidance, cmPFC and NAc-projectors encoded conditioned stimuli, but only when action was required to avoid threats. mPFC-VTA neurons encoded learned but not innate avoidance behaviors. Together our results present new and optimized approaches for quantitative whole-brain analysis and indicate that anatomically defined classes of mPFC neurons have specialized roles in threat avoidance.SIGNIFICANCE STATEMENT Understanding how the brain produces complex behaviors requires detailed knowledge of the relationships between neuronal connectivity and function. The medial prefrontal cortex (mPFC) plays a key role in learning, mood, and decision-making, including evaluating and responding to threats. mPFC dysfunction is strongly linked to fear, anxiety and mood disorders. Although mPFC circuits are clear therapeutic targets, gaps in our understanding of how they produce cognitive and emotional behaviors prevent us from designing effective interventions. To address this, we developed a high-throughput analysis pipeline for quantifying bulk-labeled fluorescent axons [DeepTraCE (deep learning-based tracing with combined enhancement)] or cell bodies [DeepCOUNT (deep-learning based counting of objects via 3D U-net pixel tagging)] in intact cleared brains. Using DeepTraCE, DeepCOUNT, and fiber photometry, we performed detailed anatomic and functional mapping of mPFC neuronal classes, identifying specialized roles in threat avoidance.

Keywords: axon; deep learning; light sheet microscopy; prefrontal cortex; threat avoidance; tissue clearing.


Figures

Figure 1.
Figure 1.
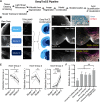
DeepTraCE workflow. A, Overview of DeepTraCE workflow. B, Demonstration of segmentation using three different models followed by model combination. C, Example of human-labeled axons and artifacts for model training. D, Overlay of raw data and axon segmentation using single model or DeepTraCE concatenated models. E, Distinction score produced by models 1, 2, and 3 for images from regions assigned to axon groups 1, 2, and 3. Repeated-measures one-way ANOVA with Benjamini, Krieger, and Yekutieli post hoc test (FDR = 0.05; group 1: F(1.4,5.5) = 8.503, p = 0.0257; group 2: F(1.4,7.8) = 7.753, p = 0.0309; group 3: F(1.2,6.1) = 73.76, p = 0.0001). F, Comparison of DeepTraCE with alternate segmentation and model combination strategies. Repeated measures one-way ANOVA with Benjamini, Krieger, and Yekutieli post hoc test (FDR = 0.05; F(2,33) = 14.46, p < 0.0001). See Extended Data Figure 1-1 for detailed statistics. Scale bars, 200 μm. Descriptive statistics: mean ± SEM; *p < 0.05, **p < 0.01, ***p < 0.001. Distinction score: (LP − LN)/(LN + (1 − LP)). LP = axon+ human label. LN = axon− human label.
Figure 2.
Figure 2.
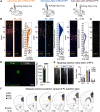
Validation of Cre-dependent virus and injection site mapping. A, Viral injection strategy for targeting projection-defined PL neurons. B, Layer distributions of PL neurons retrogradely labeled via injections of AAVrg, AAVrg+AAV8, CTB-594, CTB-647, and AAVrg-EGFP in cPL, NAc, and VTA, respectively (cPL: Ftracer(2,6) = 4.76, p = 0.06; Fbin(2.5,15.3) = 20.04, p < 0.0001, n = 3/group; NAc: Ftracer(2,6) = 0.52, p = 0.62; Fbin(1.1,6.7) = 4.54, p = 0.07, n = 3/group; VTA: Ftracer(1,4) = 203.6, p = 0.0001; Fbin(1.7,6.8) = 4.28, p = 0.07, n = 3/group two-way ANOVA). Scale bars, 100 μm. C, Representative stain of layer marker CTIP2 in PL. Scale bars, 100 μm. D, Representative coronal sections of brains injected with AAVrg-Cre and AAV-DIO-ChR2-EYFP (left) or AAV-DIO-ChR2-EYFP in the absence of Cre and quantification of fluorescence in PL. E, Raw fluorescence images from LSFM showing mPFC injection sites for PL-cPL, PL-NAc, and PL-VTA collateral mapping experiments. Quantifications show fraction of fluorescently labeled cells detected in ACC, PL, and IL (each dot represent 1 mouse, n = 4 mice per group). F, Maps of fluorescently labeled cell bodies across the anterior-posterior axis of mPFC for each cell class. Error bars, mean ± SEM, ****p < 0.001, Student's t test. See Extended Data Figure 2-1 for quantification of layer limits.
Figure 3.
Figure 3.
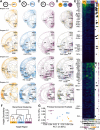
Visualization and quantification of brain-wide projection patterns of mPFC. A–C, DeepTraCE segmentation of single 10-μm coronal optical sections of thinned axons registered to the standardized brain atlas. Each image represents four overlaid brains from each neuronal class. D, Dotogram overlay of three cell classes. Innvervation by cPL-projecting, NAc-projecting, and VTA-projecting PL neurons shown in yellow, blue, and purple, respectively. E, Left heatmap, Relative labeling density (normalized to region volume and gross label content per brain) across 140 regions defined by the Allen Brain Atlas. Middle heatmap, p values from multiple comparisons of axon innervation density. Right heatmap, Loadings for principal component (PC) 1 (arbitrary weight units). F, Dendrogram of hierarchical clustering of regional axon quantifications from 12 mice, colored by target region. G, Locations of individual mice projected in PC space defined by the first two PCs (arbitrary PC units, cPL, n = 4; NAc, n = 4; VTA, n = 4). See Extended Data Figures 1-1, 3-1, and 3-2 and Movie 1 for detailed statistics, abbreviations, and related data.
Figure 4.
Figure 4.
Region-specific collateralization patterns of PL-cPL, PL-NAc, and PL-VTA neurons. A, Coronal view of 100-μm z-projections of raw 640-nm (axons, white) and 488-nm (autofluorescence, blue) channels from individual brains. Images show class-specific innervation patterns in anterior (left) and posterior (right) cortical areas. B, Layer distributions of axonal innervation in select cortical regions. C, Visualizations of axonal innervation density along the anterior-posterior axis in select regions. D, Raw images showing axons in the amygdalar complex. E, Quantification of axonal innervation density along the anterior-posterior axis of a given region. PL-cPL, PL-NAc, and PL-VTA neurons coded in yellow, blue, and purple, respectively. N = 4/group. Descriptive statistics are from two-way ANOVA with Tukey's post hoc multiple comparison test. See Extended Data Figures 1-1 and 3-1 for detailed statistics and abbreviations. Error bars: mean ± SEM; *p < 0.05, **p < 0.01. Scale bars, 200 µm.
Figure 5.
Figure 5.
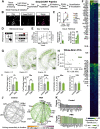
Whole-brain IEG mapping of learned avoidance with DeepCOUNT. A, Overview of DeepCOUNT workflow. B, Overlay of raw data and cell segmentation using trained cell detection model. C, Comparison of residual error values for DeepCOUNT and ClearMap as compared with human annotations (p = 0.022, n = 6 brain regions; paired t test). D, Overview of platform-mediated avoidance assay. TRAP2;Ai14 mice were trained in PMA on day (D)1 and then TRAPed during a retrieval test on D2. E, Fraction of successful trials increased (F = 5.67, p = 0.012, n = 4, one-way ANOVA) and latency to enter the platform decreased (F = 7.21, p = 0.005, n = 4, one-way ANOVA) across training. On retrieval day, mice entered the platform with an average latency of 7.9 s after tone onset and were more likely to be on the platform at the end of the tone compared with pretraining (p = 0.0005, n = 4, paired t test). F, Left heatmap, Relative cell density (normalized to region volume and gross label content per brain) across 140 regions defined by the Allen Brain Atlas. Right heatmap, Loadings for PC1 (arbitrary PC weight units). G, Dotogram overlay of control (gray) and PMA (green) conditions. Dots represent the density of TRAPed cells in a given voxel. H, Locations of individual mice projected in principal component (PC) space defined by the first two PCs (arbitrary PC units, control, n = 5; PMA, n = 4). I, Comparison of TRAPed cell density in five brain regions of naive controls (gray) and PMA-trained mice (green; Student's t test; *p < 0.05, **p < 0.01; control: n = 5; PMA: n = 4). J, Network diagrams for control (left) and PMA-trained (right) mice based on brain-wide interregional correlations. Node size is proportional to degree and lines represent above-threshold correlations. K, Degree values for top 20 most connected regions for each condition (PL outlined in red). See Extended Data Figure 5-1 for detailed statistics and abbreviations. Error bars, mean ± SEM.
Figure 6.
Figure 6.
Neuronal class-specific activity during threat cues. A, AAV injection strategy. Left, To target cPL-projecting neurons, mice were injected with AAVrg-Cre in cPL, AAVrg-Flp in NAc, and Con-Foff-GCaMP6M in PL. Middle, To target NAc-projecting neurons, mice were injected with AAVrg-Flp in cPL, AAVrg-Cre in NAc, and Con-Foff-GCaMP6M in PL. Right, To target VTA-projecting neurons, mice were injected with AAVrg-Cre in VTA and DIO-GCaMP6M in PL. B, Representative images of GCaMP expression and fiber placement sites in PL. Scale bar, 1 mm. C, Distribution of cPL-projecting, NAc-projecting, and VTA-projecting GCaMP-expressing cells across cortical layers (Fbin(4,54) = 28.3, p < 0.0001, Fbinxclass(36,234) = 34.09, p < 0.0001; cPL: n = 6, NAc: n = 5, VTA: n = 6; two-way ANOVA). D, Representative images of axon terminals in cPL and NAc using the intersectional viral targeting strategy shown in A. Scale bars, 100 μm. E, Schematic of PMA assay and behavioral performance across sessions. Fraction successful trials: Fday(2,24) = 65.18, p < 0.0001, Fclass(2,14) = 0.58, p = 0.57, Fclass x day(6,36) = 0.43, p = 0.86, two-way ANOVA. Latency to enter platform: Fday(3,36) = 14.27, p < 0.0001, Fclass(2,14) = 0.09,038, p = 0.91, Fclass x day(6,36) = 0.48, p = 0.82, two-way ANOVA. F, GCaMP fluorescence in cPL-projecting, NAc-projecting, and VTA-projecting neurons. Signals are aligned to tone onset and separated by whether mouse is on (colored trace) or off (gray trace) the safety platform at the start of the tone. *p < 0.05 for Student's t test comparing on versus off platform activity in a given time window. G, AUC analysis of Ca2+ signal for tone periods (0–10 s) when mice were off the platform (F(2,14) = 4.106, p = 0.04, cPL: n = 6, NAc: n = 5, VTA: n = 6; one-way ANOVA with Tukey's post hoc test. H, Correlation between AUC during off-platform tone periods (0–10 s) and average latency for a mouse to enter the platform. Error bars, mean ± SEM.
Figure 7.
Figure 7.
Neuronal class-specific activity during aversive stimuli. A, GCaMP fluorescence in cPL-projecting, NAc-projecting, and VTA-projecting PL cells. Signals are aligned to shock onset and separated by whether mouse is on (colored trace) or off (gray trace) the safety platform during the shock period. *p < 0.05, **p < 0.01 for Student's t test comparing on versus off platform activity in a given time window. Analysis of Ca2+ signals for circa-shock periods: (B) preshock AUC: F(2,14) = 6.97, p = 0.0079; (C) shock peak Z-score: F(2,14) = 1.87, p = 0.19; (D) postshock AUC (10–40 s): F(2,14) = 8.28, p = 0.0042; (E) postshock AUC (60–80 s): F(2,14) = 8.79, p = 0.0034. For B–E, cPL: n = 6, NAc: n = 5, VTA: n = 6, one-way ANOVA with Tukey's post hoc test, *p < 0.05, **p < 0.01. Error bars, mean ± SEM.
Figure 8.
Figure 8.
Neuronal class-specific activity during learned versus innate threat avoidance behavior. A, B, GCaMP fluorescence aligned to safe-zone entry in learned (A) versus innate (B) avoidance for cPL-projecting (yellow), NAc-projecting (blue), and VTA-projecting (purple) neurons. Inset plots show AUC analysis of Ca2+ signal aligned to avoidance (−5–5 s). A, Platform entry AUC increases between training day (D)1 and D2/3 across cell types (PMA: Fday(1,14) = 17.59, p = 0.0009, Fclass(2,14) = 1.488, p = 0.26, Fclass x day(2,14) = 0.98, p = 0.40, two-way ANOVA). B, EZM: F(2,9) = 6.11, p = 0.02; one-way ANOVA with Tukey's post hoc test. C, D, GCaMP fluorescence aligned to onset of risky exploration in learned (C) versus innate (D) avoidance for cPL-projecting (yellow), NAc-projecting (blue), and VTA-projecting (purple) neurons. Inset plots show AUC analysis of Ca2+ signal aligned to exploration onset (0–20 s; PMA: F(2,14) = 2.43, p = 0.12; EPM: F(2,9) = 11.97, p = 0.0029, one-way ANOVA with Tukey's post hoc test). E, Analysis of Ca2+ signals during head dips (F(2,10) = 0.64, p = 0.55; one-way ANOVA with Tukey's post hoc test). **p < 0.01, ***p < 0.001. Error bars, mean ± SEM PMA: cPL n = 6, NAc n = 5, VTA n = 6; EZM: cPL n = 5, NAc n = 4, VTA n = 3.
Figure 9.
Figure 9.
Correlation of neural activity and BLA axon collateralization in PL-cPL and PL-NAc populations. A, Representative images of GCaMP+ axons in BLA of animals with low and high off-platform tone responses. B, BLA axon fluorescence intensity is correlated with off-platform tone response (AUC: 0–4 s). cPL n = 6, NAc n = 5. Simple linear regression. C, BLA axon fluorescence intensity is not correlated with platform entry responses on day 2/3 (AUC: −5–5 s; PL-NAc: R2 = 0.38, p = 0.27; PL-cPL: R2 = 0.003, p = 0.92) or platform exit responses (AUC: 0–20 s; PL-NAc: R2 = 0.02, p = 0.82; PL-cPL: R2 = 0.35, p = 0.21). cPL n = 6, NAc n = 5. Simple linear regression.
Figure 10.
Figure 10.
Summary of findings. A, Visualization of collateralization density in key targets of PL-cPL, PL-NAc, and PL-VTA neurons. Dot radius correlates with average normalized labeling density within a region. B, Schematic of whole-brain collateralization patterns of PL-cPL, PL-NAc, and PL-VTA neurons. C, Summary of PL efferent connectivity patterns. D, Visualization of activity levels in PL-cPL, PL-NAc, and PL-VTA neurons during aspects of threat avoidance. Dot radius correlates with average normalized signal intensity. See Extended Data Figure 3-1 for abbreviations.

References

    1. Allen WE, DeNardo LA, Chen MZ, Liu CD, Loh KM, Fenno LE, Ramakrishnan C, Deisseroth K, Luo L (2017) Thirst-associated preoptic neurons encode an aversive motivational drive. Science 357:1149–1155. 10.1126/science.aan6747 - DOI - PMC - PubMed
    1. Anastasiades PG, Carter AG (2021) Circuit organization of the rodent medial prefrontal cortex. Trends Neurosci 44:550–563. 10.1016/j.tins.2021.03.006 - DOI - PMC - PubMed
    1. Anastasiades PG, Boada C, Carter AG (2019) Cell-type-specific D1 dopamine receptor modulation of projection neurons and interneurons in the prefrontal cortex. Cereb Cortex 29:3224–3242. 10.1093/cercor/bhy299 - DOI - PMC - PubMed
    1. Arlotta P, Molyneaux BJ, Chen J, Inoue J, Kominami R, Macklis JD (2005) Neuronal subtype-specific genes that control corticospinal motor neuron development in vivo. Neuron 45:207–221. 10.1016/j.neuron.2004.12.036 - DOI - PubMed
    1. Arruda-Carvalho M, Clem RL (2014) Pathway-selective adjustment of prefrontal-amygdala transmission during fear encoding. J Neurosci 34:15601–15609. 10.1523/JNEUROSCI.2664-14.2014 - DOI - PMC - PubMed

Publication types

LinkOut - more resources