Observational Study
. 2023 Sep 5;101(10):e1069-e1082.
doi: 10.1212/WNL.0000000000207581. Epub 2023 Jul 25.

Clinical Value of Longitudinal Serum Neurofilament Light Chain in Prodromal Genetic Frontotemporal Dementia

Affiliations
Observational Study

Clinical Value of Longitudinal Serum Neurofilament Light Chain in Prodromal Genetic Frontotemporal Dementia

Lucia A A Giannini et al. Neurology. .

Abstract

Background and objectives: Elevated serum neurofilament light chain (NfL) is used to identify carriers of genetic frontotemporal dementia (FTD) pathogenic variants approaching prodromal conversion. Yet, the magnitude and timeline of NfL increase are still unclear. Here, we investigated the predictive and early diagnostic value of longitudinal serum NfL for the prodromal conversion in genetic FTD.

Methods: In a longitudinal observational cohort study of genetic FTD pathogenic variant carriers, we examined the diagnostic accuracy and conversion risk associated with cross-sectional and longitudinal NfL. Time periods relative to prodromal conversion (>3, 3-1.5, 1.5-0 years before; 0-1.5 years after) were compared with values of participants who did not convert. Next, we modeled longitudinal NfL and MRI volume trajectories to determine their timeline.

Results: We included 21 participants who converted (5 chromosome 9 open-reading frame 72 [C9orf72], 10 progranulin [GRN], 5 microtubule-associated protein tau [MAPT], and 1 TAR DNA-binding protein [TARDBP]) and 61 who did not (20 C9orf72, 30 GRN, and 11 MAPT). Participants who converted had higher NfL levels at all examined periods before prodromal conversion (median values 14.0-18.2 pg/mL; betas = 0.4-0.7, standard error [SE] = 0.1, p < 0.046) than those who did not (6.5 pg/mL) and showed further increase 0-1.5 years after conversion (28.4 pg/mL; beta = 1.0, SE = 0.1, p < 0.001). Annualized longitudinal NfL change was only significantly higher in participants who converted (vs. participants who did not) 0-1.5 years after conversion (beta = 1.2, SE = 0.3, p = 0.001). Diagnostic accuracy of cross-sectional NfL for prodromal conversion (vs. nonconversion) was good-to-excellent at time periods before conversion (area under the curve range: 0.72-0.92), improved 0-1.5 years after conversion (0.94-0.97), and outperformed annualized longitudinal change (0.76-0.84). NfL increase in participants who converted occurred earlier than frontotemporal MRI volume change and differed by genetic group and clinical phenotypes. Higher NfL corresponded to increased conversion risk (hazard ratio: cross-sectional = 6.7 [95% CI 3.3-13.7]; longitudinal = 13.0 [95% CI 4.0-42.8]; p < 0.001), but conversion-free follow-up time varied greatly across participants.

Discussion: NfL increase discriminates individuals who convert to prodromal FTD from those who do not, preceding significant frontotemporal MRI volume loss. However, NfL alone is limited in predicting the exact timing of prodromal conversion. NfL levels also vary depending on underlying variant-carrying genes and clinical phenotypes. These findings help to guide participant recruitment for clinical trials targeting prodromal genetic FTD.


Figures

Figure 1
Figure 1. Longitudinal NfL Raw Levels and z-Scores in the Entire Cohort
Plots show the longitudinal trajectories of log-transformed NfL raw levels (A) and z-scores (B) along time to prodromal conversion (years) for participants who converted and along follow-up time (years) for participants who did not. The black dashed line indicates the time of prodromal conversion in the group of participants who converted. The colored areas in the plot indicate the time periods of interest for our cross-sectional analyses: >3 years before conversion (white), 3–1.5 years before conversion (light yellow), 1.5–0 years before conversion (yellow), and 0–1.5 years after conversion (orange). NfL = neurofilament light chain.
Figure 2
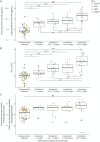
Figure 2. Cross-sectional NfL Raw Levels, z-Scores, and Annualized Longitudinal Change at Time Periods Relative to Conversion
Boxplots depict cross-sectional comparisons of NfL raw levels (A), z-scores, (B) and annualized change (C) at time periods relative to conversion. Data points are color-coded by mutated FTD gene. For both NfL raw levels and z-scores, participants who converted at all time periods differed significantly from reference values of those who did not. For annualized change, participants who converted 0–1.5 years after conversion differed significantly from reference values of those who did not. ***p < 0.001, **p < 0.01, *p < 0.05; statistical outcomes from a linear mixed-effects model with individuals as random intercept, time period as main predictor, and age at sample and gender as covariates. Tukey correction for multiple comparisons was applied. FTD = frontotemporal dementia; NfL = neurofilament light chain.
Figure 3
Figure 3. Linear Mixed Modeling Effects Plot Showing Predicted Longitudinal NfL and MRI Frontal/Temporal Volume Trajectories in Participants Who Converted vs Those Who Did Not
Effects plot from linear mixed modeling shows predicted longitudinal trajectories of (A) NfL z-scores, (B) frontal volume w-scores and (C) temporal volume w-scores for participants who converted vs participants who did not along participant age. For each group, estimates within 90% of the original data distribution (5th-95th quantile) for participant age are portrayed. Of these 3 markers, NfL showed the earliest relative difference in longitudinal trajectory between participants who converted and those who did not, evidenced by the predicted difference in NfL levels greater than zero already around 40 years of age, further increasing in the following years (D). NfL = neurofilament light chain.
Figure 4
Figure 4. Linear Mixed Modeling Effects Plot Showing Predicted Longitudinal NfL Trajectories in Participants Who Converted of Different FTD Gene Groups
Effects plot from linear mixed modeling shows (A) the predicted longitudinal trajectories of NfL z-scores in different FTD gene groups in participants who converted along time to prodromal conversion (modeled nonlinearly) and (B) a subanalysis in the C9orf72 group excluding 2 participants with a motor phenotype (1 ALS, 1 FTD-ALS). The black dashed line indicates the time of prodromal conversion. NfL longitudinal trajectories of participants who converted showed a different course depending on FTD gene group (p = 0.001). FTD = frontotemporal dementia; NfL = neurofilament light chain.
Figure 5
Figure 5. Individual Longitudinal Trajectories of NfL z-Scores per Gene Group
Plots show longitudinal NfL z-scores trajectories in each gene group along time to prodromal conversion (years) for participants who converted and along follow-up time (years) for participants who did not. The black dashed line indicates the time of prodromal conversion in the group of participants who converted. The red dashed line indicates the 0.7 cutoff having optimal diagnostic accuracy 0–1.5 years after conversion to distinguish participants who converted from those who did not (AUC 0.94). The orange-colored area signals the time period of 0–1.5 years after conversion. Data points are shape-coded for clinical state (presymptomatic vs prodromal vs fully symptomatic) and color-coded for the profile of most prominent clinical symptomatology. NfL = neurofilament light chain.

Comment in

References

    1. Meeter LH, Kaat LD, Rohrer JD, van Swieten JC. Imaging and fluid biomarkers in frontotemporal dementia. Nat Rev Neurol. 2017;13(7):406-419. doi: 10.1038/nrneurol.2017.75 - DOI - PubMed
    1. Rascovsky K, Hodges JR, Knopman D, et al. Sensitivity of revised diagnostic criteria for the behavioural variant of frontotemporal dementia. Brain. 2011;134(9):2456-2477. doi: 10.1093/brain/awr179 - DOI - PMC - PubMed
    1. Gorno-Tempini ML, Hillis AE, Weintraub S, et al. Classification of primary progressive aphasia and its variants. Neurology. 2011;76(11):1006-1014. doi: 10.1212/wnl.0b013e31821103e6 - DOI - PMC - PubMed
    1. Greaves CV, Rohrer JD. An update on genetic frontotemporal dementia. J Neurol. 2019;266(8):2075-2086. doi: 10.1007/s00415-019-09363-4 - DOI - PMC - PubMed
    1. Moore KM, Nicholas J, Grossman M, et al. Age at symptom onset and death and disease duration in genetic frontotemporal dementia: an international retrospective cohort study. Lancet Neurol. 2020;19(2):145-156. doi: 10.1016/s1474-4422(19)30394-1 - DOI - PMC - PubMed

Publication types