. 2023 Aug 23;10(8):ENEURO.0147-23.2023.
doi: 10.1523/ENEURO.0147-23.2023. Print 2023 Aug.

Single-Nucleus Profiling Identifies Accelerated Oligodendrocyte Precursor Cell Senescence in a Mouse Model of Down Syndrome

Affiliations

Single-Nucleus Profiling Identifies Accelerated Oligodendrocyte Precursor Cell Senescence in a Mouse Model of Down Syndrome

Bianca Rusu et al. eNeuro. .

Abstract

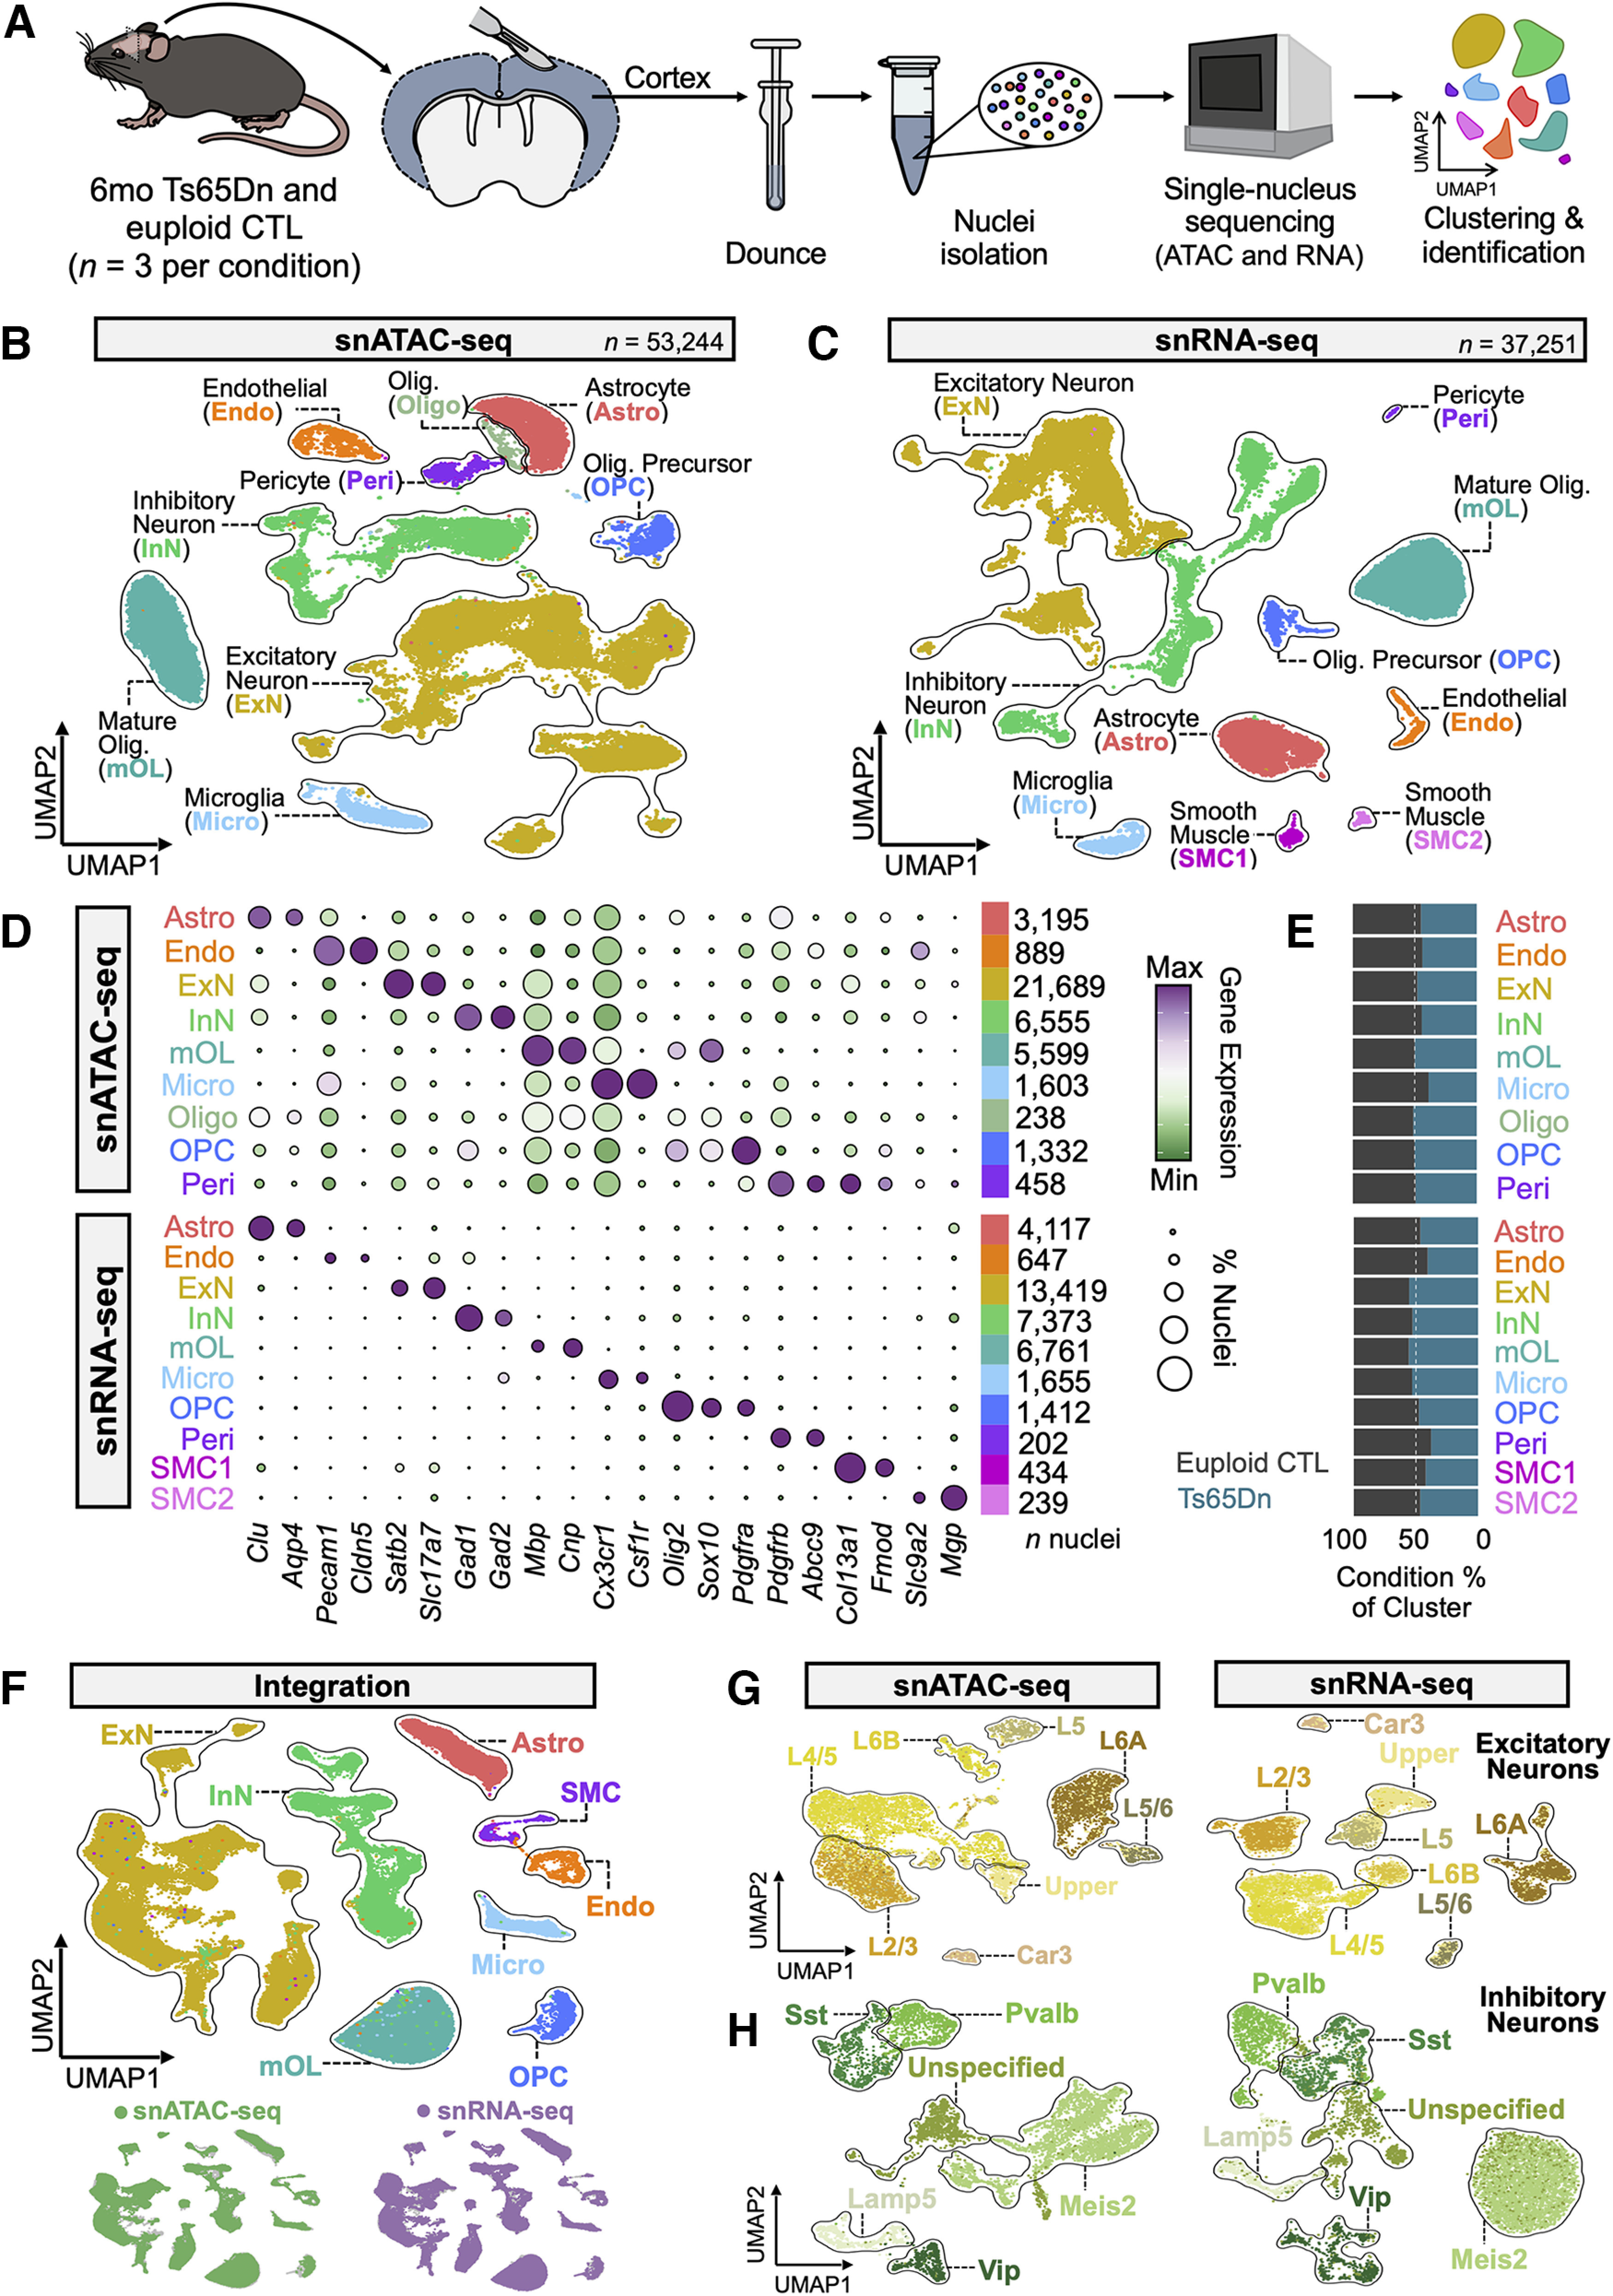
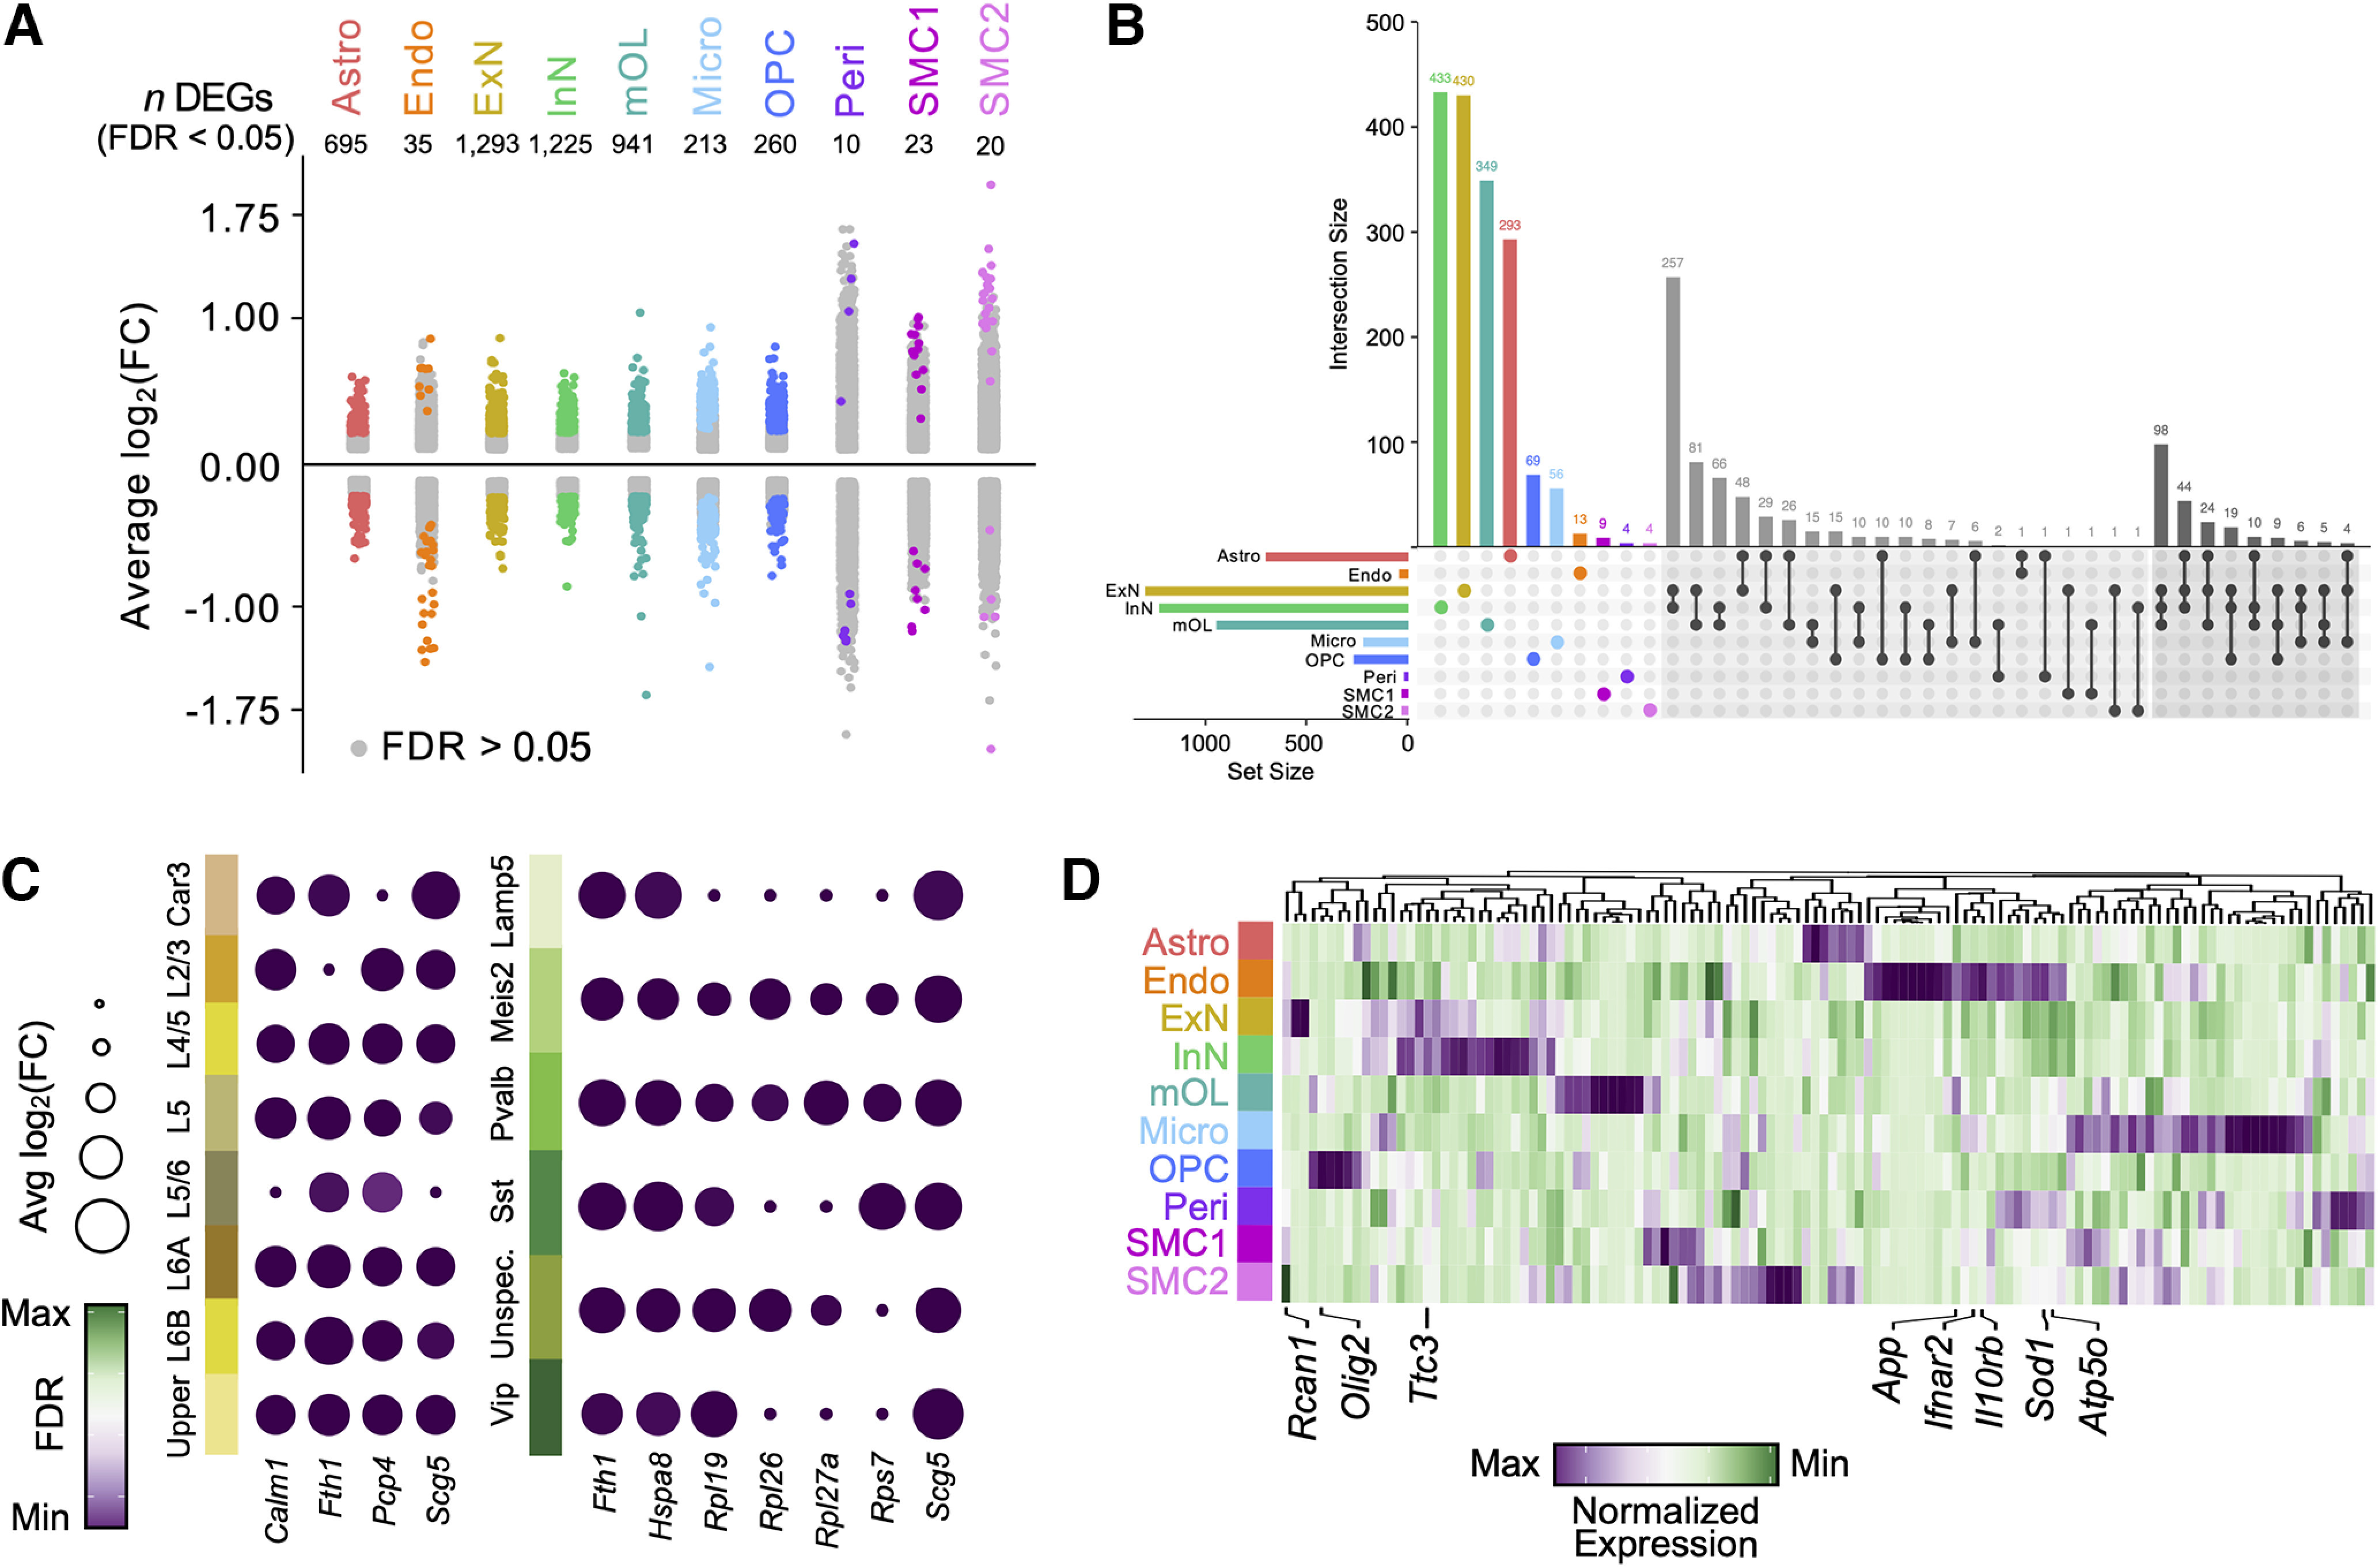
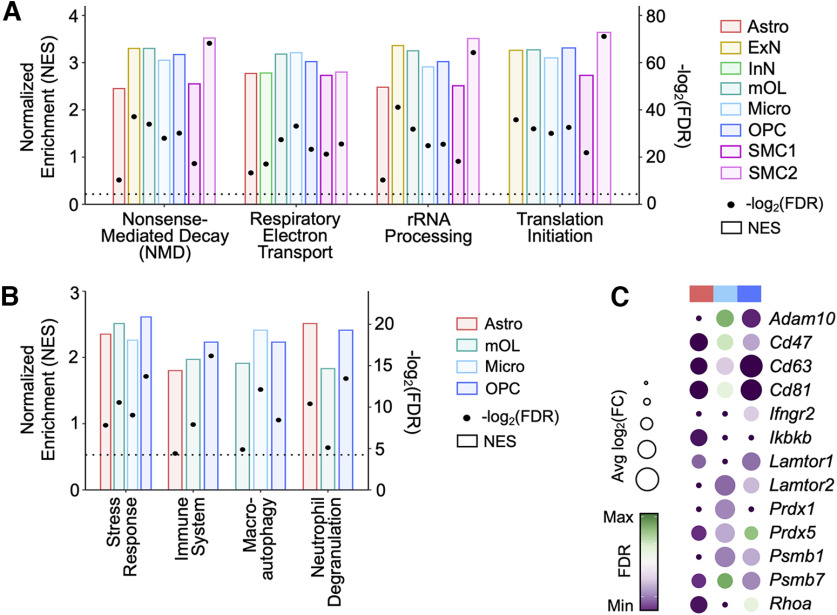
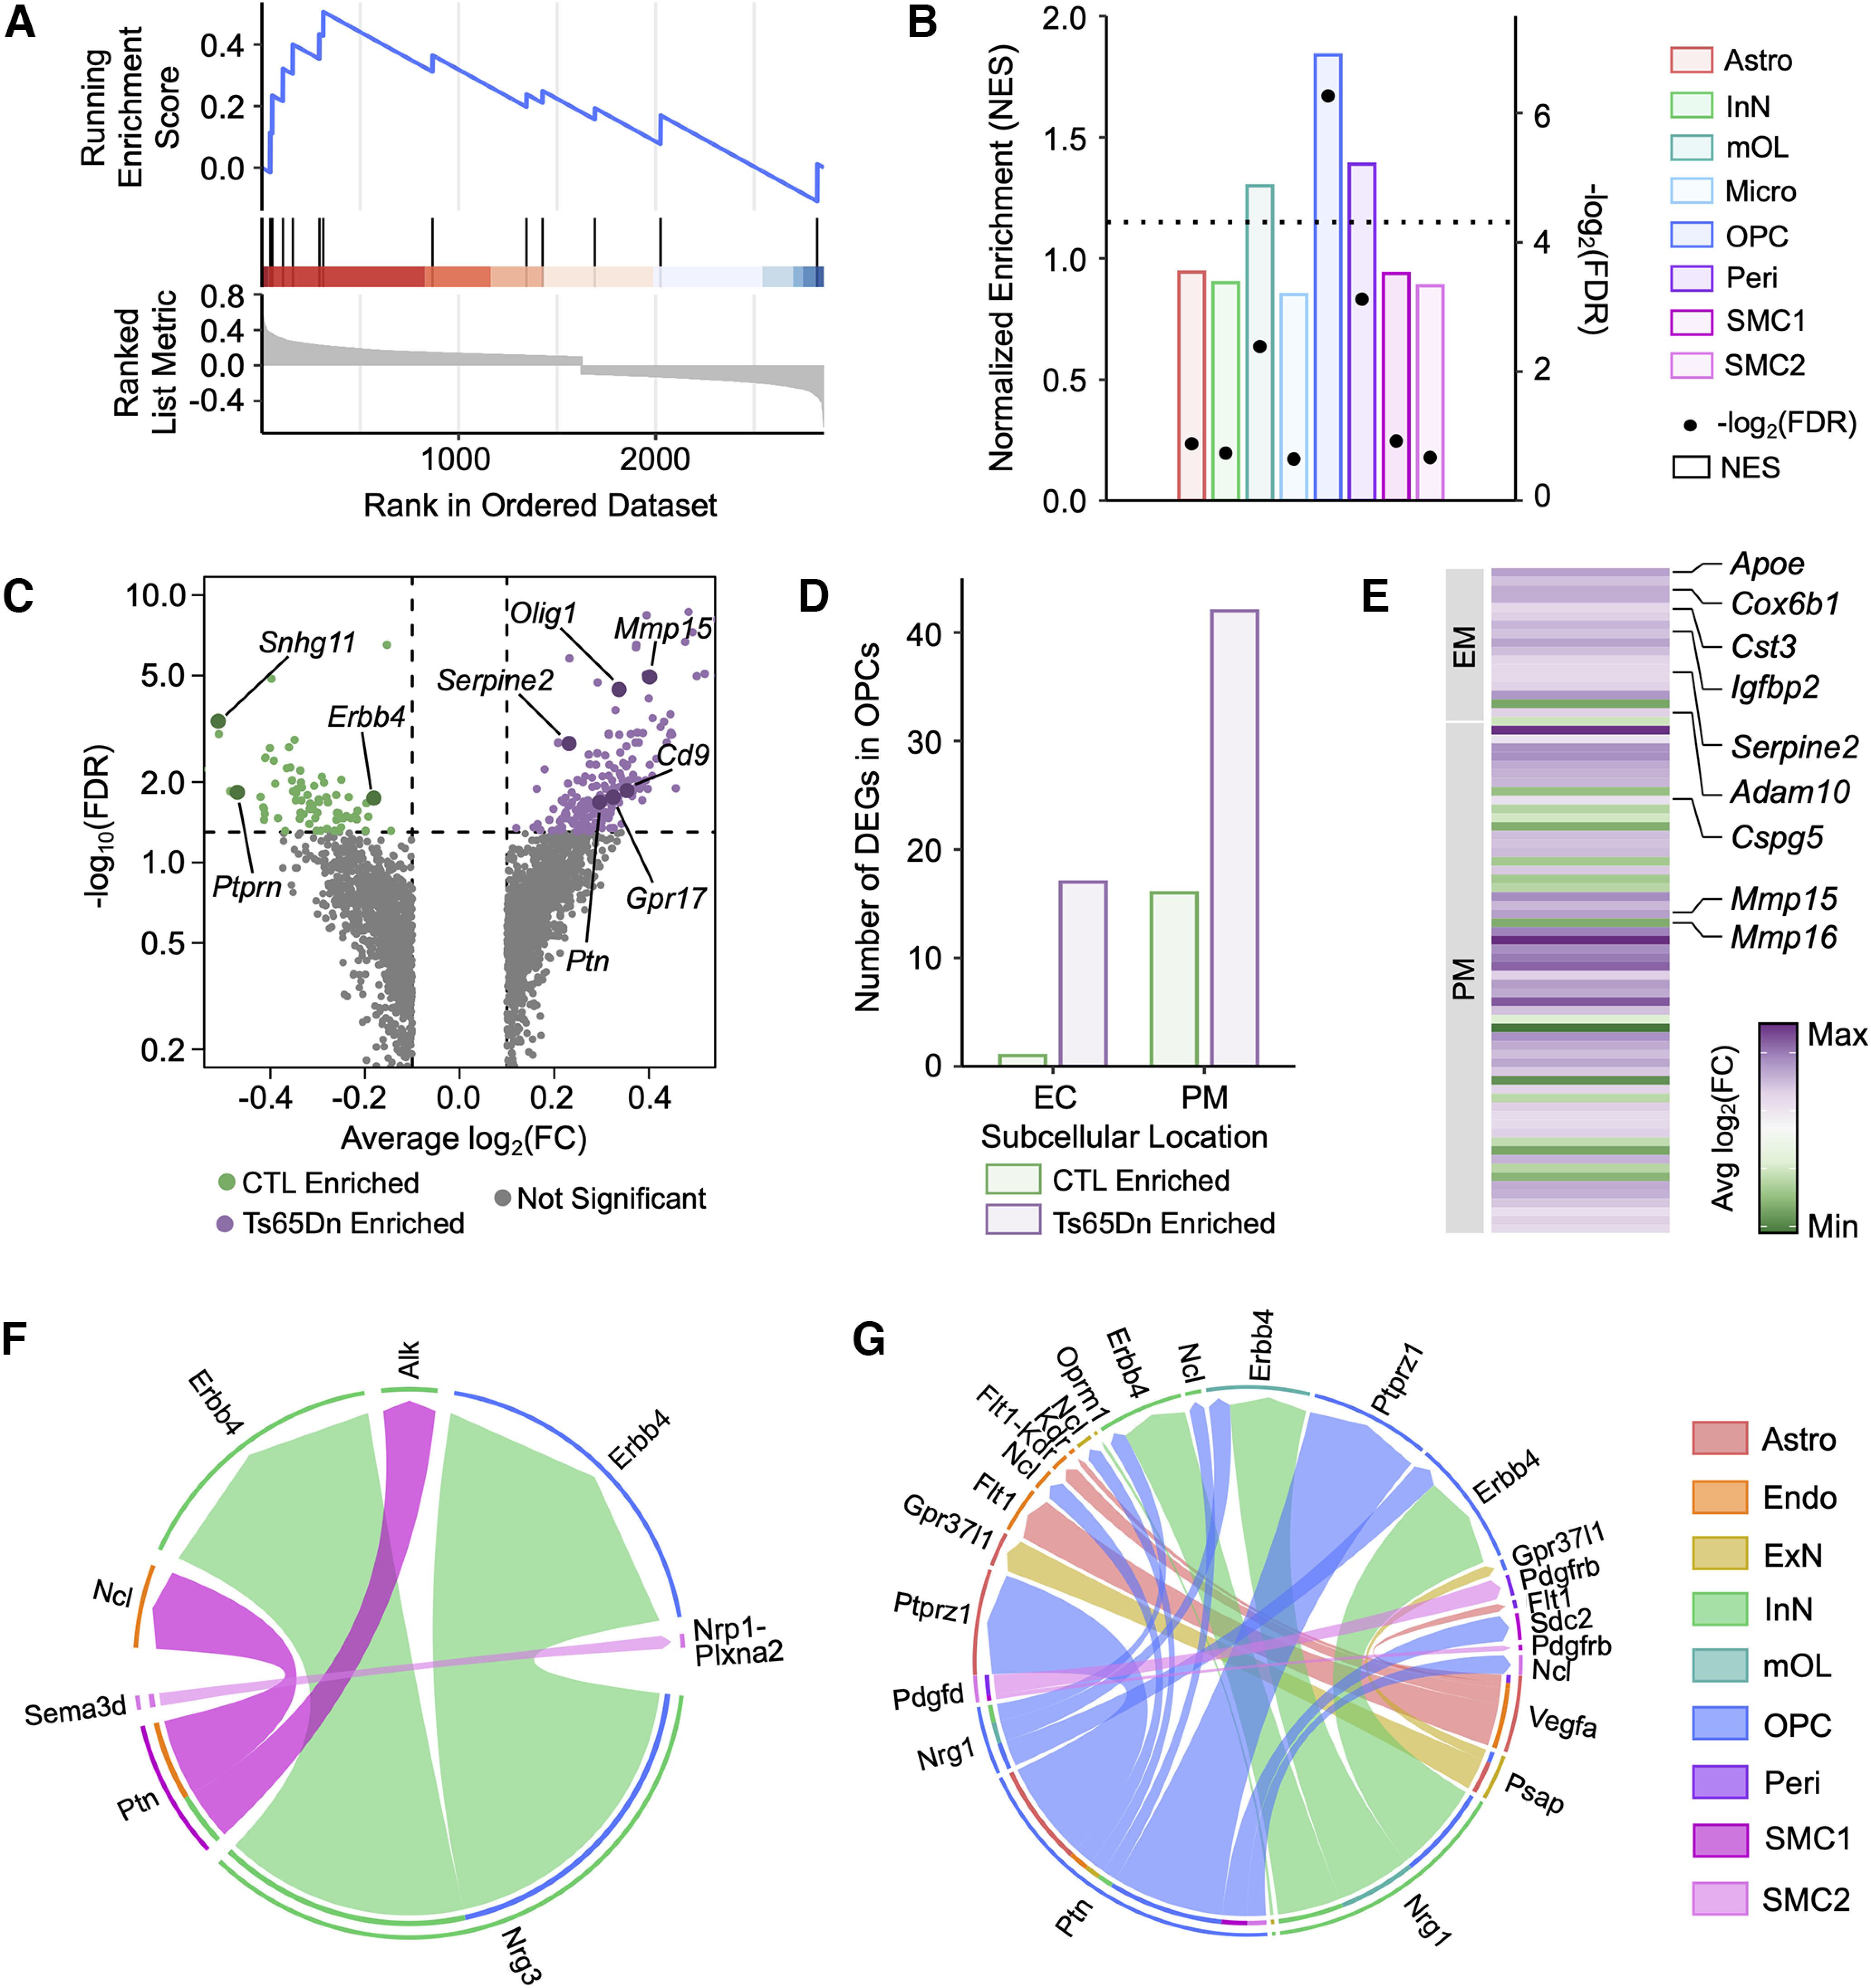
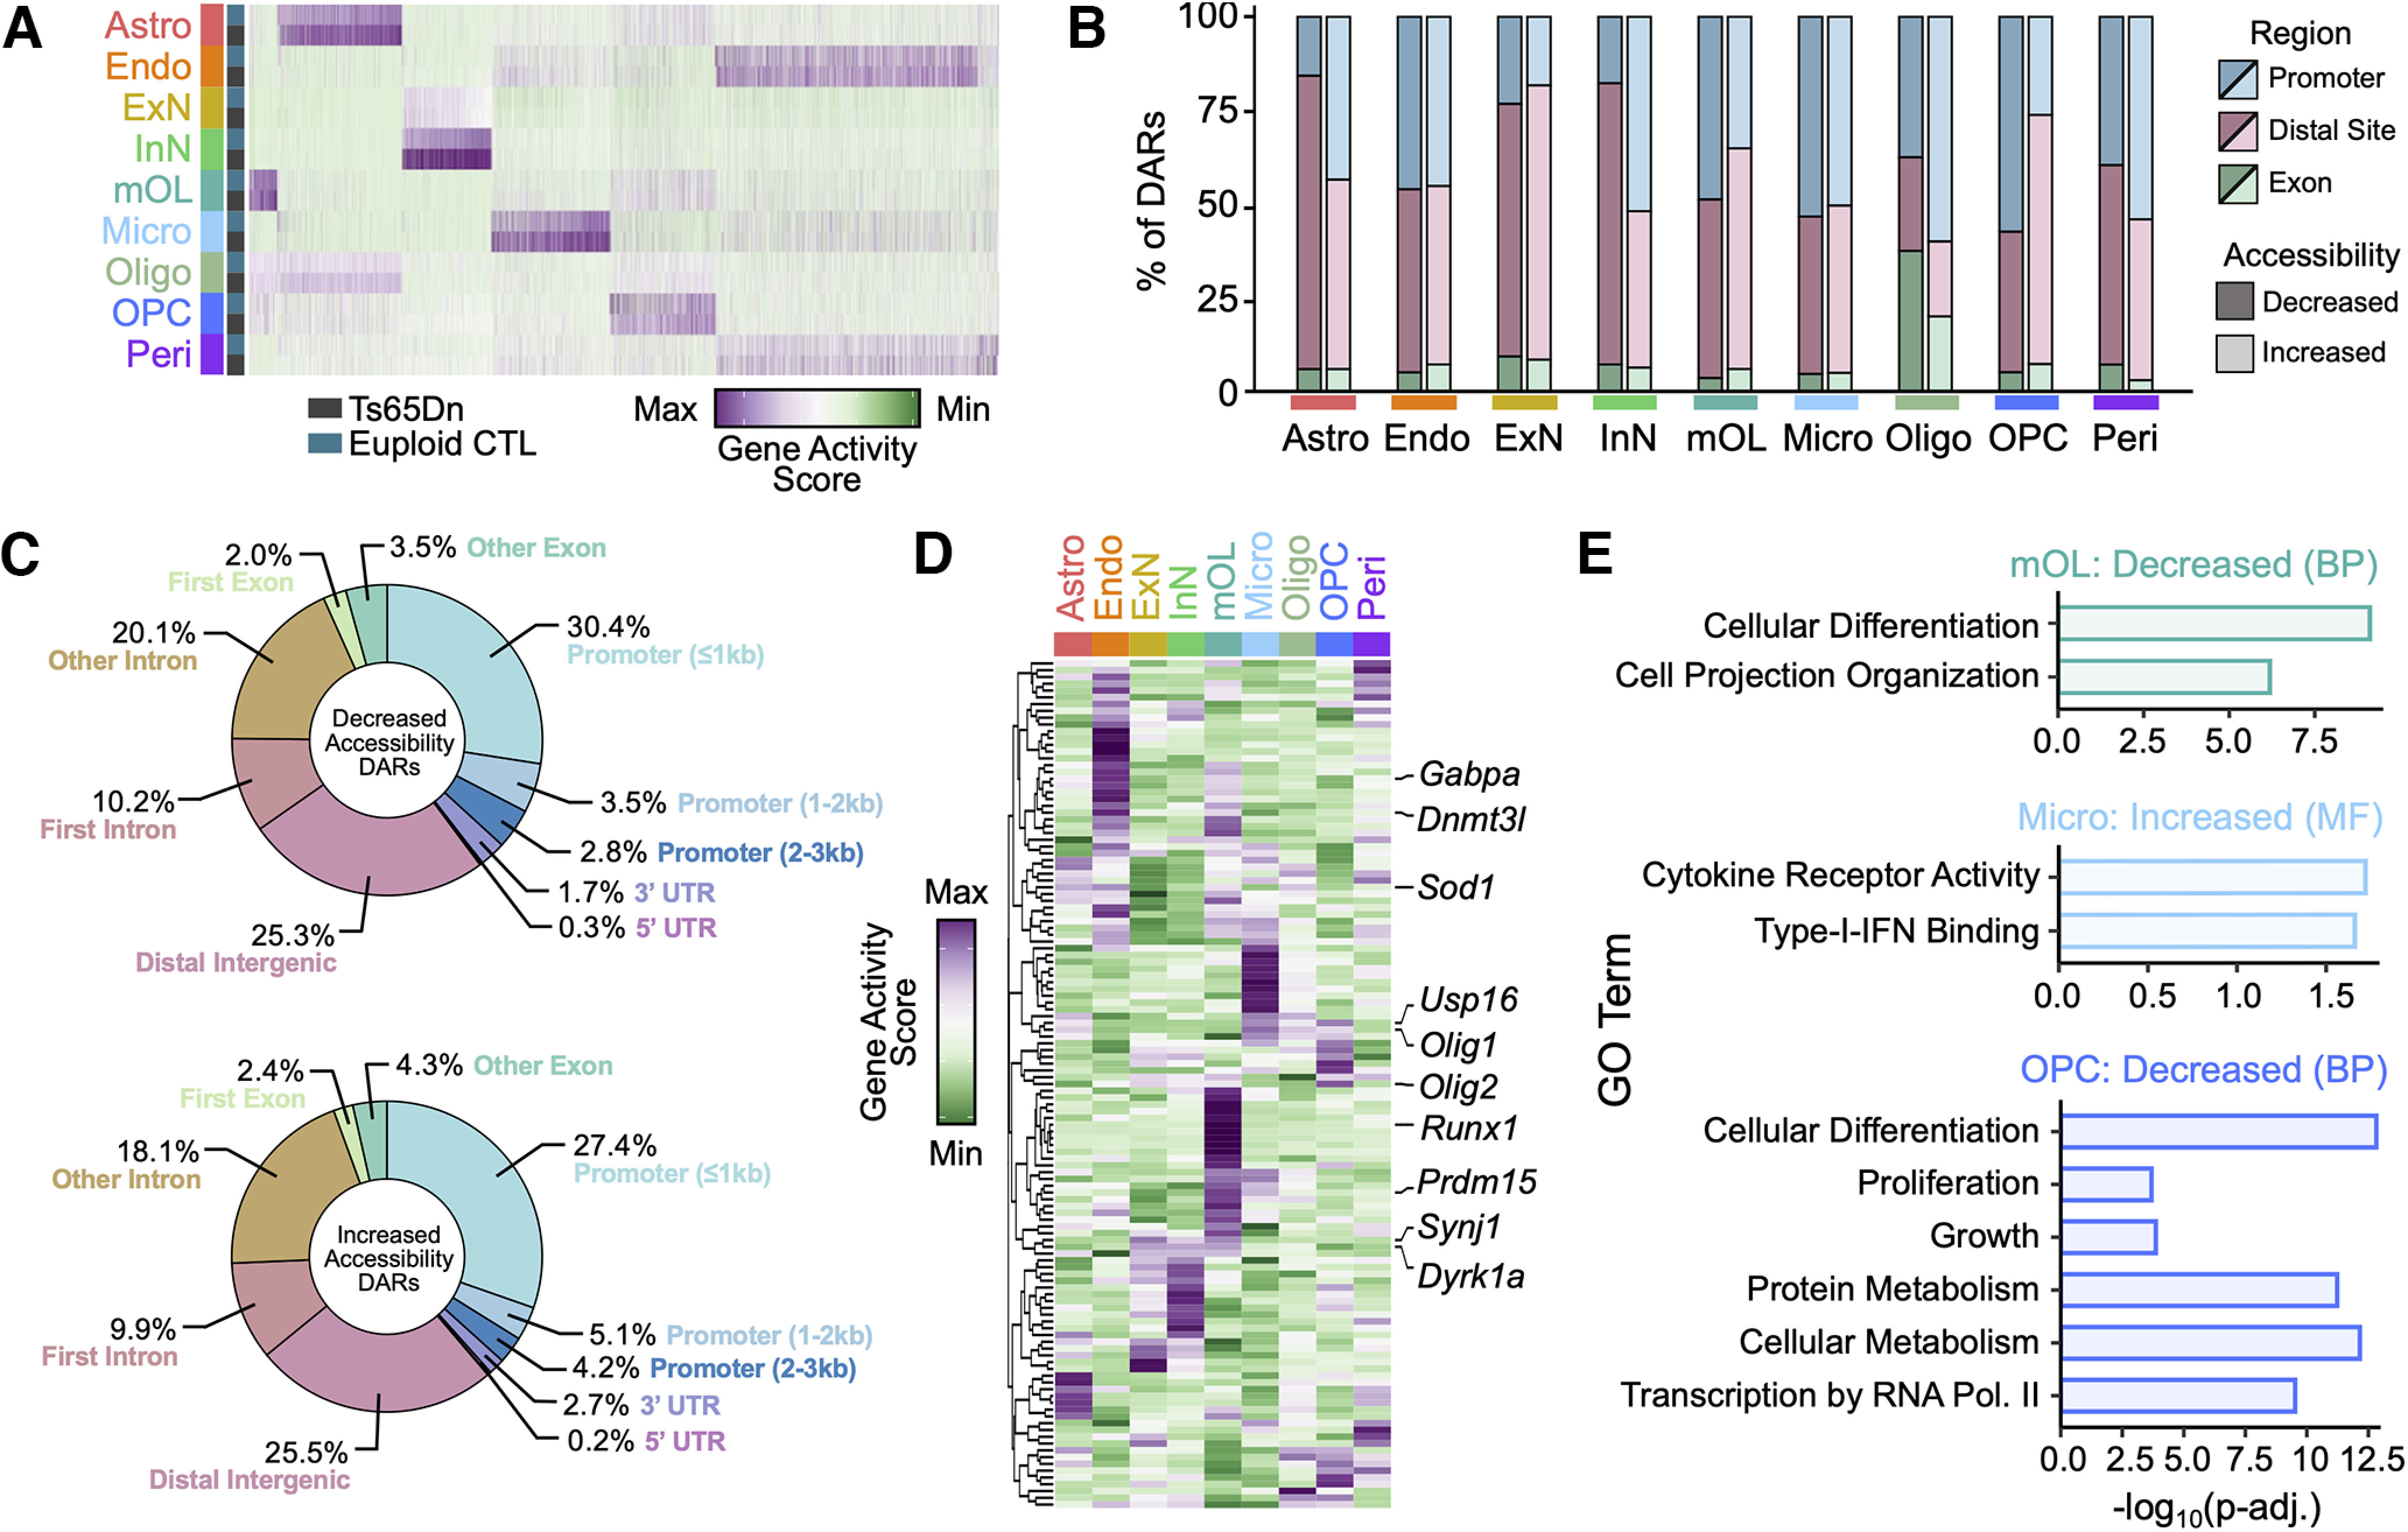
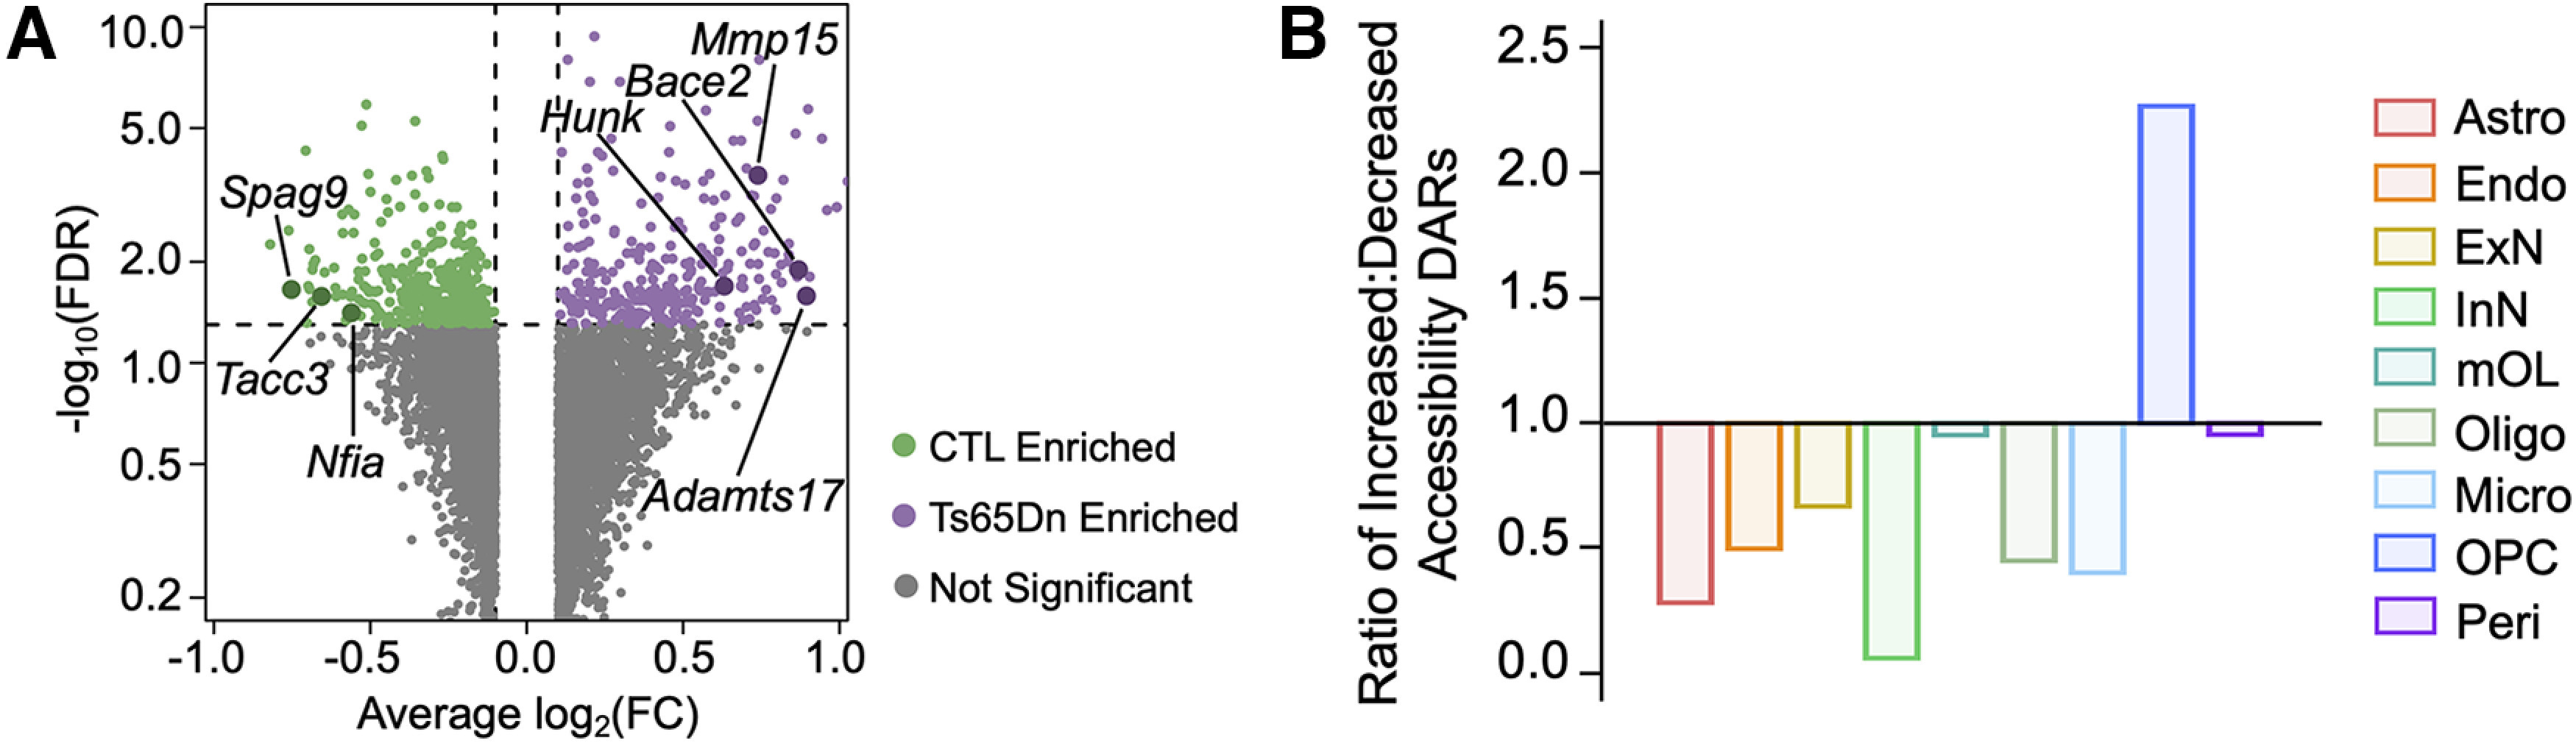
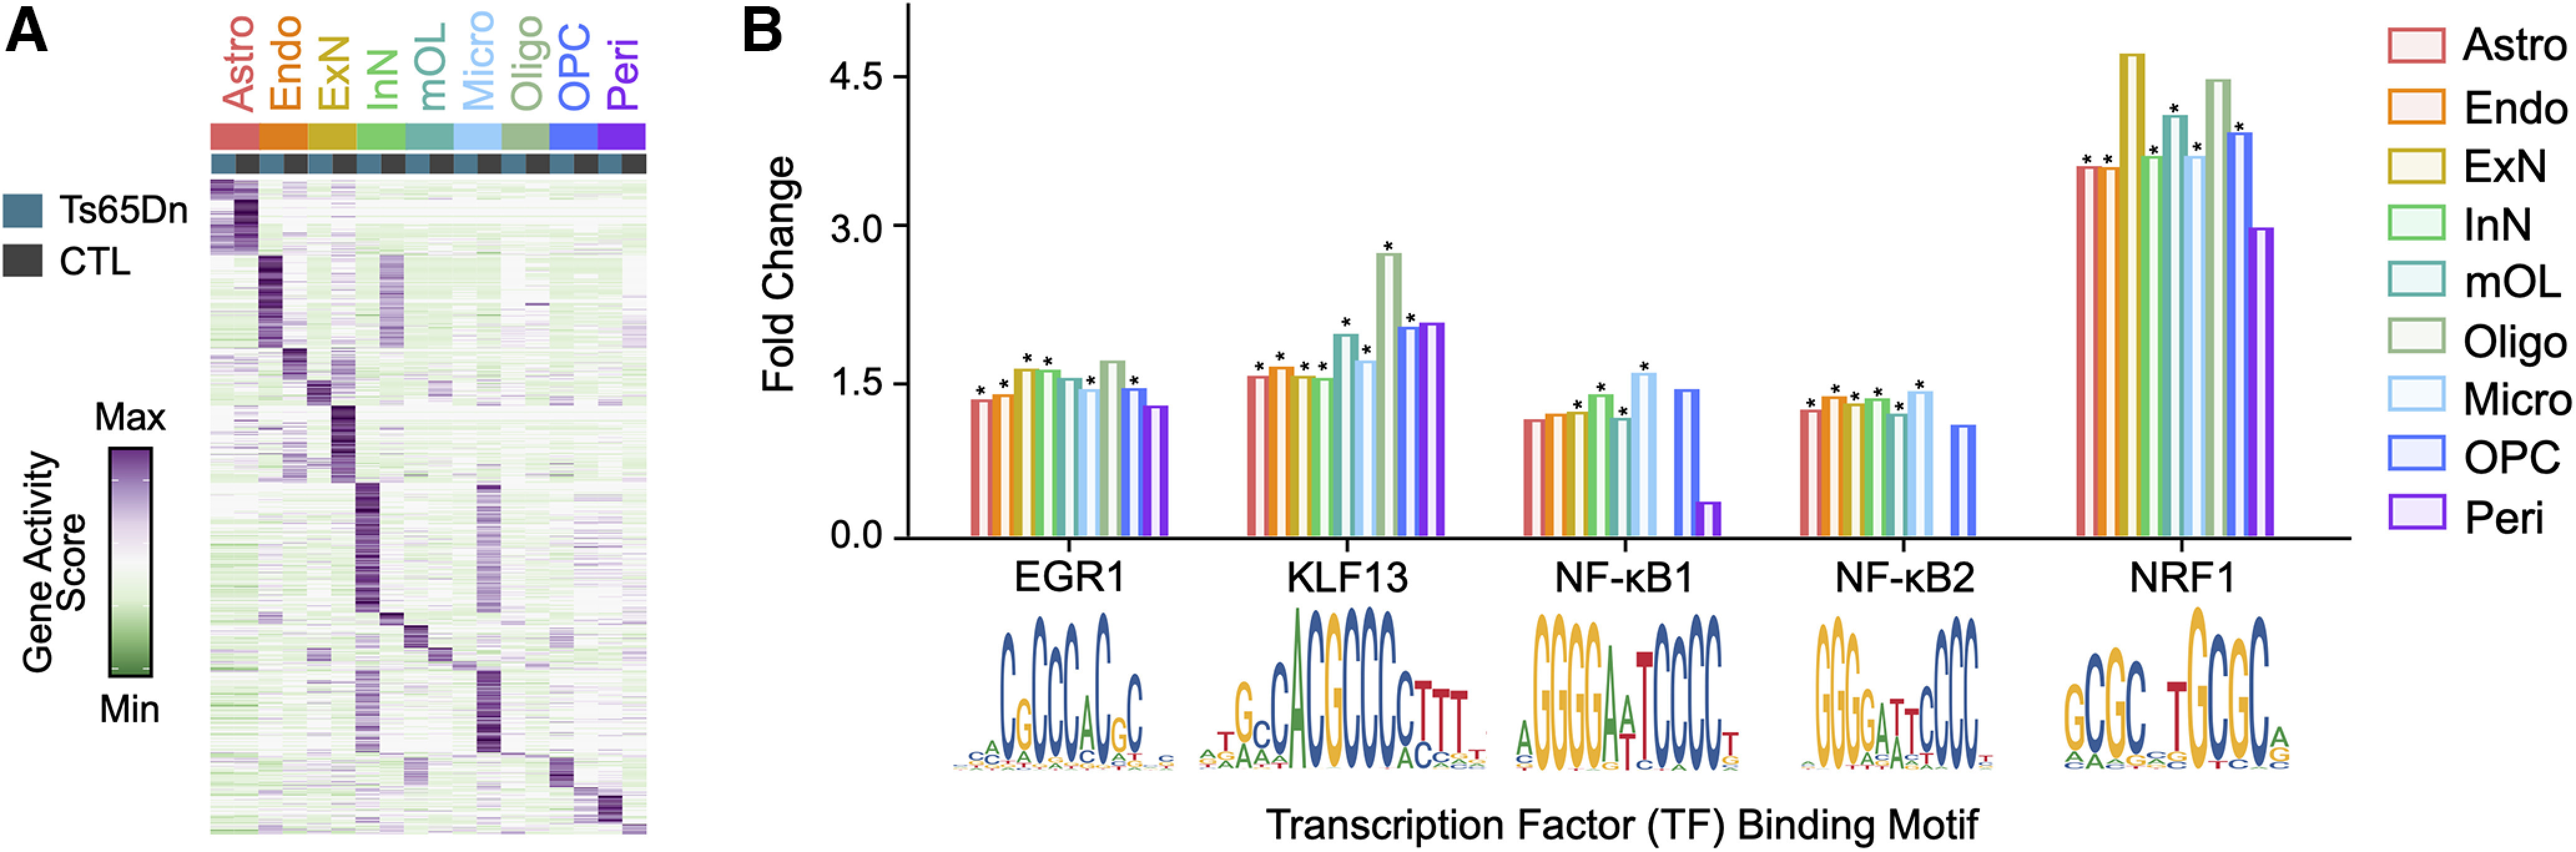
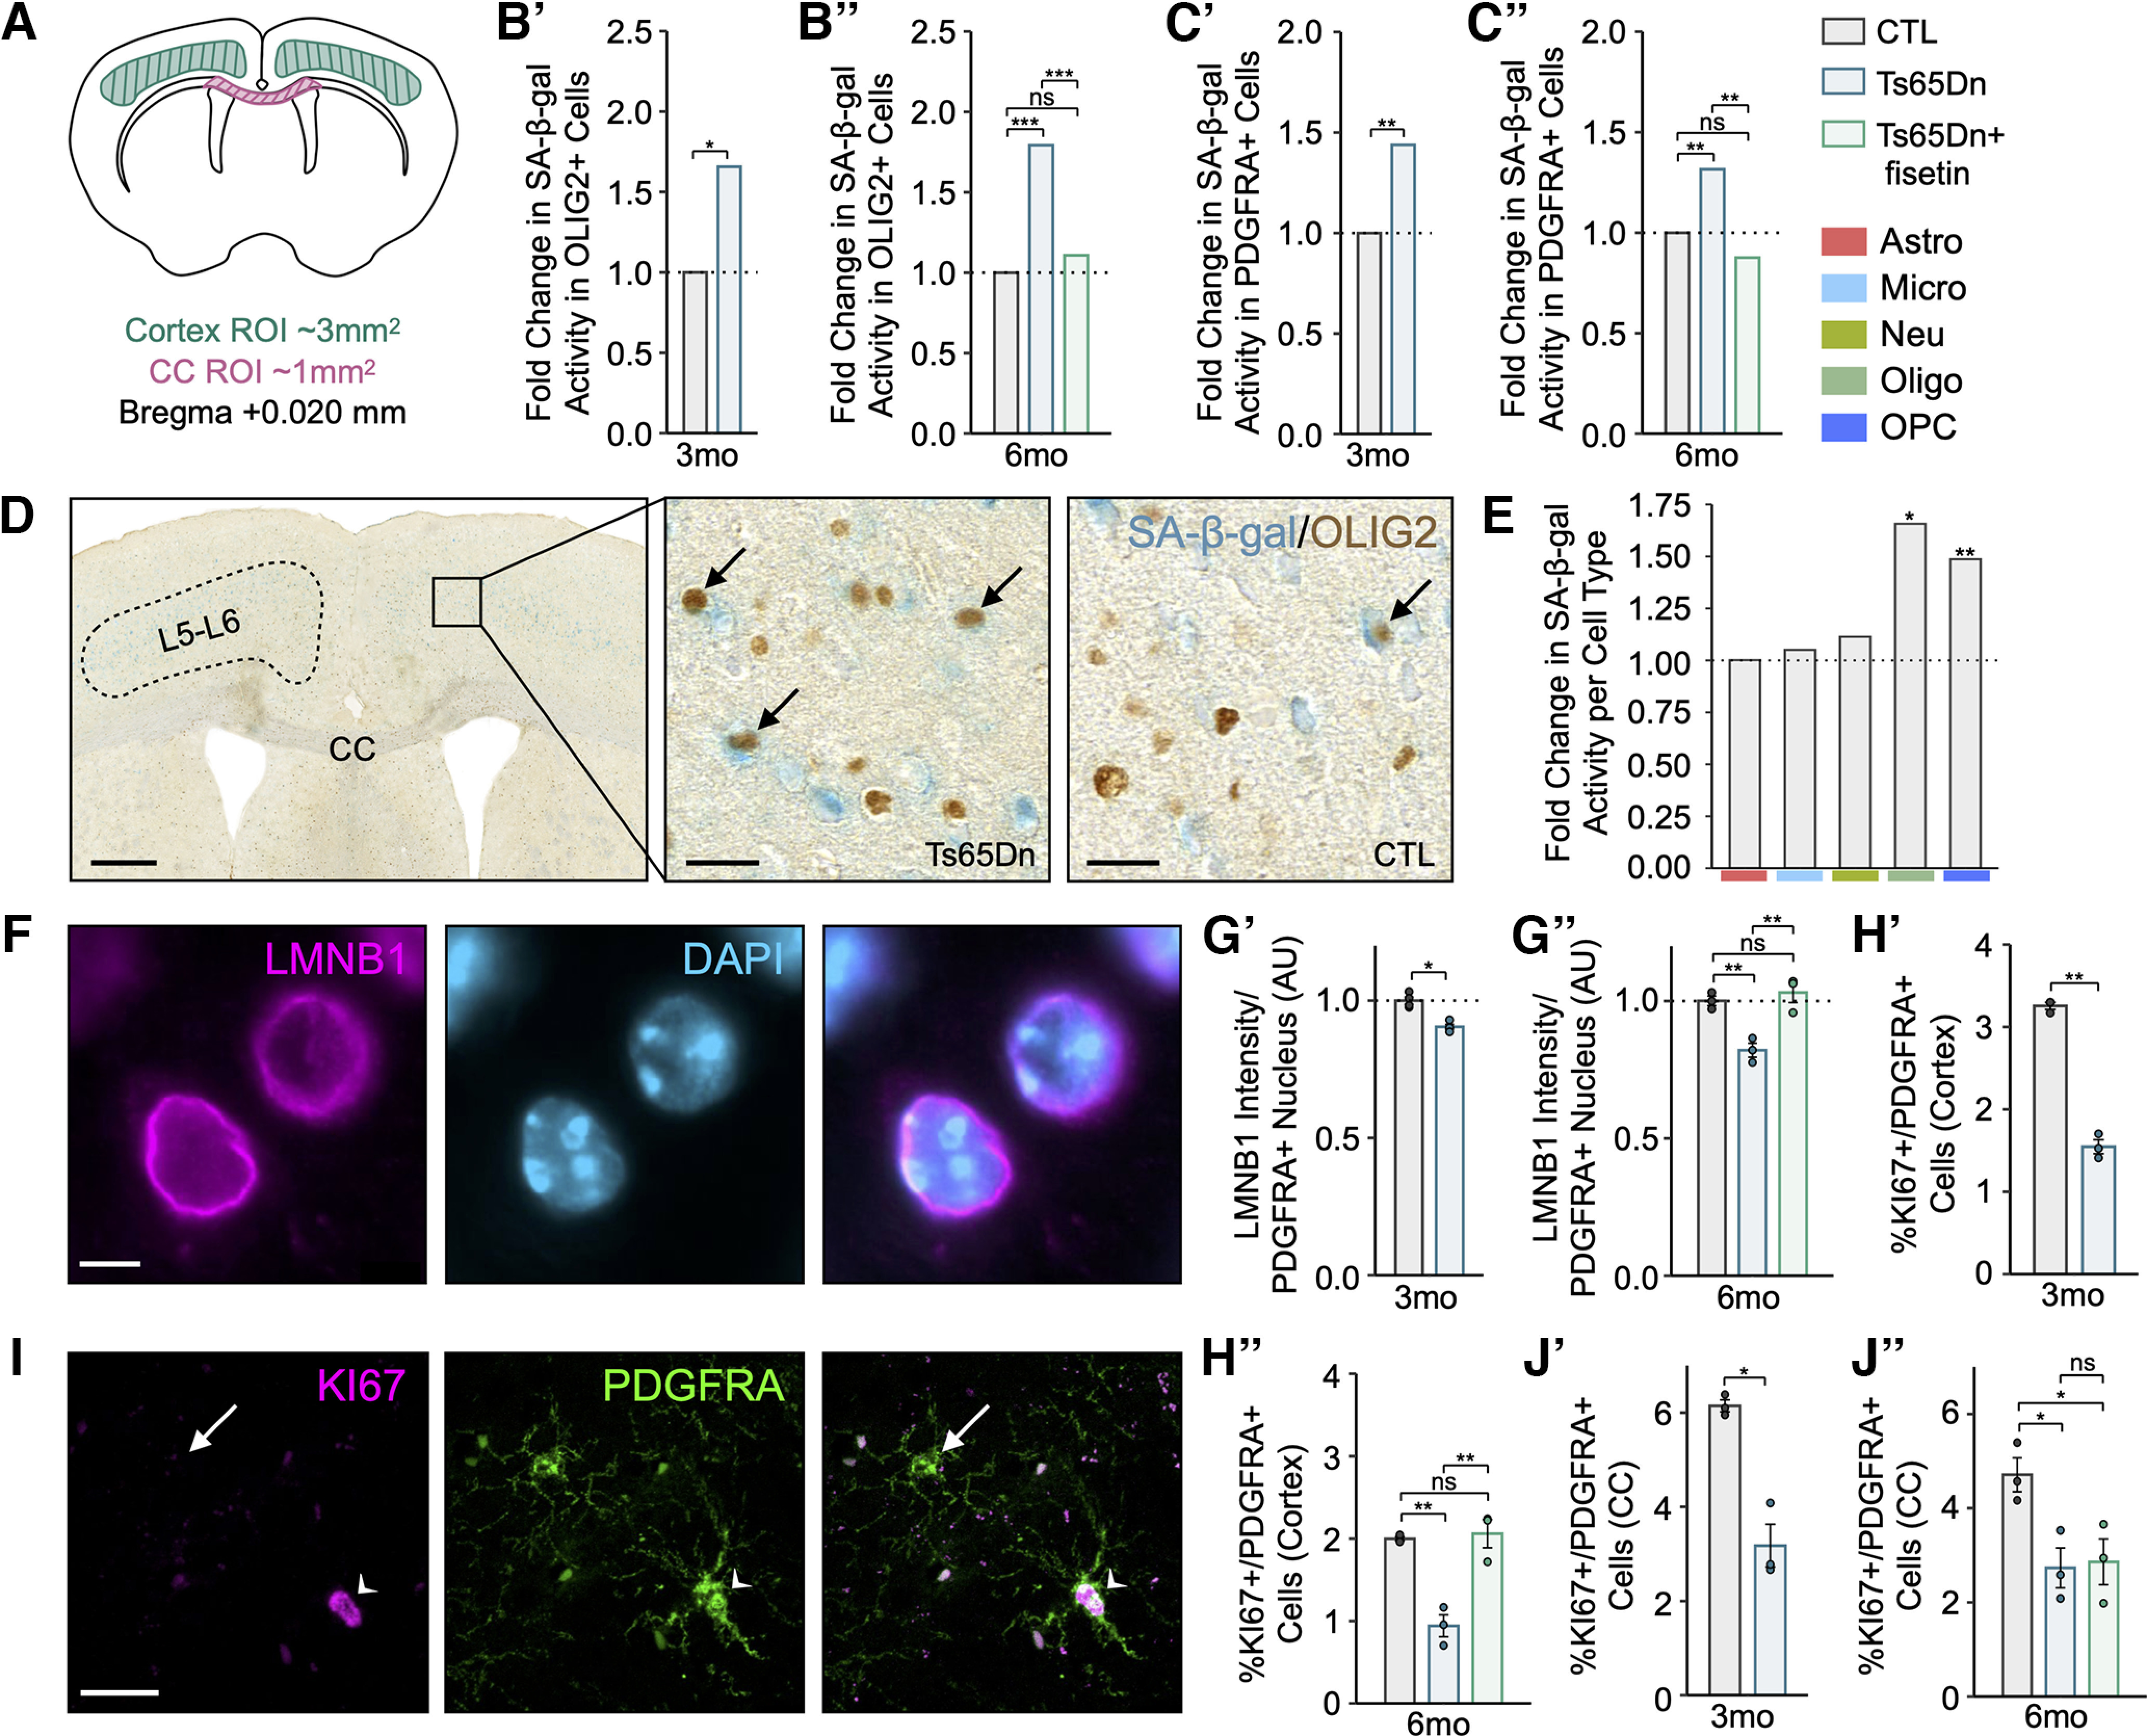
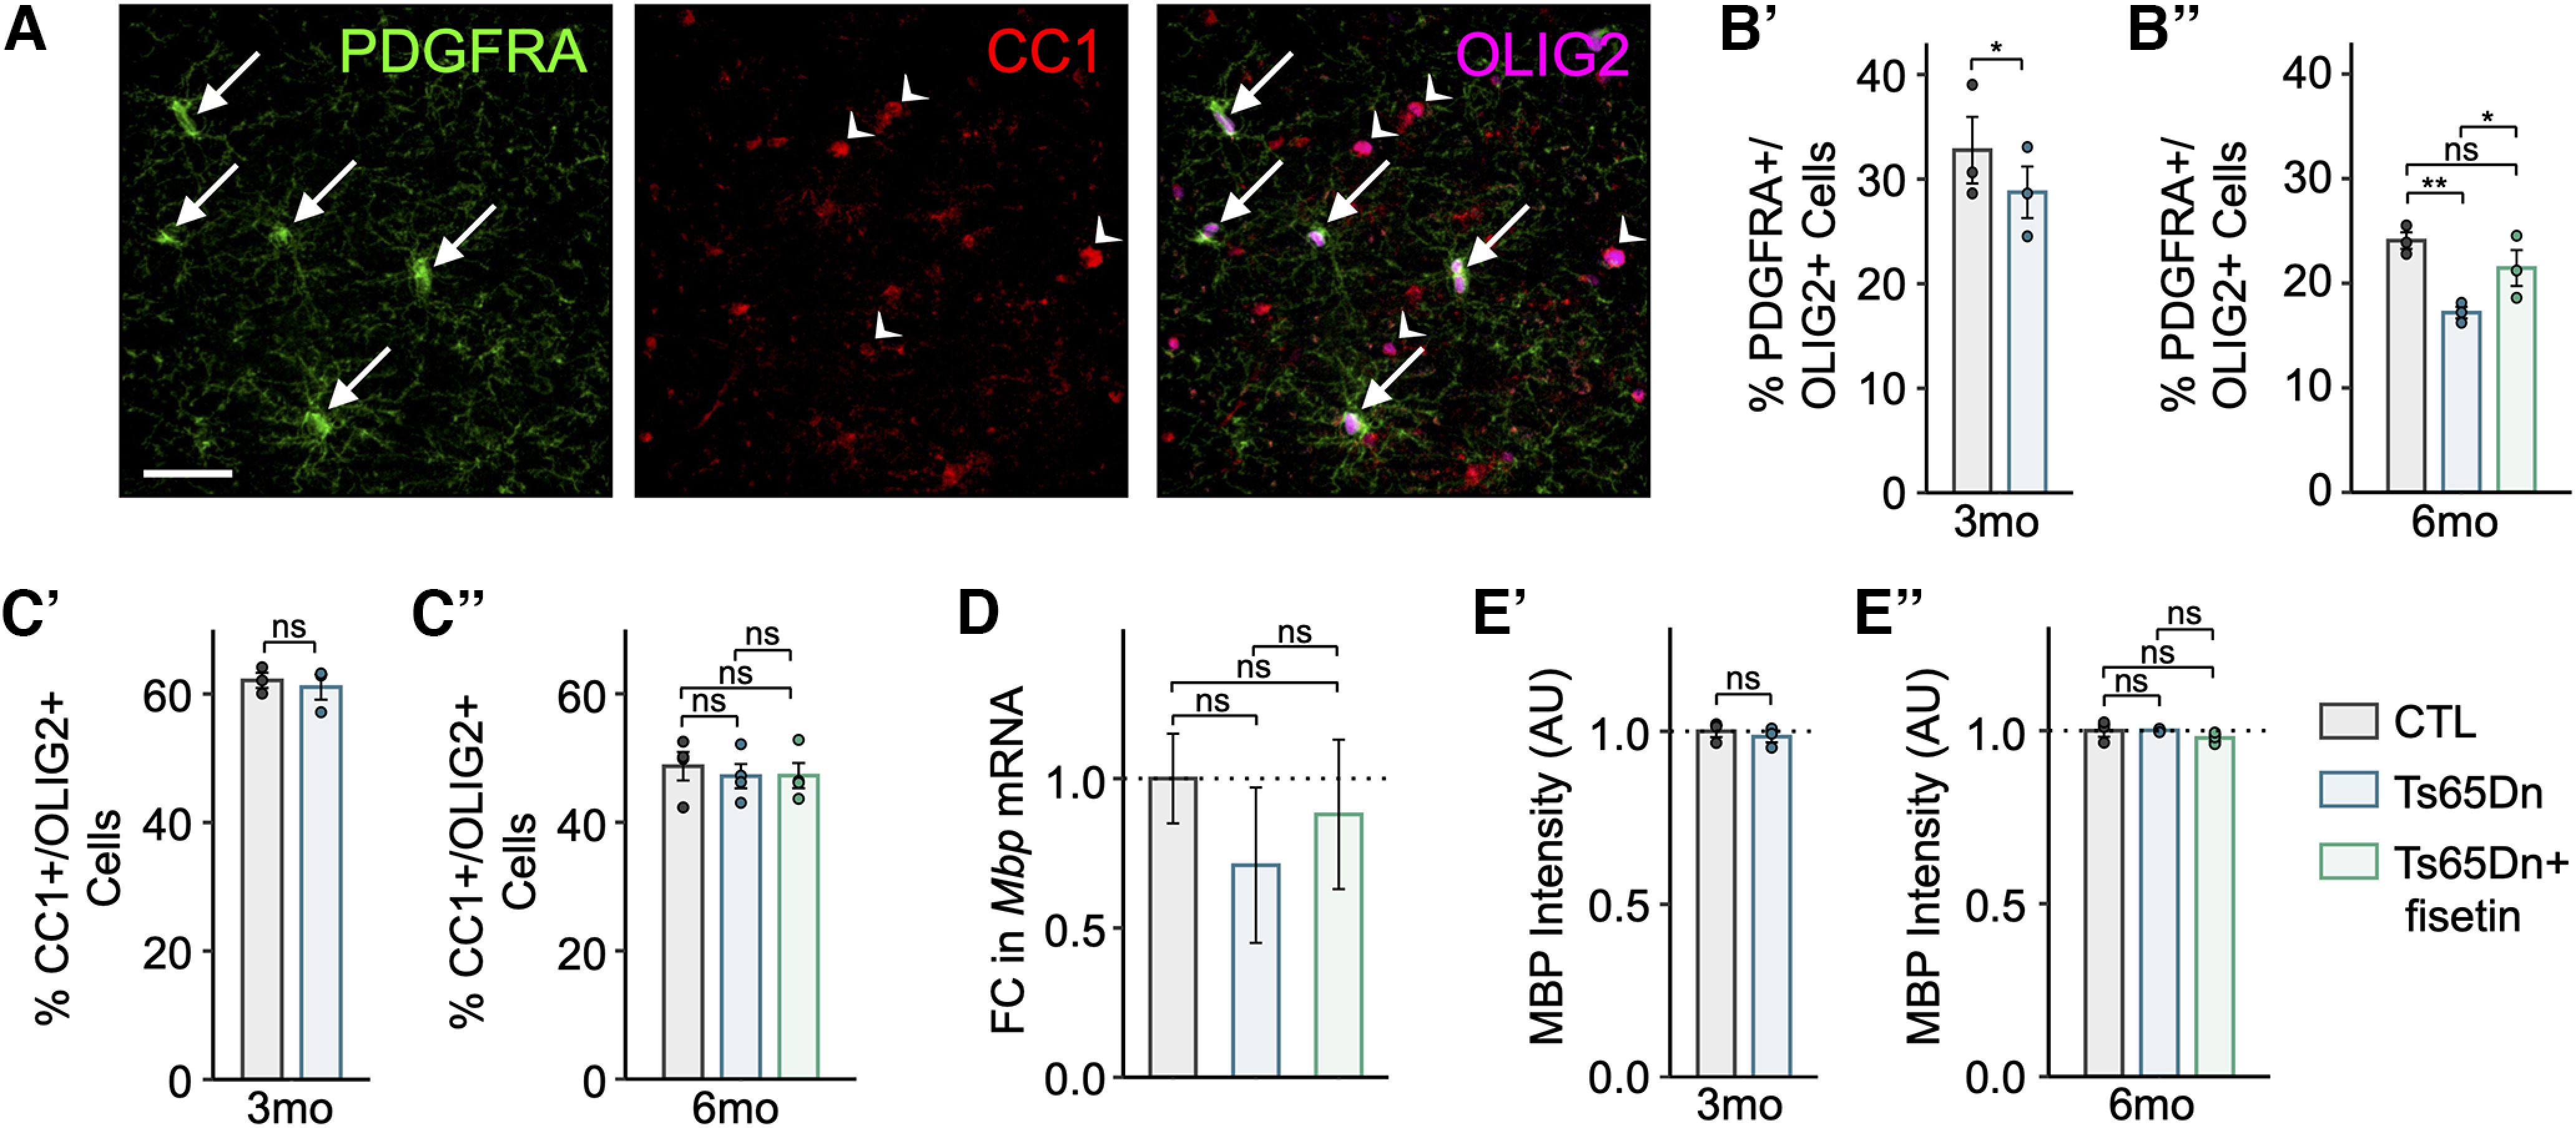
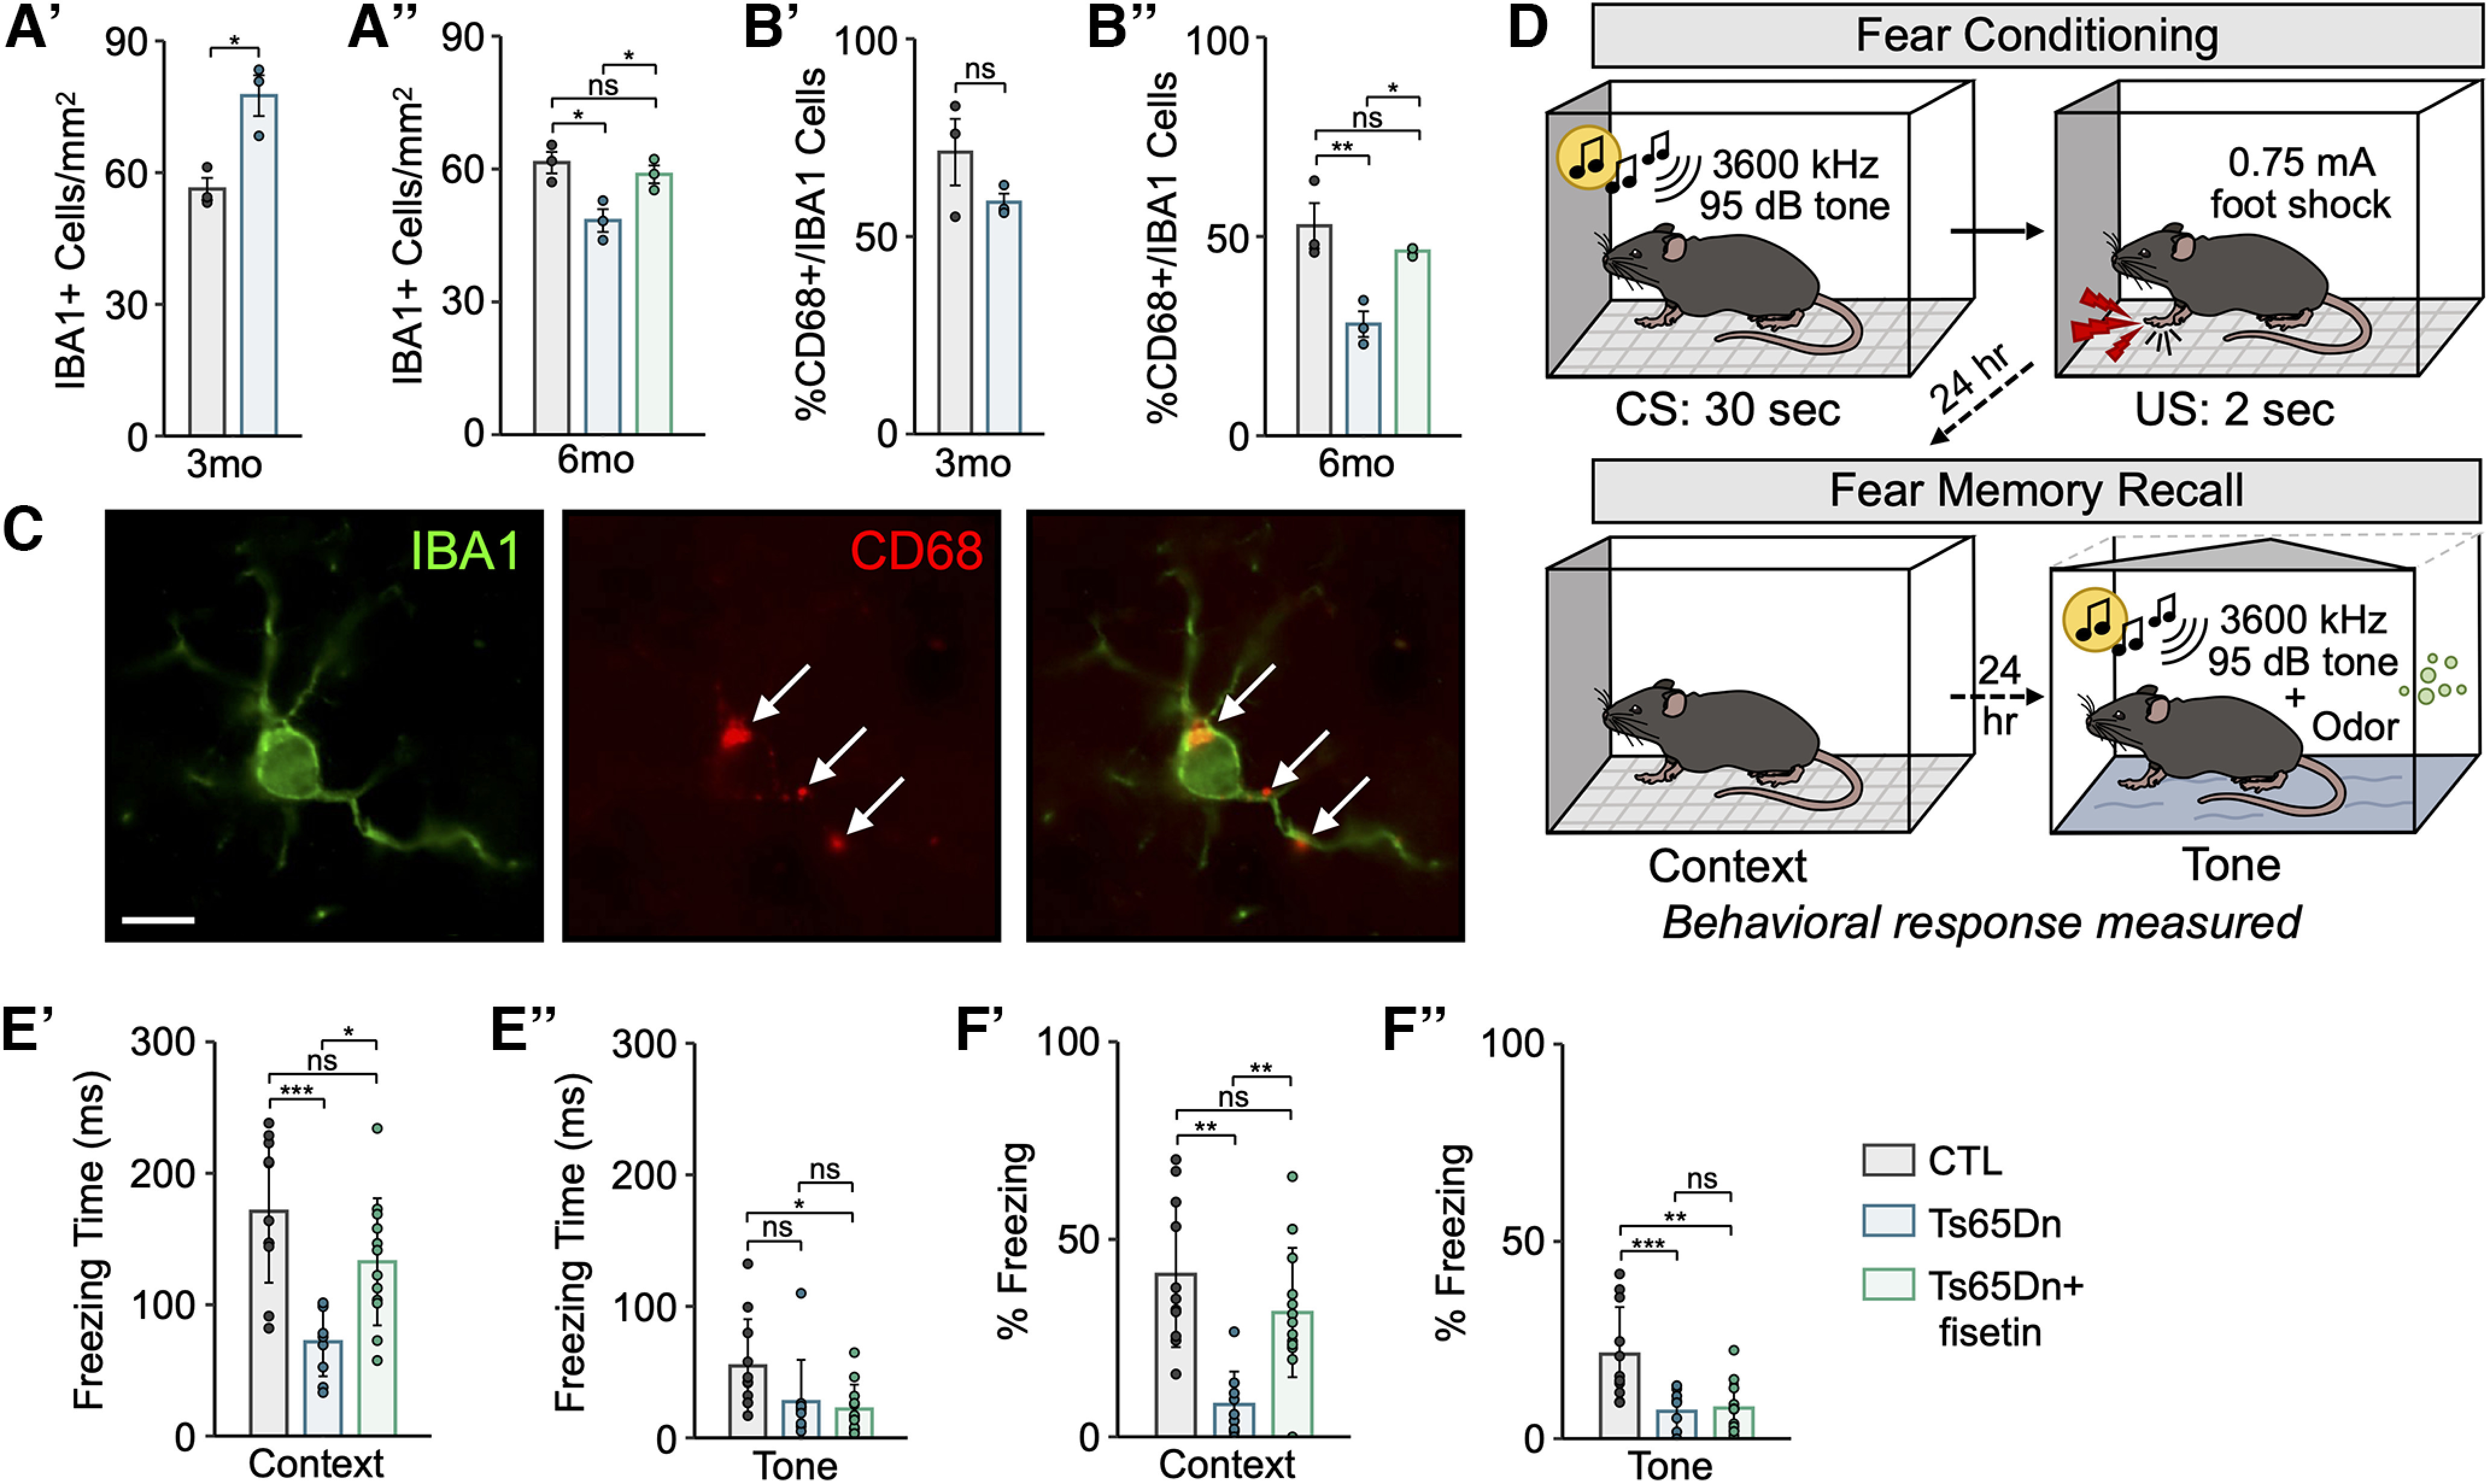
Down syndrome (DS), the most common genetic cause of intellectual disability, is associated with lifelong cognitive deficits. However, the mechanisms by which triplication of chromosome 21 genes drive neuroinflammation and cognitive dysfunction are poorly understood. Here, using the Ts65Dn mouse model of DS, we performed an integrated single-nucleus ATAC and RNA-sequencing (snATAC-seq and snRNA-seq) analysis of the adult cortex. We identified cell type-specific transcriptional and chromatin-associated changes in the Ts65Dn cortex, including regulators of neuroinflammation, transcription and translation, myelination, and mitochondrial function. We discovered enrichment of a senescence-associated transcriptional signature in Ts65Dn oligodendrocyte (OL) precursor cells (OPCs) and epigenetic changes consistent with a loss of heterochromatin. We found that senescence is restricted to a subset of OPCs concentrated in deep cortical layers. Treatment of Ts65Dn mice with a senescence-reducing flavonoid rescued cortical OPC proliferation, restored microglial homeostasis, and improved contextual fear memory. Together, these findings suggest that cortical OPC senescence may be an important driver of neuropathology in DS.

Keywords: Down syndrome; Trisomy 21; oligodendrocyte precursor cells; senescence; single-cell genomics.


Conflict of interest statement

The authors declare no competing financial interests.

Figures

Figure 1.
Figure 1.
Multimodal single-nucleus sequencing of the Ts65Dn mouse cortex identifies all major neuronal and non-neuronal cell types. A, Schematic representation of biological samples, cortical dissection, tissue processing and sequencing workflow for snATAC-seq and snRNA-seq from six months Ts65Dn and euploid control (CTL) mice (n = 3 male mice per condition). B, UMAP visualization of the snATAC-seq dataset, where each dot represents a single nucleus, for a total of 53,244 nuclei. UMAP plots are generated from combined replicates across Ts65Dn and CTL conditions. Each cluster is colored by cell type: Astro, astrocytes; Endo, endothelial cells; ExN, excitatory neurons; InN, inhibitory neurons; mOL, mature oligodendrocytes; Micro, microglia; Oligo, oligodendrocytes; OPC, oligodendrocyte precursor cells; Peri, pericytes; SMC1/2, smooth muscle cells. C, As in B, but a visualization of the snRNA-seq dataset, containing a total of 37,251 nuclei. D, Dotplot of snATAC-seq and snRNA-seq datasets showing gene expression or gene accessibility patterns, respectively, with several key canonical marker genes used for cluster identification. The diameter of the dot corresponds to the proportion of nuclei expressing or exhibiting accessibility of the indicated gene, and the color of the dot corresponds to the average expression or accessibility of the gene relative to all cell types. The number of nuclei assigned to each cell type are indicated. E, Barplot depicting the fraction of nuclei per cell type by condition. F, UMAP visualization of multi-omic integration of snATAC-seq and snRNA-seq datasets colored by cell type assignment. Beneath are UMAPs of the integration colored by originating dataset. G, UMAP visualization of excitatory neuron (ExN) subsets as extracted from snATAC-seq and snRNA-seq datasets. Each cluster is colored by cell type: Car3, Car3-expressing excitatory neurons; L2/3, cortical Layers II -III; L4/5, cortical Layers IV -V; L5, cortical Layer V; L5/6, cortical Layers V -VI; L6A/B, cortical Layer VI excitatory neuron subsets; Upper, mixed upper layer (II -IV) excitatory neurons. H, As in G, but a visualization of inhibitory neuron (InN) subsets. Each cluster is colored by cell type: Lamp5, Lamp5-expressing interneurons; Meis2, Meis2-expressing interneurons; Pvalb, parvalbumin-expressing interneurons; Sst, somatostatin-expressing interneurons; Vip, vasoactive intestinal peptide-expressing interneurons; Unspecified, interneurons of unspecified classification. See Extended Data Figure 1-1 for quality control (QC) metrics used in the initial processing of snATAC-seq and snRNA-seq data.
Figure 2.
Figure 2.
Transcriptionally distinct cellular subpopulations in Ts65Dn cortex. A, Strip plot displaying differentially expressed genes (DEGs) between Ts65Dn and CTL offspring at six months. Colored dots represent significant genes (FDR < 0.05) per cell type. The number of significant DEGs per cell type is indicated. The x-axis displays all major cortical cell types profiled through snRNA-seq. Data obtained from n = 3 biological replicates per condition. B, UpSet plot displaying the number of unique and shared DEGs across cell types, with unique genes colored based on cell type, and genes shared between two or three cell types indicated by black dots connected by lines according to shared origins. The histogram indicates the number of DEGs for each cell type, and the barplots show the number of significant DEGs (FDR < 0.05) per cell type. C, Dotplot of select differentially expressed genes (DEGs) within excitatory neuron (ExN) and inhibitory neuron (InN) subsets. Each row represents a neuronal subset population. Each column represents a gene. The color code represents the FDR, and the size of the dots represents the average log2fold change [avg log2(FC)] of gene expression between Ts65Dn and CTL mice. D, Hierarchically clustered heatmap of normalized gene expression for genes contained within the Ts65Dn chromosomal product. The plot displays gene activity across all cell types in snRNA-seq. Several genes of interest are indicated. Each column represents a cell type. The color code represents the row-normalized expression for each gene.
Figure 3.
Figure 3.
Gene set enrichment analysis (GSEA) reveals disruption of several biological pathways in trisomic cells from the Ts65Dn cortex. A, Gene set enrichment analysis (GSEA) of several Reactome biological pathways enriched across a majority of cortical cell types. The bars correspond to the left y-axis, displaying normalized enrichment score for each cell type by pathway and are colored by cell type identity. The dots correspond to the right y-axis, displaying -log2(FDR) for each cell type by pathway; the dashed horizontal line intercepts the right y-axis at 4.3, corresponding to an FDR = 0.05. All dots above this horizontal line are statistically significant. B, As in A, but depicting GSEA of several Reactome biological pathways enriched across astrocytes (Astro), mature oligodendrocytes (mOL), microglia (Micro), and oligodendrocyte precursor cells (OPC). C, Dotplot of select differentially expressed genes (DEGs) within astrocytes (red), microglia (light blue), and OPCs (dark blue). Each column represents a cell population. Each row represents a gene. The color code represents the FDR, and the size of the dots represents the average log2fold change [avg log2(FC)] of gene expression between Ts65Dn and CTL.
Figure 4.
Figure 4.
Cortical Ts65Dn OPCs exhibit a selective senescence-associated phenotype. A, GSEA-based enrichment plot of the SenMayo senescence gene set for OPCs. The upper y-axis represents the enrichment score (ES), and the blue line represents the running enrichment score. The x-axis displays gene ranked according to their expression in Ts65Dn, with the most upregulated genes on the left-hand side and the most downregulated genes toward the right-hand side. Black vertical lines depict the positions of individual genes and their enrichment within the transcriptional signature. B, Barplot displaying the enrichment of the SenMayo senescence gene set across cortical cell types. The bars correspond to the left y-axis, displaying normalized enrichment score for each cell type by pathway and are colored by cell type identity. The dots correspond to the right y-axis, displaying -log2(FDR) for each cell type by pathway; the dashed horizontal line intercepts the right y-axis at 4.3, corresponding to an FDR = 0.05. All dots above this horizontal line are statistically significant. C, Volcano plot of OPC DEGs in Ts65Dn versus CTL conditions. Only genes with an average log2fold change [avg log2(FC)] >0.1 or <−0.1. are included in the plot. Each dot represents a gene. Dots are colored according to enrichment: green dots are enriched in CTL, purple dots are enriched in Ts65Dn, and gray dots are not significantly enriched in either condition. The horizontal line depicts an FDR = 0.05, such that all genes above this line are statistically significant. D, Barplot depicting the number of DEGs (FDR < 0.05) in OPCs with functionality localized to the extracellular compartment (EC) or plasma membrane (PM). Purple bars depict DEGs enriched in Ts65Dn, and green bars depict DEGs enriched in CTL. E, Heatmap of differentially expressed genes (DEGs) localized to the extracellular compartment (EC) or plasma membrane (PM) in OPCs. Each row represents a gene. The color code represents the avg log2(FC) of gene expression between Ts65Dn and CTL. F, Chord diagram of cell-cell signaling pathways that are downregulated in Ts65Dn versus CTL. Cell type identity of the ligand is indicated in the outermost edge of the diagram, while the cell identity of the receptor is indicated by the internal ring. Colored arrows indicate the specific ligand-receptor (LR) pairs and are colored according to the outgoing ligand signal. G, As in F, but depicting cell-cell signaling pathways that are upregulated in Ts65Dn versus CTL.
Figure 5.
Figure 5.
Chromatin accessibility landscape in the mature Ts65Dn cortex. A, Heatmap of the average number of cut sites within a DAR for each cell type by condition. Each column represents a cell type from Ts65Dn or CTL. The color code represents the gene activity score. B, Stacked barplot displaying the genomic distribution of differentially accessible regions (DARs). DARs located within promoters (<0–3 kb of the gene) are colored in blue, within distal regulatory sites (5′/3′ UTRs, introns, >300 kb downstream of the gene or intergenic) are colored in pink, or within exons are colored in green. Bars shaded in darker colors correspond to DARs showing decreased accessibility in Ts65Dn, and bars shaded in lighted colors correspond to DARs showing increased accessibility in Ts65Dn. Bars are grouped according to cell type identity. C, Pie chart of the genomic distribution of DARs that exhibit decreased or increased accessibility in Ts65Dn mice. Each fraction of the pie corresponds to a different genomic region, and is labeled according to the percentage of DARs associated with the specific genomic region. D, Hierarchically clustered heatmap of normalized gene accessibility for genes contained within the Ts65Dn chromosomal product. The plot displays gene activity across all cell types in snATAC-seq. Several genes of interest are indicated. Each column represents a cell type. The color code represents the row-normalized accessibility for each gene. E, Barplot of the -log10(p-adj) value of enrichment for select gene ontology (GO) biological process (BP) or molecular function (MF) terms for mature oligodendrocytes (mOL), microglia (Micro), and oligodendrocyte precursor cells (OPC). Bars are colored according to cell type.
Figure 6.
Figure 6.
Cortical Ts65Dn OPCs exhibit senescence-associated chromatin changes. A, Volcano plot of OPC DARs in Ts65Dn versus CTL conditions. Only genes with an average log2fold change [log2(FC)] >0.1 or <−0.1. are included in the plot. Each dot represents a gene. Dots are colored according to enrichment: green dots are enriched in CTL, purple dots are enriched in Ts65Dn, and gray dots are not significantly enriched in either condition. The horizontal line depicts an FDR = 0.05, such that all genes above this line are statistically significant. B, Barplot displaying the ratio of DARs with increased to decreased accessibility across all cell types. A ratio of 1 indicates an equal number of increased and decreased DARs, while a ratio of greater or <1 indicates a greater number of increased or decreased DARs, respectively. Each bar is colored by cell type identity. Only statistically significant DARs (FDR < 0.05) are included.
Figure 7.
Figure 7.
Cell type-specific transcription factor (TF) activity in the mature Ts65Dn cortex. A, Heatmap of average ChromVAR transcription factor (TF) motif activity for each cell type. Each column represents a cell type from Ts65Dn or CTL. The color code represents the row-normalized accessibility for each TF. B, Barplot showing the relative fold change for select TFs between Ts65Dn and CTL. Each bar corresponds to a cell type. Bars labeled with asterisks indicate statistically significant enrichment (FDR < 0.05) for the given TF. Beneath each grouped barplot is the position weight matrix (PWM) for the binding motif associated with each TF.
Figure 8.
Figure 8.
Deep cortical layer Ts65Dn OPCs exhibit several hallmarks of senescence that are rescued in mature adult mice treated with fisetin. A, Schematic of the region of interest (ROI) used for cell quantification across the cortex (∼3 mm2) and CC (∼1 mm2), demarcated with a green and magenta border, respectively. All tissue was sliced at bregma +0.020 mm. B’, B’’, Barplot of SA-β-gal activity in OLIG2+ cells (OL-lineage) in three- and six-month mice, showing a significant increase in SA-β-gal+/OLIG2+ cells in Ts65Dn at both time points, with a rescue in six-month Ts65Dn mice treated with fisetin. Bars represent the average values for each condition (n =3 male mice per condition, n =3 replicates per mouse), and dots represent the average values for each mouse per condition. C’, C’’, As in B but depicting SA-β-gal activity in PDGFRA+ cells (OPCs), showing a significant increase in SA-β-gal+/PDGFRA+ cells in Ts65Dn at both time points, with a rescue in six-month Ts65Dn mice treated with fisetin (n =4 mice per condition, n =3 replicates per mouse, n =3 males, n =1 female). D, SA-β-gal staining in coronal brain sections from a three-month Ts65Dn mouse; arrows point to OLIG2+ (brown) SA-β-gal+ (blue) cells throughout the cortex. Panel on the right shows a high magnification image of the area demarcated in the left panel. Images are representative of those observed in samples from Ts65Dn and CTL mice. Scale bars are shown in the bottom left corner of each panel: left panel, 500 μm; right/center panels, 50 μm. E, Barplot of the fold change in SA-β-gal activity across several major cortical cell types in three-month Ts65Dn versus CTL mice (n =3 male mice per condition, n =3 replicates per mouse). Astro, astrocytes; Micro, microglia; Neu, neurons; Oligo, oligodendrocytes; OPC, oligodendrocyte precursor cells. Only Oligos and OPCs exhibit statistically significant increases in SA-β-gal activity in Ts65Dn versus CTL. F, Immunostaining for LMNB1 (pink) and nuclear DAPI (blue) in a three-month Ts65Dn mouse. Images are representative of those observed in samples from Ts65Dn and CTL mice. Scale bar is shown in the bottom left corner of the panel: 5 μm. G’, G’’, Barplots of LaminB1 (LMNB1) intensity in arbitrary units (AU) per OPC (PDGFRA+) nucleus. Values have been normalized to the mean intensity found in CTL replicates. Bars represent the average values for each condition (at 3 months: n =4 mice per condition, n =3 replicates per mouse, n =3 males and n =1 female; at 6 months: n =3 male mice per condition, n =3 replicates per mouse), and dots represent the average values for mouse per condition. H’, H’’, Barplots of the percentage of KI67+/PDGFRA+ cells (proliferating OPCs), showing a significant increase in proliferating OPCs cells in Ts65Dn at both time points, with a rescue in six-month Ts65Dn mice treated with fisetin. Bars represent the average values for each condition (n =3 male mice per condition, n =3 replicates per mouse), and dots represent the average values for each mouse per condition. I, Immunostaining for KI67 (pink) and PDGFRA (green) in a three-month Ts65Dn mouse. Images are representative of those observed in samples from Ts65Dn and CTL mice (n =3 male mice per condition, n =3 replicates per mouse). The arrow points to a PDGFRA+ cell, and the arrowhead points to a KI67+/PDGFRA+ cell. Scale bar is shown in the bottom left corner of the panel: 20 μm. J’, J’’, Barplots of the percentage of KI67+/PDGFRA+ cells (proliferating OPCs), showing a significant increase in proliferating OPCs cells in Ts65Dn at both time points, with a rescue in six-month Ts65Dn mice treated with fisetin. Bars represent the average values for each condition (n =3 male mice per condition, n =3 replicates per mouse), and dots represent the average values for each mouse per condition. For all plots: significance is determined using the two-tailed Student’s t test at three months, or using the one-way ANOVA and post hoc Tukey’s test at six months. *p-value < 0.05, **p-value < 0.01, ***p-value < 0.001, ns: not significant; error bars represent the average ± 1 standard deviation (SD).
Figure 9.
Figure 9.
OPC senescence alters the number of progenitors but not the number of mature OLs. A, Immunostaining for PDGFRA (green), CC1 (red), and OLIG2 (pink) in a three-month Ts65Dn mouse. Images are representative of those observed in samples from Ts65Dn and CTL mice. Arrows point to PDGFRA+/OLIG2+ cells, and arrowheads point to CC1+/OLIG2+ cells. Scale bar is shown in the bottom left corner of the panel: 20 μm. B’, B’’, Barplots of the percentage of PDGFRA+/OLIG2+ cells (OPCs), showing a significant decrease in the number of OPCs at six months, with a rescue in six-month Ts65Dn mice treated with fisetin. Bars represent the average values for each condition (at 3 months: n =3 male mice per condition, n =3 replicates per mouse; at 6 months: n =3 male mice per condition, n =3 replicates per mouse), and dots represent the average values for each mouse per condition. C’, C’’, As in B but depicting the percentage of CC1+/OLIG2+ cells (mOLs), showing no significant change in the number of cells in Ts65Dn at either time point, and no rescue in six-month Ts65Dn mice treated with fisetin (at 3 months: n =3 male mice per condition, n =3 replicates per mouse; at 6 months: n =4 mice per condition, n =3 replicates per mouse, n =3 males and n =1 female). D, Barplot of the fold change (FC) in Mbp mRNA as measured through quantitative PCR (qPCR). Values were first normalized to Gapdh, and then normalized to the mean expression found in CTL replicates. Bars represent the average values for each condition (n =3 mice per condition, n =4 replicates per mouse, n =3 males). E’, E’’, As in B, but depicting MBP intensity in arbitrary units (AU). Values have been normalized to the mean intensity found in CTL replicates (n =3 male mice per condition, n =3 replicates per mouse). For all plots: significance is determined using the two-tailed Student’s t test at three months, or using the one-way ANOVA and post hoc Tukey’s test at six months. *p-value < 0.05, **p-value < 0.01, ***p-value < 0.001, ns: not significant; error bars represent the average ± 1 standard deviation (SD).
Figure 10.
Figure 10.
Fisetin rescues microglia phenotype and fear memory behavior in Ts65Dn mice. A’, A’’, Barplots of the number of IBA1+ (microglia) cells per mm2 in the cortex in three- and six-month mice, showing a significant increase in microglia in Ts65Dn at three months and a decrease at six months, with a rescue in six-month Ts65Dn mice treated with fisetin. Bars represent the average values for each condition (n =3 male mice per condition, n =3 replicates per mouse), and dots represent the average values for each mouse per condition. B’, B’’, as in A, but depicting the percentage of CD68+/IBA1+ (activated microglia) in the cortex, showing a significant decrease in activated microglia at six months, with a rescue in six-month Ts65Dn mice treated with fisetin (n =3 male mice per condition, n =3 replicates per mouse). C, Immunostaining for IBA1 (green) and CD68 (red) in a three-month Ts65Dn mouse. Images are representative of those observed in samples from Ts65Dn and CTL mice. Arrows point to CD68+ puncta in IBA1+ microglia. Scale bar is shown in the bottom left corner of the panel: 15 μm. D, Schematic representation of fear conditioning and memory recall behavioral battery. E’, E’’, Barplots of the time to freezing behavior depending on context and tone, showing a significant decrease in context-based but not tone-based freezing in Ts65Dn mice, with a rescue in the context-based behavior in six-month Ts65Dn mice treated with fisetin. Bars represent the average values for each condition (n =9 male mice per condition), and dots represent the data collected for each mouse per condition. F’, F’’, As in E, but depicting the percentage of freezing behavior, showing a significant decrease in context-based and tone-based freezing in Ts65Dn mice, with a rescue in the context-based, but not tone-based behavior in six-month Ts65Dn mice treated with fisetin (n =9 male mice per condition). For all plots: significance is determined using the two-tailed Student’s t test at three months, or using the one-way ANOVA and post hoc Tukey’s test at six months. *p-value < 0.05, **p-value < 0.01, ***p-value < 0.001, ns: not significant; error bars represent the average ± 1 standard deviation (SD).

Similar articles

References

    1. Ábrahám H, Vincze A, Veszprémi B, Kravják A, Gömöri É, Kovács GG, Seress L (2012) Impaired myelination of the human hippocampal formation in Down syndrome. Int J Dev Neurosci 30:147–158. 10.1016/j.ijdevneu.2011.11.005 - DOI - PubMed
    1. Ahmed MM, Johnson NR, Boyd TD, Coughlan C, Chial HJ, Potter H (2021) Innate immune system activation and neuroinflammation in Down syndrome and neurodegeneration: therapeutic targets or partners? Front Aging Neurosci 13:718426. 10.3389/fnagi.2021.718426 - DOI - PMC - PubMed
    1. Aitken CE, Beznosková P, Vlčkova V, Chiu W-L, Zhou F, Valášek LS, Hinnebusch AG, Lorsch JR (2016) Eukaryotic translation initiation factor 3 plays distinct roles at the mRNA entry and exit channels of the ribosomal preinitiation complex. Elife 5:e20934. 10.7554/eLife.20934 - DOI - PMC - PubMed
    1. Aivazidis S, Coughlan CM, Rauniyar AK, Jiang H, Liggett LA, Maclean KN, Roede JR (2017) The burden of trisomy 21 disrupts the proteostasis network in Down syndrome. PLoS One 12:e0176307. 10.1371/journal.pone.0176307 - DOI - PMC - PubMed
    1. Alexander M, Petri H, Ding Y, Wandel C, Khwaja O, Foskett N (2016) Morbidity and medication in a large population of individuals with Down syndrome compared to the general population. Dev Med Child Neurol 58:246–254. 10.1111/dmcn.12868 - DOI - PubMed

Publication types