. 2023 Jul 25;13(1):12029.
doi: 10.1038/s41598-023-39260-w.

Assessment of infant outgrowth of cow's milk allergy in relation to the faecal microbiome and metaproteome

Collaborators, Affiliations

Assessment of infant outgrowth of cow's milk allergy in relation to the faecal microbiome and metaproteome

Diana M Hendrickx et al. Sci Rep. .

Abstract

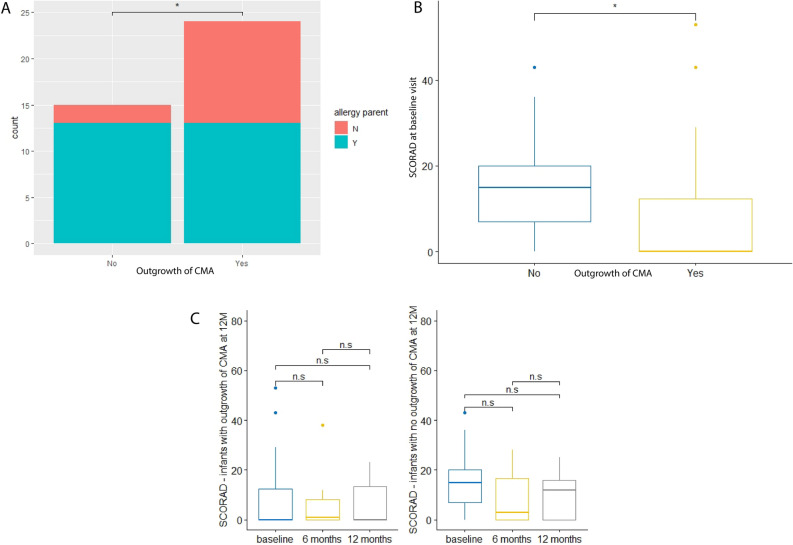
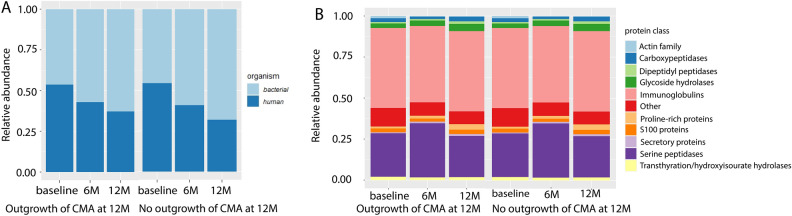
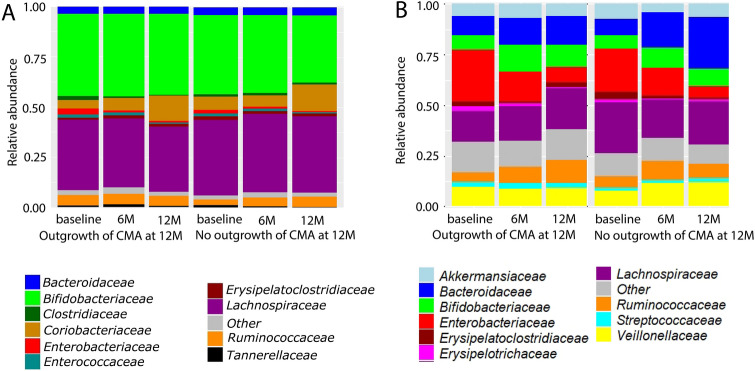
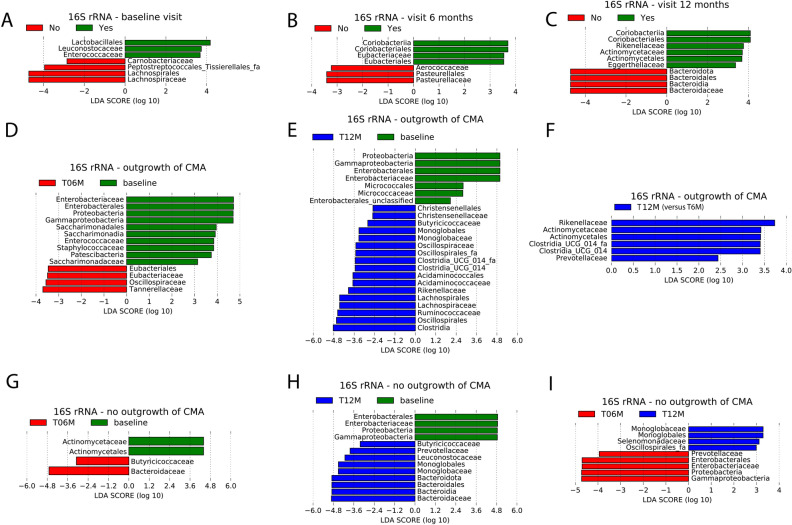
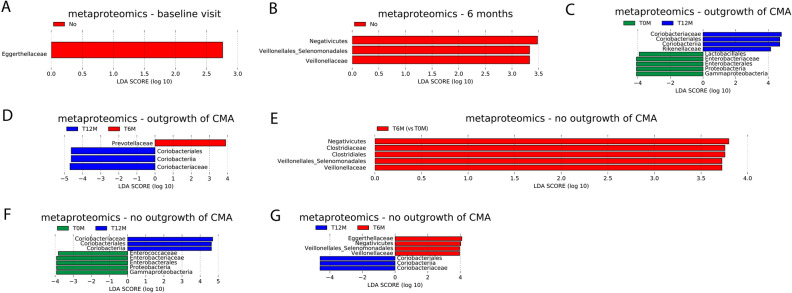
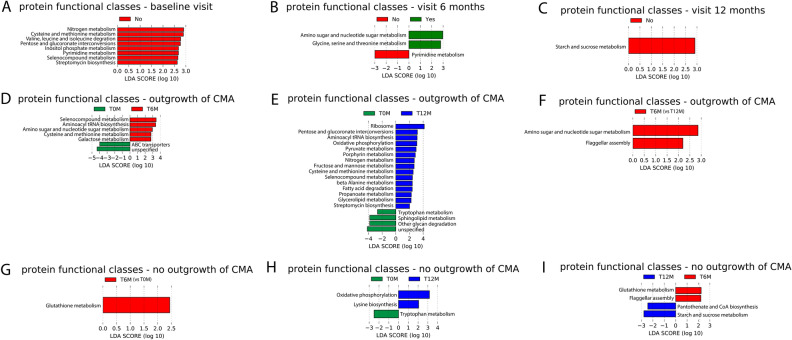
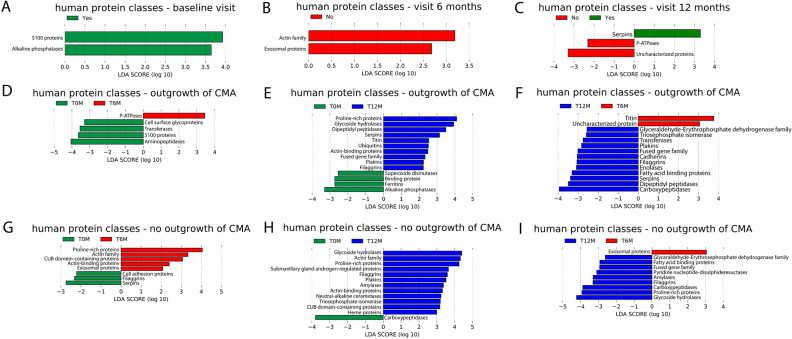
Previous studies provide evidence for an association between modifications of the gut microbiota in early life and the development of food allergies. We studied the faecal microbiota composition (16S rRNA gene amplicon sequencing) and faecal microbiome functionality (metaproteomics) in a cohort of 40 infants diagnosed with cow's milk allergy (CMA) when entering the study. Some of the infants showed outgrowth of CMA after 12 months, while others did not. Faecal microbiota composition of infants was analysed directly after CMA diagnosis (baseline) as well as 6 and 12 months after entering the study. The aim was to gain insight on gut microbiome parameters in relation to outgrowth of CMA. The results of this study show that microbiome differences related to outgrowth of CMA can be mainly identified at the taxonomic level of the 16S rRNA gene, and to a lesser extent at the protein-based microbial taxonomy and functional protein level. At the 16S rRNA gene level outgrowth of CMA is characterized by lower relative abundance of Lachnospiraceae at baseline and lower Bacteroidaceae at visit 12 months.


Conflict of interest statement

Jolanda Lambert was an employee of Danone Nutricia Research. The project is part of a partnership programme between NWO-TTW and Danone Nutricia Research. The other authors declare that they have no known conflicts of interest.

Figures

Figure 1
Figure 1
(A) Stacked bar plot for parental allergy. No = no outgrowth of CMA at visit 12 months; Yes = outgrowth of CMA at visit 12 months. (B) Boxplot for SCORAD at baseline visit. No = no outgrowth of CMA at visit 12 months; Yes = outgrowth of CMA at visit 12 months. (C) Boxplots for SCORAD over time. Left: outgrowth of CMA at 12 M; right: no outgrowth of CMA at 12 M. n.s.: not significant.
Figure 2
Figure 2
Ratio human/bacterial proteins (A) and human proteins composition (B) at each visit for the group that outgrew their CMA at visit 12 months (12 M) and the group that did not.
Figure 3
Figure 3
Protein-based microbial taxonomic profiles (family level) (A) and 16S rRNA gene-based taxonomic profiles (B) at each visit for the group that outgrew their CMA at visit 12 months (12 M) and the group that did not.
Figure 4
Figure 4
LEfSe analysis of 16S rRNA-based relative abundances at the family and all higher taxonomic levels using an alpha value of 0.05 for the factorial Kruskal–Wallis test among classes and a threshold of 2.0 on the logarithmic LDA score for discriminative features. (AC) Using outgrowth of CMA at visit 12 months as class, Yes: outgrowth of CMA at 12 months; no: no outgrowth of CMA at 12 months. Plots of discriminative features at baseline visit (A), visit 6 months (B) and visit 12 months (C). (DF) Pairwise comparison between visits within the group with outgrowth of CMA, using visit as class. (D) Visit 6 months (T06M) versus baseline; (E) visit 12 months (T12M) versus baseline; (F) visit 12 months (T12M) versus visit 6 months (T06M). (G-I) Pairwise comparison between visits within the group with persistent CMA, using visit as class. (G) Visit 6 months (T06M) versus baseline; (H) visit 12 months (T12M) versus baseline; (I) visit 12 months (T12M) versus visit 6 months (T06M).
Figure 5
Figure 5
LEfSe analysis of protein-based microbial relative abundances at the family and all higher taxonomic levels using an alpha value of 0.05 for the factorial Kruskal–Wallis test among classes and a threshold of 2.0 on the logarithmic LDA score for discriminative features. (A, B) Using outgrowth of CMA at visit 12 months as class, Yes: outgrowth of CMA at 12 months; no: no outgrowth of CMA at 12 months. Plot of discriminative features at (A) baseline visit; (B) visit 6 months. (C, D) Pairwise comparison between visits within the group with outgrowth of CMA, using visit as class. (C) visit 12 months (T12M) versus baseline (T0M); (D) visit 12 months (T12M) versus visit 6 months (T6M). (EG) Pairwise comparison between visits within the group with persistent CMA, using visit as class. (E) visit 6 months (T6M) versus baseline (T0M); (F) visit 12 months (T12M) versus baseline (T0M); (G) visit 12 months (T12M) versus visit 6 months (T6M).
Figure 6
Figure 6
LEfSe analysis of microbial protein functional classes (KEGG Brite level c) using an alpha value of 0.05 for the factorial Kruskal–Wallis test among classes and a threshold of 2.0 on the logarithmic LDA score for discriminative features. (AC) Using outgrowth of CMA at visit 12 months as class, Yes: outgrowth of CMA at 12 months; no: no outgrowth of CMA at 12 months. Plot of discriminative features at (A) baseline visit; (B) visit 6 months; (C) visit 12 months. (DF) Pairwise comparison between visits within the group with outgrowth of CMA, using visit as class. (D) visit 6 months (T6M) versus baseline (T0M); (E) visit 12 months (T12M) versus baseline (T0M); (F) visit 12 months (T12M) versus visit 6 months (T6M). (GI) Pairwise comparison between visits within the group with persistent CMA, using visit as class. (G) visit 6 months (T6M) versus baseline (T0M); (H) visit 12 months (T12M) versus baseline (T0M); (I) visit 12 months (T12M) versus visit 6 months (T6M).
Figure 7
Figure 7
LEfSe analysis of human protein classes using an alpha value of 0.05 for the factorial Kruskal–Wallis test among classes and a threshold of 2.0 on the logarithmic LDA score for discriminative features. (A-C) Using outgrowth of CMA at visit 12 months as class, Yes: outgrowth of CMA at 12 months; no: no outgrowth of at 12 months. Plot of discriminative features at (A) baseline visit; (B) visit 6 months; (C) visit 12 months. (DF) Pairwise comparison between visits within the group with outgrowth of CMA, using visit as class. (D) visit 6 months (T6M) versus baseline (T0M); (E) visit 12 months (T12M) versus baseline (T0M); (F) visit 12 months (T12M) versus visit 6 months (T6M). (GI) Pairwise comparison between visits within the group with persistent CMA, using visit as class. (G) visit 6 months (T6M) versus baseline (T0M); (H) visit 12 months (T12M) versus baseline (T0M); (I) visit 12 months (T12M) versus visit 6 months (T6M).

References

    1. Martin R, et al. Early life: gut microbiota and immune development in infancy. Benef. Microbes. 2010;1:367–382. doi: 10.3920/BM2010.0027. - DOI - PubMed
    1. Tanaka M, Nakayama J. Development of the gut microbiota in infancy and its impact on health in later life. Allergol. Int. 2017;66:515–522. doi: 10.1016/j.alit.2017.07.010. - DOI - PubMed
    1. Backhed F, et al. Dynamics and stabilization of the human gut microbiome during the first year of life. Cell Host Microbe. 2015;17:852. doi: 10.1016/j.chom.2015.05.012. - DOI - PubMed
    1. Koenig JE, et al. Succession of microbial consortia in the developing infant gut microbiome. Proc. Natl. Acad. Sci. U. S. A. 2011;108(Suppl 1):4578–4585. doi: 10.1073/pnas.1000081107. - DOI - PMC - PubMed
    1. Lee E, et al. Dynamics of gut microbiota according to the delivery mode in healthy Korean infants. Allergy Asthma Immunol. Res. 2016;8:471–477. doi: 10.4168/aair.2016.8.5.471. - DOI - PMC - PubMed

Publication types

Substances