. 2023 Jul 25;14(1):4466.
doi: 10.1038/s41467-023-40208-x.

Compilation of reported protein changes in the brain in Alzheimer's disease

Affiliations

Compilation of reported protein changes in the brain in Alzheimer's disease

Manor Askenazi et al. Nat Commun. .

Abstract

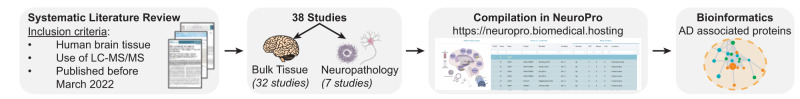
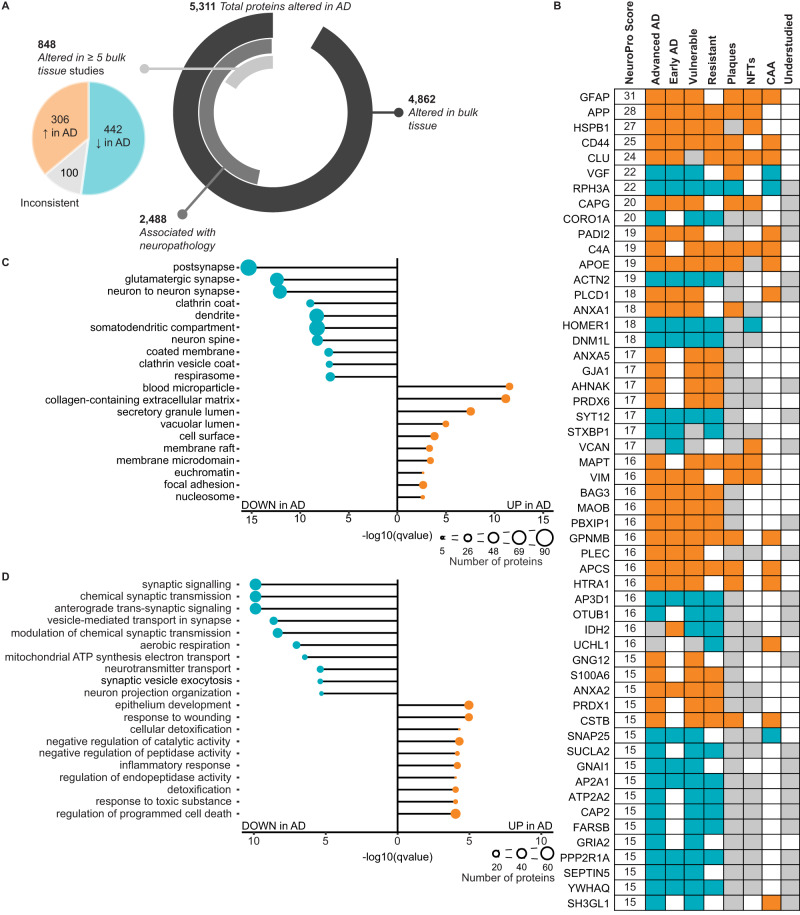
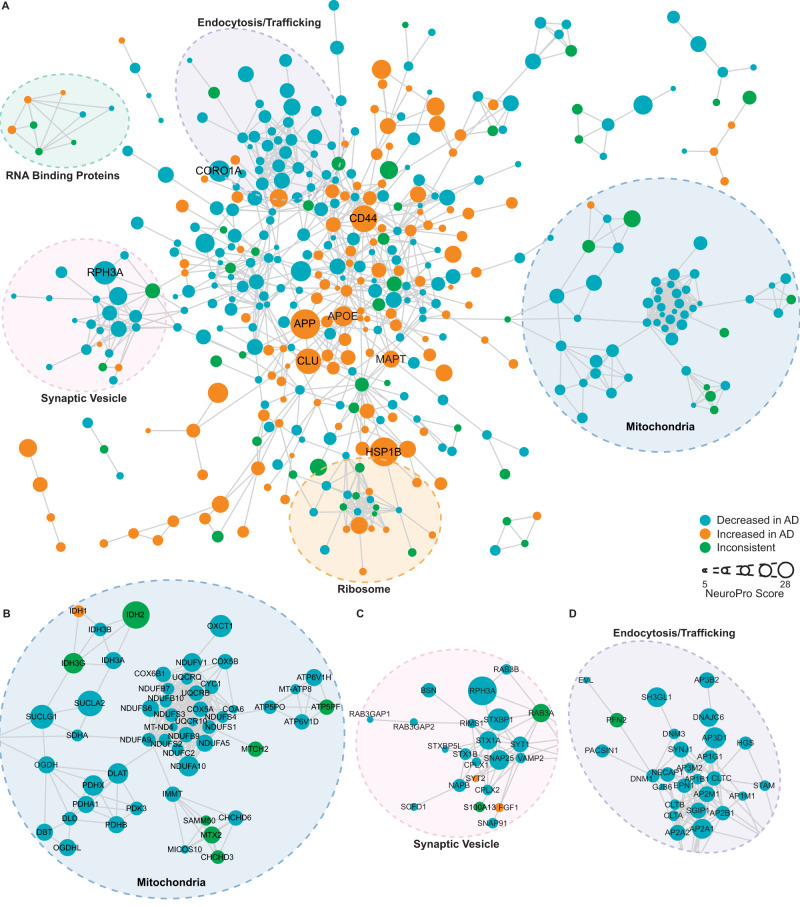
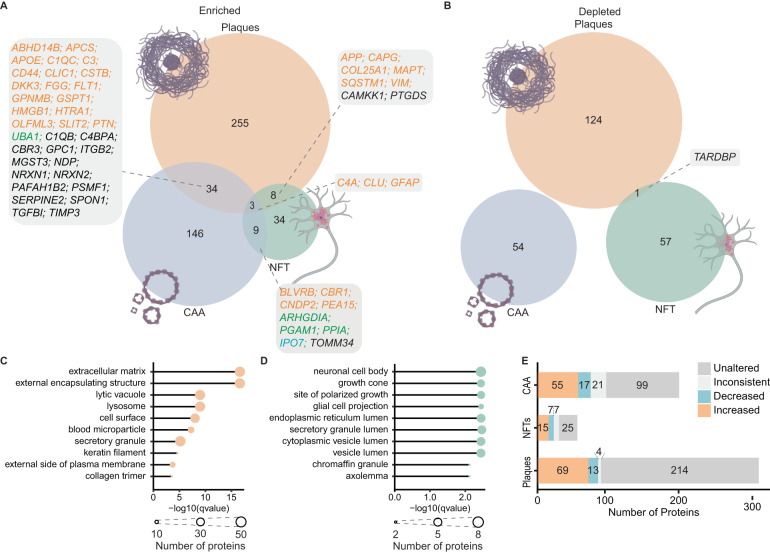
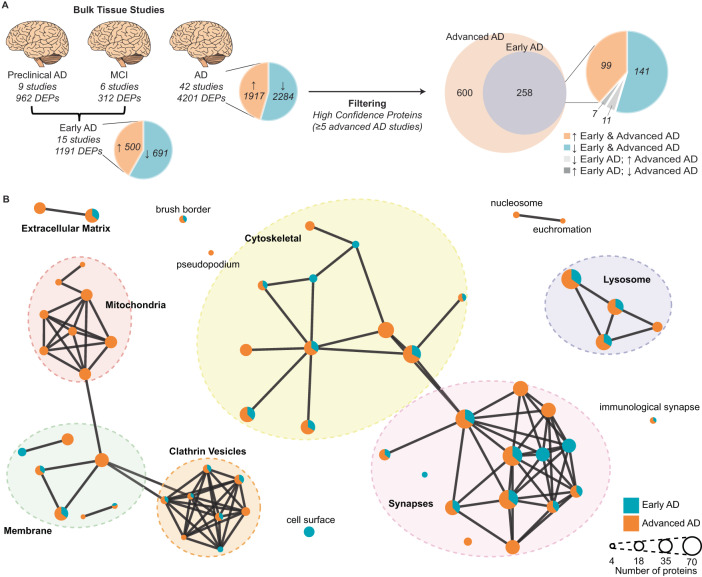
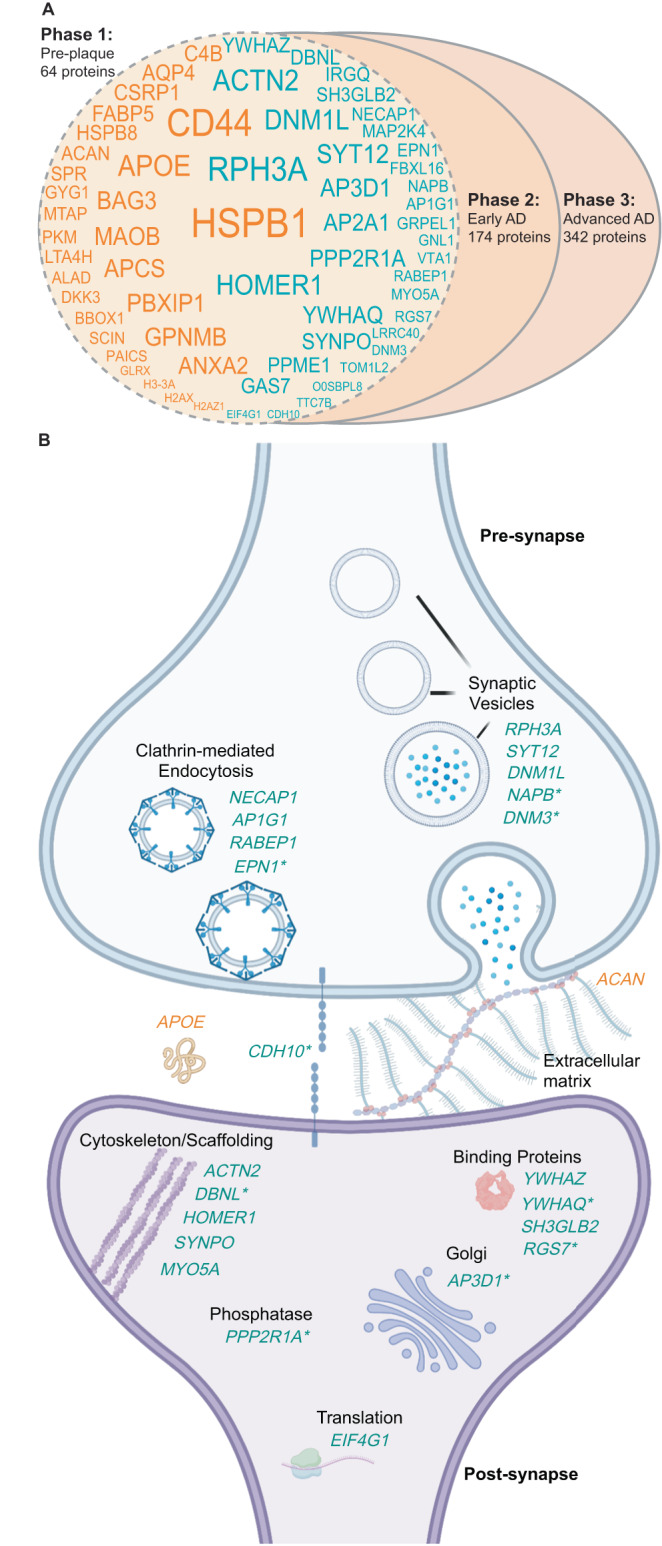
Proteomic studies of human Alzheimer's disease brain tissue have potential to identify protein changes that drive disease, and to identify new drug targets. Here, we analyse 38 published Alzheimer's disease proteomic studies, generating a map of protein changes in human brain tissue across thirteen brain regions, three disease stages (preclinical Alzheimer's disease, mild cognitive impairment, advanced Alzheimer's disease), and proteins enriched in amyloid plaques, neurofibrillary tangles, and cerebral amyloid angiopathy. Our dataset is compiled into a searchable database (NeuroPro). We found 848 proteins were consistently altered in 5 or more studies. Comparison of protein changes in early-stage and advanced Alzheimer's disease revealed proteins associated with synapse, vesicle, and lysosomal pathways show change early in disease, but widespread changes in mitochondrial associated protein expression change are only seen in advanced Alzheimer's disease. Protein changes were similar for brain regions considered vulnerable and regions considered resistant. This resource provides insight into Alzheimer's disease brain protein changes and highlights proteins of interest for further study.


Conflict of interest statement

The authors declare no competing interests.

Figures

Fig. 1
Fig. 1. Schematic of methods used in this study.
Note that one study reported two datasets, one of bulk tissue and one of a neuropathological lesion, therefore accounting for the discrepancy between the number of individual studies and the total number of studies.
Fig. 2
Fig. 2. Most consistent protein differences in AD human brain tissue.
A Breakdown of the number of protein differences in NeuroPro. The pie chart shows the breakdown of 848 proteins altered in ≥5 bulk tissue studies into consistently increased, consistently decreased and inconsistent subgroups. B 54 most common protein changes in AD. NeuroPro score: number of studies, a protein was significantly altered in. Orange: consistently increased. Blue: consistently decreased. Grey: inconsistently altered. Grey (understudied column): ≤10 studies linking protein with AD. C, D Most enriched GO terms for proteins (C cellular component; D biological process) that are consistently upregulated (306 proteins) or consistently downregulated (442 proteins) regulated in AD altered in ≥5 bulk tissue studies. AD Alzheimer’s disease, NFTs neurofibrillary tangles, CAA cerebral amyloid angiopathy.
Fig. 3
Fig. 3. Protein–protein interaction network for 848 proteins altered in ≥5 bulk tissue studies.
A Protein-protein interaction network for proteins altered in ≥5 bulk tissue studies. For simplicity, the network shows high confidence (score >0.7), physical interactions only, and only clusters ≥3 proteins shown. Node size reflects NeuroPro score and colour reflects a consistent directional change in AD (orange: consistently increased; blue: consistently decreased; green: inconsistently altered). Labelled proteins have a NeuroPro score ≥20 or key AD-associated proteins (APOE, MAPT). Higher magnification of three selected sub-networks is shown in BD.
Fig. 4
Fig. 4. Proteins present in neuropathological lesions.
A, B Comparison of proteins enriched and depleted in neuropathological lesions in AD respectively. Boxes specify proteins enriched in multiple lesions; text colour indicates whether proteins are consistently increased (orange), consistently decreased (blue), inconsistently altered (green) in ≥5 bulk tissue studies. Black text indicates proteins either unaltered or altered in <5 studies of AD bulk tissue. C, D Top enriched GO terms (cellular component) for enriched proteins in amyloid plaques (C) and neurofibrillary tangles (D). Node size shows the number of lesion-enriched proteins associated with a GO term. E Breakdown of directional changes of lesion-enriched proteins in AD bulk tissue. Proteins were increased/decreased if they were consistently altered in ≥5 bulk tissue studies. Proteins were inconsistent if they were inconsistently altered in ≥5 bulk tissue studies. Proteins were unaltered if they were altered in <5 studies of AD bulk tissue. NFTs neurofibrillary tangles, CAA cerebral amyloid angiopathy.
Fig. 5
Fig. 5. Comparison of protein changes in early-stage and advanced AD.
A Filtering method used to identify high-confidence early-stage and advanced AD protein changes. Proteins that were consistently altered in the same direction in each of the three AD clinical stages were identified (DEPs). Inconsistent proteins within a clinical stage were removed. Preclinical AD and MCI were combined to generate an early AD group. Pie charts specify the number of proteins that are increased/decreased in AD vs controls. Protein changes were filtered to identify high-confidence protein changes in early-stage and advanced AD (altered in ≥5 bulk tissue studies). B GO term (cellular component) network clusters, mapped to show clusters of similar GO terms which were manually annotated to show the overarching cellular component linked to major clusters of GO terms. Each node represents a unique GO term. Node colour shows the proportion of proteins for each enriched GO term that were altered in early-stage AD (blue) and advanced AD (orange). AD Alzheimer’s disease, MCI mild cognitive impairment, DEPs differently expressed proteins.
Fig. 6
Fig. 6. Comparison of protein changes in vulnerable and resistant brain regions.
A Filtering methodology used to identify high-confidence protein changes observed in vulnerable and resistant brain regions. Proteins were only considered high-confidence protein changes if they were altered in ≥5 bulk tissue studies. B distribution of protein changes into five types of protein changes: proteins increased (red) or decreased (yellow) in vulnerable regions only, proteins increased (green) or decreased (blue) in both vulnerable and resistant regions, proteins increased in resistant regions and decreased in vulnerable regions (purple). Proteins with the highest total NeuroPro score in each group are specified. AD: Alzheimer’s disease.
Fig. 7
Fig. 7. Proposed pre-neuropathology protein changes.
A High-confidence protein changes were mapped to three successive phases of the disease: pre-neuropathology phase, early AD phase and advanced AD phase. The 64 proposed pre-neuropathology protein changes are identified by gene IDs. Text size reflects the total number of studies each protein has been reported to be significantly altered in (i.e. NeuroPro score). Orange text: proteins consistently increased in AD vs controls; blue text: proteins consistently decreased in AD vs controls. B 24 pre-neuropathology protein changes were synaptic proteins. Schematic highlights simplified key locations of each of these 24 altered proteins based on GO terms, noting the caveat that many of these proteins have multiple functions and locations within the synapse, which is not represented here. Twenty-two synaptic proteins were downregulated (blue text), while two synaptic proteins were upregulated (orange text). * indicates proteins that are reported to be located in both the pre- and post-synapse. For simplification, each protein is only highlighted once in either the pre- or post-synapse. AD Alzheimer’s disease.

References

    1. Wilson DM, 3rd, et al. Hallmarks of neurodegenerative diseases. Cell. 2023;186:693–714. doi: 10.1016/j.cell.2022.12.032. - DOI - PubMed
    1. Johnson ECB, et al. Large-scale deep multi-layer analysis of Alzheimer’s disease brain reveals strong proteomic disease-related changes not observed at the RNA level. Nat. Neurosci. 2022;25:213–225. doi: 10.1038/s41593-021-00999-y. - DOI - PMC - PubMed
    1. Seyfried NT, et al. A multi-network approach identifies protein-specific co-expression in asymptomatic and symptomatic Alzheimer’s disease. Cell Syst. 2017;4:60–72 e64. doi: 10.1016/j.cels.2016.11.006. - DOI - PMC - PubMed
    1. Higginbotham L, et al. Integrated proteomics reveals brain-based cerebrospinal fluid biomarkers in asymptomatic and symptomatic Alzheimer’s disease. Sci. Adv. 2020;6:eaaz9360. doi: 10.1126/sciadv.aaz9360. - DOI - PMC - PubMed
    1. Bai B, et al. Proteomic landscape of Alzheimer’s disease: novel insights into pathogenesis and biomarker discovery. Mol. Neurodegener. 2021;16:55. doi: 10.1186/s13024-021-00474-z. - DOI - PMC - PubMed

Publication types