. 2023 Sep;17(9):1744-1762.
doi: 10.1002/1878-0261.13494. Epub 2023 Aug 9.

Epigenetic silencing of HTATIP2 in glioblastoma contributes to treatment resistance by enhancing nuclear translocation of the DNA repair protein MPG

Affiliations

Epigenetic silencing of HTATIP2 in glioblastoma contributes to treatment resistance by enhancing nuclear translocation of the DNA repair protein MPG

Thi Tham Nguyen et al. Mol Oncol. 2023 Sep.

Abstract

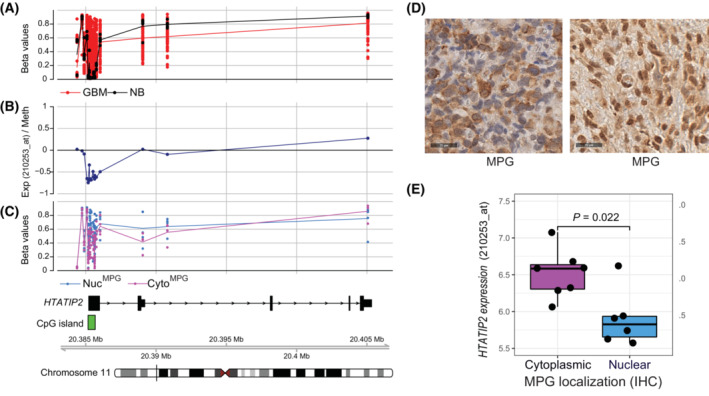
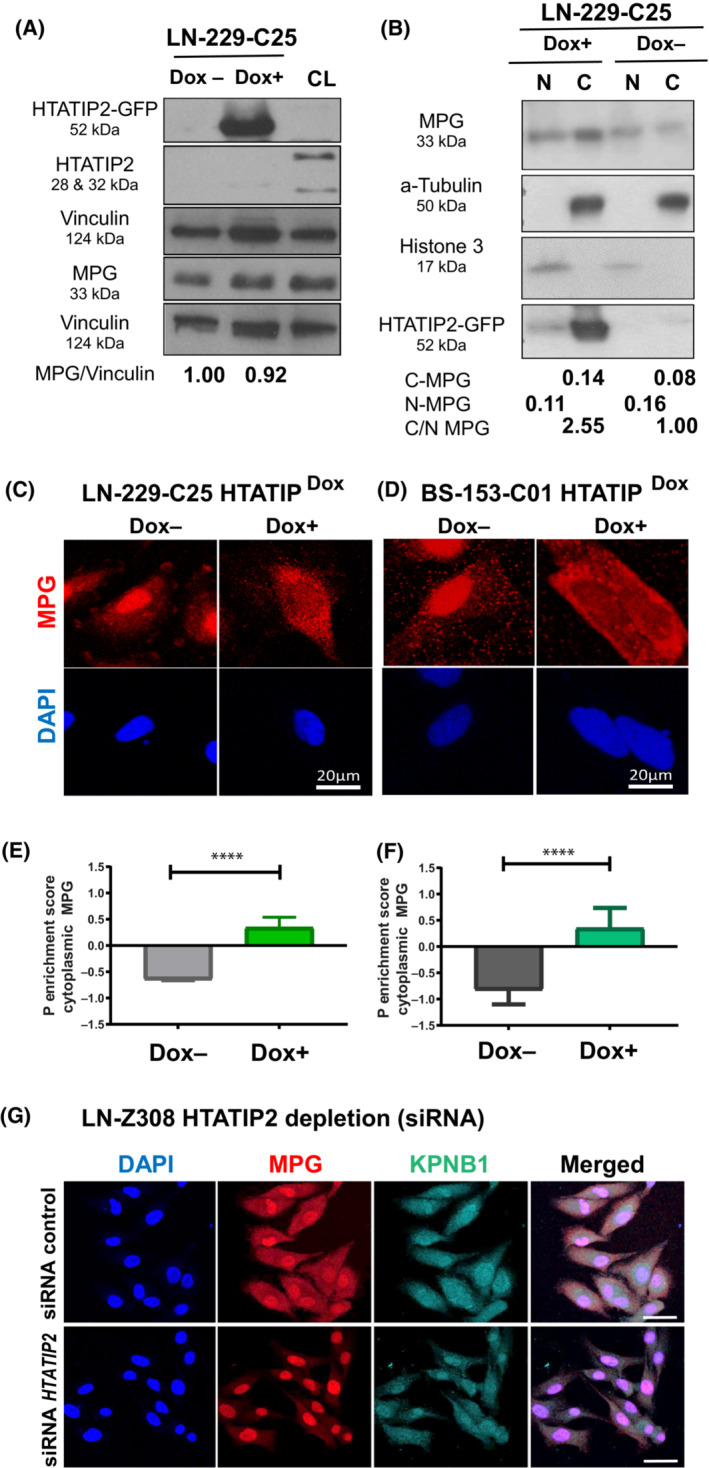
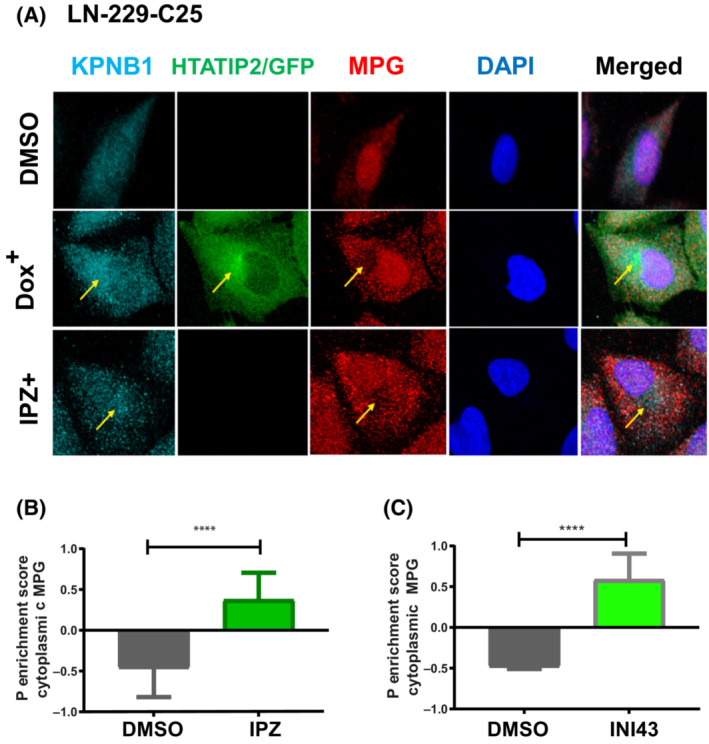
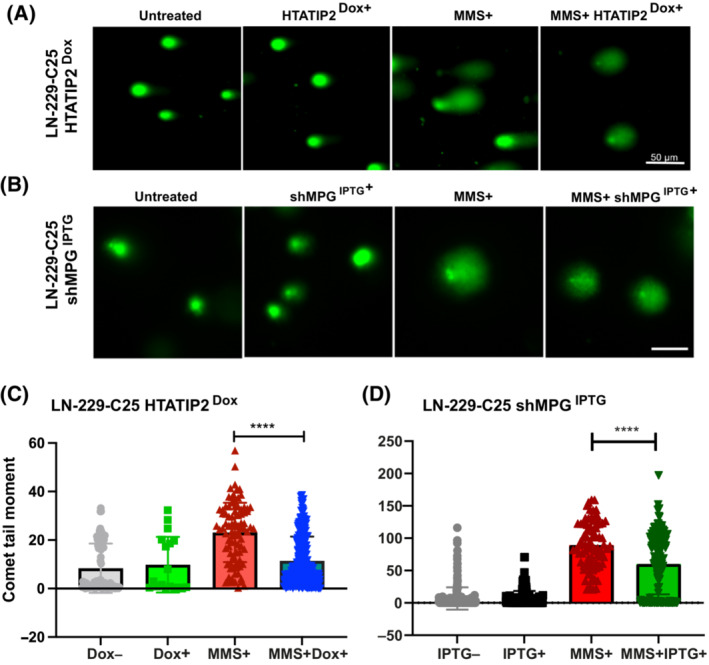
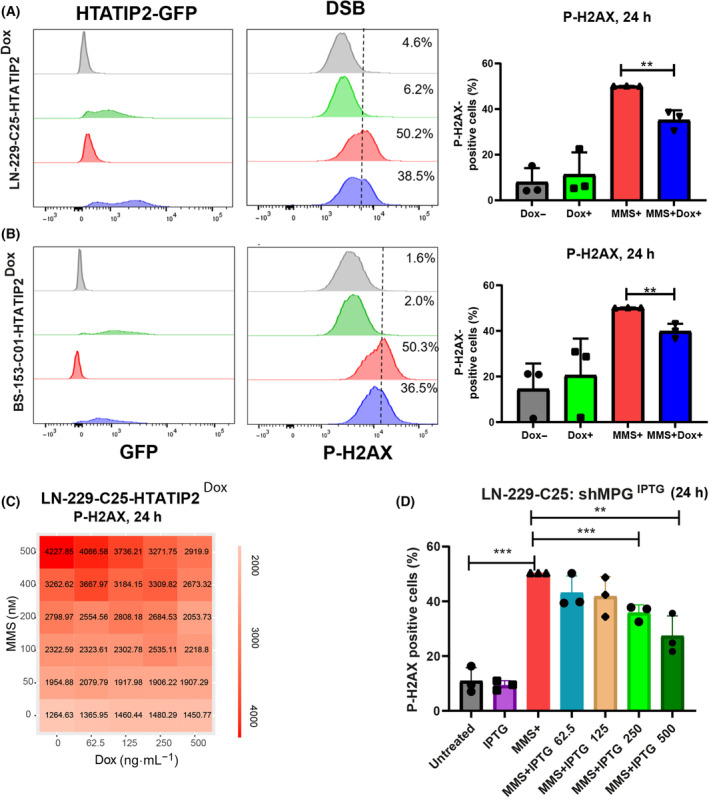
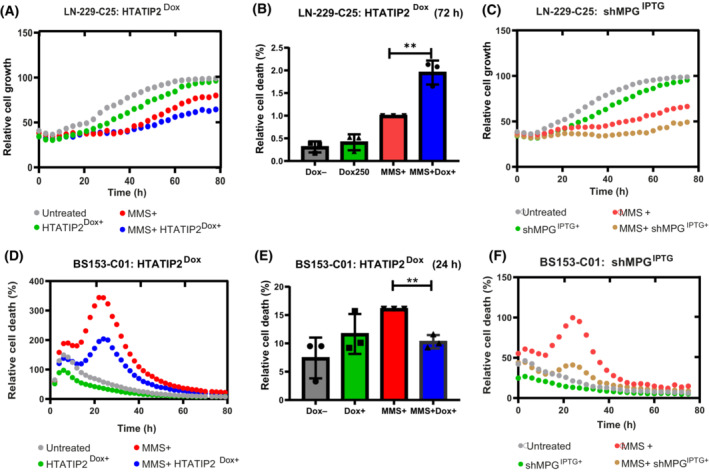
Glioblastoma, the most malignant brain tumor in adults, exhibits characteristic patterns of epigenetic alterations that await elucidation. The DNA methylome of glioblastoma revealed recurrent epigenetic silencing of HTATIP2, which encodes a negative regulator of importin β-mediated cytoplasmic-nuclear protein translocation. Its deregulation may thus alter the functionality of cancer-relevant nuclear proteins, such as the base excision repair (BER) enzyme N-methylpurine DNA glycosylase (MPG), which has been associated with treatment resistance in GBM. We found that induction of HTATIP2 expression in GBM cells leads to a significant shift of predominantly nuclear to cytoplasmic MPG, whereas depletion of endogenous HTATIP2 results in enhanced nuclear MPG localization. Reduced nuclear MPG localization, prompted by HTATIP2 expression or by depletion of MPG, yielded less phosphorylated-H2AX-positive cells upon treatment with an alkylating agent. This suggested reduced MPG-mediated formation of apurinic/apyrimidinic sites, leaving behind unrepaired DNA lesions, reflecting a reduced capacity of BER in response to the alkylating agent. Epigenetic silencing of HTATIP2 may thus increase nuclear localization of MPG, thereby enhancing the capacity of the glioblastoma cells to repair treatment-related lesions and contributing to treatment resistance.

Keywords: DNA damage repair; GBM; epigenetic silencing; nuclear-cytoplasmic translocation; treatment resistance.


Conflict of interest statement

The authors declare no conflict of interest.

Figures

Fig. 1
Fig. 1
Association of HTATIP2 methylation and expression with subcellular localization of MPG. (A) The β‐values of CpG methylation in the promoter of HTATIP2 is visualized for our cohort of GBM (n = 63, red) and nontumoral brain (NTB, n = 5, black) based on 450k data (chromosomal location of probes as indicated in the track at the bottom: Mb, megabase). Highly variable methylation is observed in the CpG island (indicated in green beneath panel C) associated with the HTATIP2 promoter in GBM, while no methylation is detected in NTB. (B) The functional methylation of the HTATIP2 promoter is indicated by a negative correlation (Spearman) between HTATIP2 expression (Affymetrix probe 210253_at, recognizes all transcripts) and DNA methylation (Exp/Meth) (black). (C) Illustration of CpG methylation of HTATIP2 (β‐values), stratified by subcellular localization of MPG, nuclear (Nuc, blue), or cytoplasmic (Cyto, pink), of the corresponding tumor tissues as classified by immunohistochemistry (IHC; TMA). (D) MPG expression (IHC, antibody against MPG) in two representative GBM of the cohort displaying either predominantly cytoplasmic (left panel) or nuclear (right panel) MPG, respectively (size bar 25 μm). (E) HTATIP2 expression (Affymetrix probe 210253_at) was significantly different between GBM samples with cytoplasmic (Cyto, pink) or nuclear MPG (Nuc, blue) (P = 0.022, Wilcoxon test), respectively, as determined by IHC of the corresponding samples on the TMA. Cytoplasmic MPG was associated with higher HTATIP2 expression. Illustrated by boxplot representation, where the rectangle, horizontal dark line, and vertical dark line correspond to the interquartile range (IQR), median, and the distance between minimal and maximal values, respectively. The observations (black points) are superimposed on the boxplot representation. GBM with both, nuclear and cytoplasmic expression were not included in the analyses shown in C and E.
Fig. 2
Fig. 2
Modulation of HTATIP2 expression affects MPG subcellular localization. (A) Expression of the HTATIP2‐GFP‐fusion protein (52 kDa) was induced by doxycycline (Dox+, 250 ng·mL−1) in clone 25 of LN‐229 (LN‐229‐C25‐HTATIP2Dox) for 48 h. LN‐229 does not express endogenous HTATIP2. Westerns were probed with antibodies (Abs) against HTATIP2, and MPG (33 kDa), and were normalized to Vinculin (124 kDa) of the corresponding blots. Positive control cell line (CL) for endogenous HTATIP2 (28 and 32 kDa) (LN‐464). MPG expression in presence or absence of HTATIP2‐induction was quantified by densitometry, suggesting no difference in overall MPG expression. (B) LN‐229‐C25‐HTATIP2Dox cells, induced with (Dox+) or not (Dox−), were fractionated and analyzed for relative nuclear (N) and cytoplasmic (C) MPG expression, normalizing the nuclear fraction (N) with Histone 3 (15 kDa) and the cytoplasmic fraction (C) with α‐Tubulin (50 kDa), suggesting increase in cytoplasmic versus nuclear MPG in presence of HTATIP2. The HTATIP2‐GFP‐fusion protein is detected with the anti‐GFP Ab. Representative western blots of three biological replicates are shown in A and B (corresponding full‐length western blots, Fig. S4). (C, D) MPG expression visualized by confocal microscopy (scale bar 20 μm) in cell lines LN‐229‐C25‐HTATIP2Dox and BS‐153‐C1‐HTATIP2Dox, respectively, with or without Dox‐induced expression of HTATIP2 (48 h). The corresponding P enrichment scores for cytoplasmic MPG localization were quantified by cell profiler, illustrated in E and F, respectively, for one of three biological replicates (E, n = 191 cells; F, n = 762 cells; t‐test: ****P < 0.0001). Mean values ± SD. (G) The localization of MPG expression is shown for LN‐Z308 upon silencing of endogenous HTATIP2 after 48 h by siRNA (s700), the most effective of three distinct siRNAs (scale bar 50 μm). Representative images are shown for DAPI, blue; MPG, red; KPNB1, cyan; or merged. LSM 880 microscopy. Cells were visualized by confocal microscopy image, KPNB1‐Alexa 647 (far red), MPG‐Alexa 555 (red), and DAPI (blue). One experiment has been performed, confirming the opposite effect on MPG localization upon knockdown of HTATIP2 as opposed to induction of HTATIP2 in LN‐229‐C25, as shown in A–F.
Fig. 3
Fig. 3
HTATIP2 depletion favors nuclear localization of MPG. (A) LN‐229‐C25‐HTATIP2Dox cells were either induced with Dox to express HTATIP2 or treated with 8 nm importazole (IPZ) for 48 h. Cells were visualized by confocal microscopy image using four channels: KPNB1‐Alexa 647 (far red), GFP (488, green), MPG‐Alexa 555 (red), and DAPI (blue). HTATIP2‐GFP localizes mainly in the cytoplasm, with a focus in proximity to the nuclear membrane. HTATIP2 co‐localized with importin β1 (KBNB1) at the location where MPG was excluded. Areas of interest are indicated by arrows. (B, C) Quantification of the P cytoplasmic enrichment score for MPG upon treatment with the pharmacologic inhibitors of KPNB1: (B) IPZ (8 nm); (C) INI‐43 (8 nm). INI‐43 treatment: n = 486 cells, t‐test: ****P < 0.0001. IPZ treatment: n = 263 cells, t‐test: ****P < 0.0001. Representative read‐out of one of three biological replicates, mean ± SD.
Fig. 4
Fig. 4
Induction of HTATIP2 or depletion of MPG reduce MMS‐induced SSB and AP sites. The formation of single‐strand breaks (SSBs) and abasic or apurinic/apyrimidinic (AP) sites were evaluated upon induction of HTATIP2 or depletion of MPG using the alkaline comet assay after 48 h of methylmethansulfonate (MMS) treatment. (A) Visualization of the comet tail moment under the four indicated experimental conditions using the Dox‐inducible cell line LN‐229‐C25 for HTATIP2 expression (image scale bar, 50 μm), and (B) the LN‐229‐C25 cell line with IPTG‐inducible anti‐MPG shRNA5IPTG (image scale bar, 50 μm). SSBs and AP sites were quantified as comet tail moment, defined by the distance from the center of the comet head to the center of the comet tail. (C) Analysis was performed on 478 cells (imagej, fiji, adding opencomet analysis tool). Treatment conditions: Untreated, gray; Dox (250 ng·mL−1), green; MMS (200 nm), red; and combination, blue. (D) Analysis was performed on a total of 208 images, comprising 713 cells. Treatment conditions: Untreated, gray; IPTG (500 ng·mL−1), black; MMS 200 nm, red; and the combination, green (C, D, ****P < 0.0001, t‐test, mean ± SD). The experiments were performed in triplicate. Control experiment for anti‐MPG shRNA with not‐targeting shRNA, see Fig. S9.
Fig. 5
Fig. 5
Induction of DSB by MMS in function of HTATIP2 and MPG expression. (A) Expression of HTATIP2‐GFP was induced by Dox in LN‐229‐25‐HTATIP2Dox (250 ng·L−1) and (B) BS‐153‐01‐HTATIP2Dox (500 ng·L−1) cells for 48 h, followed by methylmethansulfonate (MMS) treatment for 24 h (200 and 100 nm, respectively). Cells were subjected to FACS to quantify the P‐H2Ax signal and monitor HTATIP2‐GFP expression, shown for one representative experiment. The threshold was set at 50% for MMS‐treated cells. The experiments were performed in biological triplicates and quantified as the mean of three biological replicates normalized to MMS+, ±SD (**P < 0.01, t‐test). (C) A heatmap of P‐H2Ax signal in LN‐229‐25‐HTATIP2Dox visualizes the response to the combination treatment of increasing concentrations of MMS (0–500 nm) and dose‐dependent induction of HTATIP2 (Dox 0–500 ng·mL−1), quantified 24 h after treatment with MMS (experiment, Operetta high‐content screening). Decreasing levels of DSB were observed with increasing expression of HTATIP2. (D) MPG was depleted in LN‐229‐C25‐shMPGIPTG, in absence of HTATIP2, using the inducible shRNA5 against MPG. LN‐229‐C25‐shMPG IPTG cells were pretreated 48 h with ITPG, using a dose range from 0 to 500 ng·mL−1, followed by treatment with 200 nm MMS for 24 h. Downregulation of MPG significantly altered the formation of DSB, with decreasing P‐H2Ax levels detected by FACS. Depletion of HTATIP2 significantly affected the formation of MMS‐induced DSB, reflected in increased levels of P‐H2Ax as quantified by FACS. (D) Analysis of three technical replicates (**P < 0.01, ***P < 0.001, unpaired t‐test, mean normalized to MMS+, ±SD).
Fig. 6
Fig. 6
HTATIP2 modulates cell response to MMS treatment. (A) LN‐229‐C25‐HTATIP2Dox cells were treated with Dox for 48 h to induce HTATIP2 expression followed by treatment with methylmethansulfonate (MMS). Relative cell growth was determined by monitoring cell confluency over 72 h by phase contrast, taking images every 3 h (IncuCyte, representative experiment). Treatment conditions, untreated (gray), Dox (250 ng·mL−1) (green), MMS (200 nm) (red), and the combination (blue). (B) Cell death at 72 h in response to MMS was detected by Annexin V/APC apoptosis detection kit (**P < 0.01, t‐test, based on three biological replicates, mean normalized to MMS+, ±SD). (C) The shMPG was induced in LN‐229‐C25 shMPGIPTG followed by MMS treatment and the relative growth was determined as in (A) (untreated, gray; IPTG [62.5 ng·mL−1], green; MMS [200 nm], red; combination, yellow). (D) Relative cell death (Cytotox, red channel IncuCyte, representative experiment) in response to MMS treatment was monitored in BS153‐C01‐HTATIP2Dox over 72 h using the same treatment scheme as in (A) and inducing HTATIP2 with Dox (500 ng·L−1). (E) The relative cell death at 24 h was determined with Annexin V/PAC and quantified as in (B) (**P < 0.01, t‐test, based on three biological replicates, mean normalized to MMS+, ±SD). (F) Relative cell death in response to MMS was monitored in BS‐153‐C01‐shMPGIPTG as in (D) (Cytotox, red channel IncuCyte) over 72 h upon depletion of MPG (untreated, gray; IPTG [125 ng·mL−1], green; MMS [200 nm], red; combination, yellow).

Similar articles

Cited by

References

    1. Stupp R, Hegi ME, Mason WP, van den Bent MJ, Taphoorn MJ, Janzer RC, et al. Effects of radiotherapy with concomitant and adjuvant temozolomide versus radiotherapy alone on survival in glioblastoma in a randomised phase III study: 5‐year analysis of the EORTC‐NCIC trial. Lancet Oncol. 2009;10:459–466. 10.1016/S1470-2045(09)70025-7 - DOI - PubMed
    1. Weller M, van den Bent M, Preusser M, Le Rhun E, Tonn JC, Minniti G, et al. EANO guidelines on the diagnosis and treatment of diffuse gliomas of adulthood. Nat Rev Clin Oncol. 2021;18:170–186. 10.1038/s41571-020-00447-z - DOI - PMC - PubMed
    1. Chaligne R, Gaiti F, Silverbush D, Schiffman JS, Weisman HR, Kluegel L, et al. Epigenetic encoding, heritability and plasticity of glioma transcriptional cell states. Nat Genet. 2021;53:1469–1479. 10.1038/s41588-021-00927-7 - DOI - PMC - PubMed
    1. Hanahan D. Hallmarks of cancer: new dimensions. Cancer Discov. 2022;12:31–46. 10.1158/2159-8290.CD-21-1059 - DOI - PubMed
    1. Dong X, Deng Q, Nie X, Zhang M, Jia W, Chen C, et al. Downregulation of HTATIP2 expression is associated with promoter methylation and poor prognosis in glioma. Exp Mol Pathol. 2015;98:192–199. 10.1016/j.yexmp.2015.01.013 - DOI - PubMed

Publication types