. 2023 Oct;17(10):2126-2146.
doi: 10.1002/1878-0261.13497. Epub 2023 Aug 21.

Lysosome-dependent FOXA1 ubiquitination contributes to luminal lineage of advanced prostate cancer

Affiliations

Lysosome-dependent FOXA1 ubiquitination contributes to luminal lineage of advanced prostate cancer

Sherly I Celada et al. Mol Oncol. 2023 Oct.

Abstract

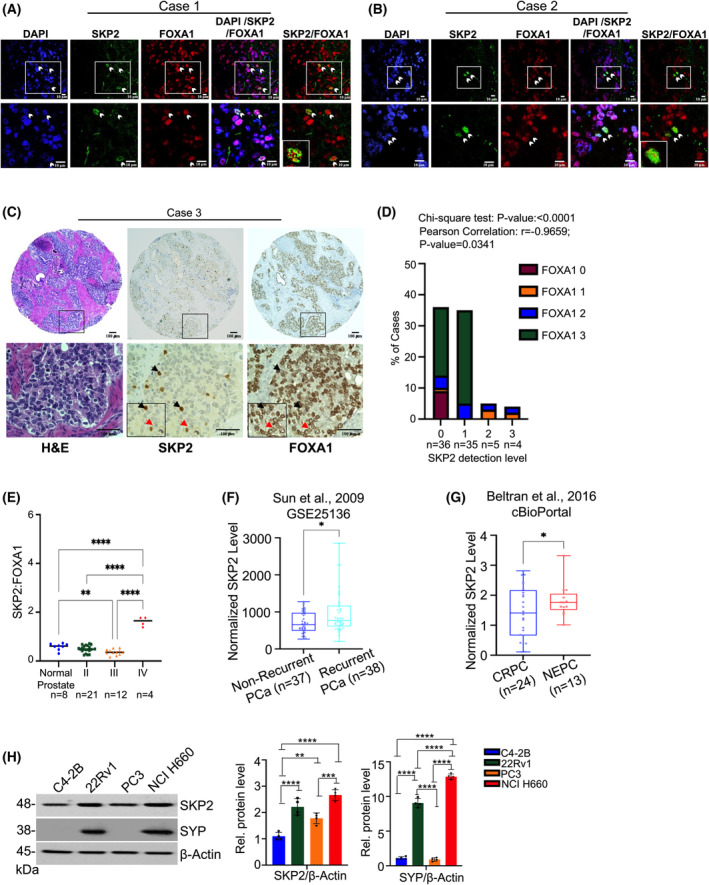
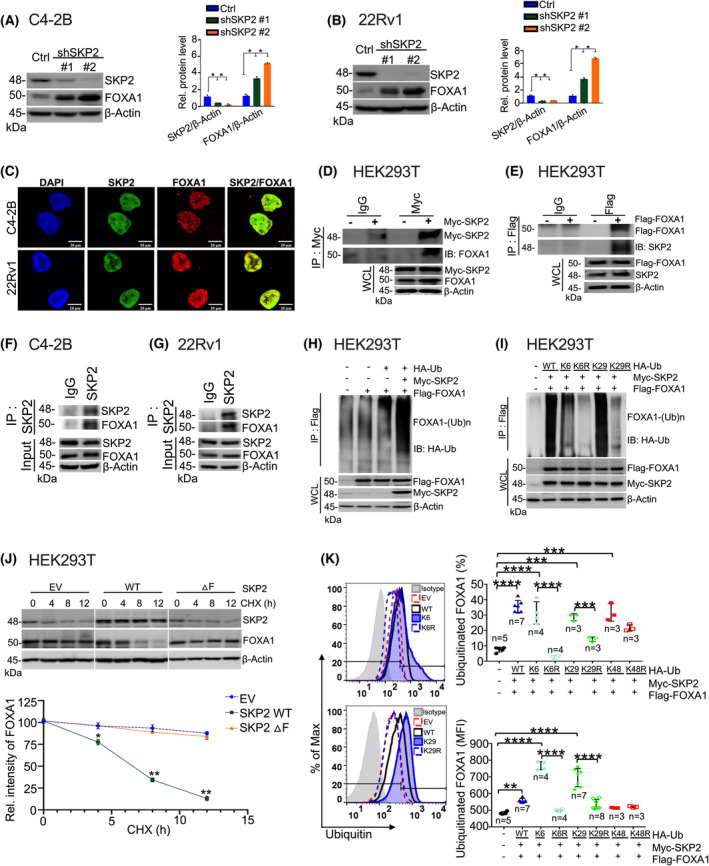
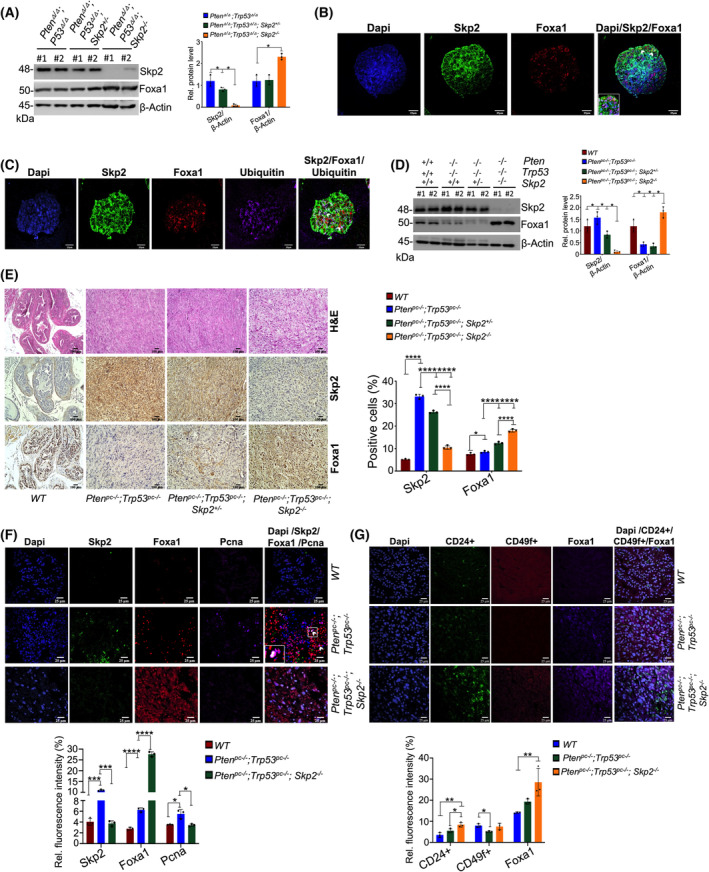
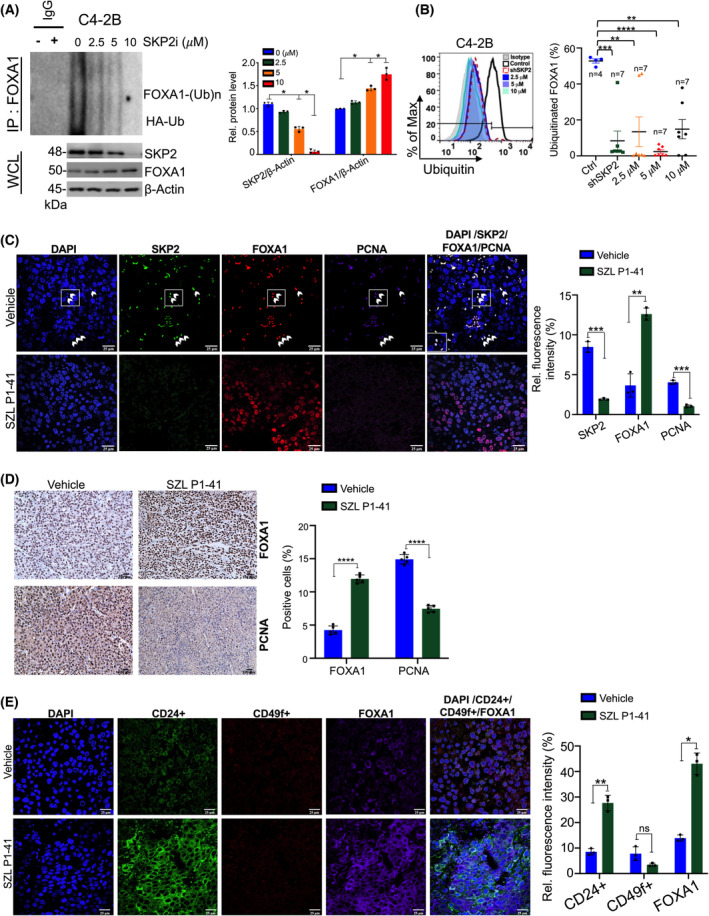
Changes in FOXA1 (forkhead box protein A1) protein levels are well associated with prostate cancer (PCa) progression. Unfortunately, direct targeting of FOXA1 in progressive PCa remains challenging due to variations in FOXA1 protein levels, increased FOXA1 mutations at different stages of PCa, and elusive post-translational FOXA1 regulating mechanisms. Here, we show that SKP2 (S-phase kinase-associated protein 2) catalyzes K6- and K29-linked polyubiquitination of FOXA1 for lysosomal-dependent degradation. Our data indicate increased SKP2:FOXA1 protein ratios in stage IV human PCa compared to stages I-III, together with a strong inverse correlation (r = -0.9659) between SKP2 and FOXA1 levels, suggesting that SKP2-FOXA1 protein interactions play a significant role in PCa progression. Prostate tumors of Pten/Trp53 mice displayed increased Skp2-Foxa1-Pcna signaling and colocalization, whereas disruption of the Skp2-Foxa1 interplay in Pten/Trp53/Skp2 triple-null mice demonstrated decreased Pcna levels and increased expression of Foxa1 and luminal positive cells. Treatment of xenograft mice with the SKP2 inhibitor SZL P1-41 decreased tumor proliferation, SKP2:FOXA1 ratios, and colocalization. Thus, our results highlight the significance of the SKP2-FOXA1 interplay on the luminal lineage in PCa and the potential of therapeutically targeting FOXA1 through SKP2 to improve PCa control.

Keywords: FOXA1; SKP2; luminal lineage; prostate cancer; ubiquitination.


Conflict of interest statement

The authors declare no conflict of interest.

Figures

Fig. 1
Fig. 1
Enhanced SKP2:FOXA1 interaction correlates with advanced PCa in human specimens. (A, B) Immunofluorescence (IF) images demonstrate the colocalization of SKP2 (green) and FOXA1 (red) proteins in primary prostate tumors. White arrows represent SKP2 and FOXA1 protein colocalization. Scale bars are 10 μm. (C) Immunohistochemistry (IHC) staining for SKP2 and FOXA1 in tissue microarray (TMA) of primary prostate tumors (n = 80). The representative images shown are H&E, SKP2, and FOXA1. Black arrows represent high SKP2 and low FOXA1 protein levels. Red arrows represent low SKP2 and high FOXA1 protein. Scale bars are 100 μm. (D) Intensity scores for SKP2 and FOXA1 staining were graded as 0, 1, 2, and 3 and the respective statistical significance was determined by Chi‐square test (Fig. S2) and Pearson correlation coefficient. (E) SKP2‐to‐FOXA1 ratio (SKP2:FOXA1) for IHC staining for SKP2 and FOXA1 TMA of primary prostate tumors (n = 45). (F, G) SKP2 mRNA expression is elevated in recurrent PCa (GSE25136; P = 0.0459) and neuroendocrine PCa (NEPC) (P = 0.0224). CRPC refers to Castration‐resistant PCa. Previously published PCa gene expression datasets were retrieved from GEO database (ncbi.nlm.nih.gov/gds/) and cbioportal (cbioportal.org), respectively. The corresponding normalized SKP2 levels were plotted. (H) Immunoblot analysis for several PCa cell lines. Quantification analysis of the relative protein levels for SKP2 and SYP is displayed to the right (n = 4). Comparison between groups was performed using Student's t‐test. Bars indicate SEM. *P < 0.05, **P < 0.01, ***P < 0.001, ****P < 0.0001.
Fig. 2
Fig. 2
SKP2 regulates FOXA1 through K6 and K29‐linked ubiquitination. (A, B) Immunoblot analysis displays FOXA1 elevation in C4‐2B (n = 3) and 22Rv1 (n = 3) cells upon SKP2 knockdown (KD) via shRNA. Quantification analysis of the relative protein levels for SKP2 and FOXA1 is displayed on the right. (C) Immunofluorescence (IF) images demonstrate the colocalization of endogenous SKP2 and FOXA1 proteins in C4‐2B and 22Rv1 PCa cells. Scale bars are 20 μm. (D, E) Co‐immunoprecipitation analysis displays a physical interaction for SKP2 and FOXA1 proteins in HEK293T (n = 3) cells using Myc‐tagged SKP2 or Flag‐tagged FOXA1. WCL indicates the whole cell lysates. (F, G) Immunoprecipitation analysis displays an interaction for endogenous SKP2 and FOXA1 proteins in C4‐2B (n = 3) and 22Rv1 (n = 3) PCa cells. (H) In vivo ubiquitination assay displays an increase in HA‐Ub‐linked ubiquitination for FOXA1 by Myc‐SKP2 in HEK293T (n = 3) cells. (I) In vivo ubiquitination assay demonstrates a reduction in ubiquitination for K6R and K29R mutants (n = 3). (J) HEK293T cells were co‐transfected with Flag‐tagged FOXA1, HA‐ubiquitin (wild type, WT), and WT‐Myc‐SKP2 or a ▵F SKP2 mutant before being treated with Cycloheximide (CHX; 100 μg·mL−1) protein synthesis inhibitor for the indicated time points (h, hours). EV refers to empty vector. Lower panel is the corresponding plot for FOXA1 protein intensity (n = 3). (K) The percent and mean fluorescence intensity (MFI) of FOXA1 ubiquitination in HEK293T cells after overexpression of Myc‐SKP2, Flag‐FOXA1, and HA‐Ubiquitin WT or mutants. Colored points represent number of replicates per group. Comparisons between groups were analyzed using paired two‐tailed Student's t‐test. Bars indicate SEM. *P < 0.05, **P < 0.01, ***P < 0.001, ****P < 0.0001.
Fig. 3
Fig. 3
Skp2 Abrogation elevates Foxa1 levels in vivo in mouse models. (A) Immunoblot analysis shows the effects of Skp2 on Foxa1 protein levels in mouse embryonic fibroblasts (MEFs) with indicated genotypes. Quantification of protein levels is relative to beta‐Actin and displayed in the right panel (n = 3). (B, C) Immunofluorescence (IF) images show colocalization among Skp2, Foxa1, and ubiquitin in murine prostate organoids (n = 3). White arrows indicate colocalization for Skp2, Foxa1, and Ubiquitin. Scale bars are 25 μm. (D) Western blotting analysis of Skp2 and Foxa1 protein levels for anterior prostate (AP) tissues of mice with the indicated genotypes. Quantification analysis for the corresponding protein expression is shown in the right panel (n = 3). (E) Immunohistochemistry (IHC) staining of Skp2 and Foxa1 in prostate tissues of mice with the indicated genotypes. The side panel displays a quantification analysis for IHC staining (n = 3). Scale bars are 100 μm. (F) IF images show colocalization (white arrows) among Skp2, Foxa1, and Pcna (proliferating cell nuclear antigen) prostate tissues in Pten pc−/− ; Trp53 pc−/− mutant mice, while Skp2 loss in Pten pc−/− ; Trp53 pc−/− ; Skp2 −/− mutant mice has decreased Skp2, Foxa1, and Pcna colocalization (n = 3). Scale bars are 25 μm. (G) IF images for luminal (CD24+) and basal (CD49f+) lineage markers in Pten pc−/− ; Trp53 pc−/− and Pten pc−/− ; Trp53 pc−/− ; Skp2 −/− mutant mice (n = 3). Scale bars are 25 μm. Comparison between groups was performed using Student's t‐test. Bars indicate SEM. *P < 0.05, **P < 0.01, ***P < 0.001, ****P < 0.0001.
Fig. 4
Fig. 4
SKP2 alters FOXA1 ubiquitination levels in human prostate cancer cells in a dose‐dependent manner. (A) Endogenous ubiquitination of FOXA1 in C4‐2B proceeding SKP2 inhibition using SZL P1‐41 at different concentrations (μm). Samples were collected and subjected to in vivo ubiquitination and western blot analysis (n = 3). (B) FOXA1 ubiquitination profile using flow cytometry for vehicle, SKP2 KD, and SKP2 inhibition using SZL P1‐41 for C4‐2B. Representative histogram and percent ubiquitination of FOXA1 are plotted. Colored points represent number of replicates per group. (C) C4‐2B xenograft mice received vehicle (DMSO) or SKP2 inhibitor SZL P1‐41 (30 mg·kg−1; three times per week, intraperitoneal, i.p. injection) for 30 days. Immunofluorescence (IF) staining displays increased colocalization (white arrows) amongst SKP2, FOXA1, and PCNA for C4‐2B xenograft vehicle tissues, while exposure to SZL P1‐41 treatment reduced SKP2 and PCNA levels (n = 3). Scale bars are 25 μm. (D) C4‐2B xenograft tissue sections were subjected to Immunohistochemistry (IHC) staining with the indicated antibodies (n = 5). Scale bars are 100 μm. (E) IF luminal (CD24+) and basal (CD49f+) lineage staining in C4‐2B vehicle and SZL P1‐41‐treated mice (n = 3). Scale bars are 25 μm. Comparison between groups was performed using Student's t‐test. Bars indicate SEM. *P < 0.05, **P < 0.01, ***P < 0.001, ****P < 0.0001.
Fig. 5
Fig. 5
FOXA1 Regulation by SKP2 is a lysosomal‐dependent event. (A) The effects of Chloroquine on FOXA1 levels in C4‐2B cells. Cells were subjected to MG132 or chloroquine treatment at the indicated concentrations (μm). Lower panels display the quantification for FOXA1 protein levels (n = 3). (B) The effects of bafilomycin A1 (BA1) treatment at the indicated concentrations (μm) on FOXA1 protein levels in C4‐2B and 22Rv1 cells. Quantification for FOXA1 levels is displayed below (n = 3). (C) Immunoblot demonstrating the effects of lysosomal marker (LC3, LAMP1, and LAMP2) KD on FOXA1 protein levels in C4‐2B and 22Rv1 cells. Lower panels demonstrate quantified FOXA1 protein levels (n = 3). (D) Immunofluorescence (IF) images display an increase in LAMP2 (lysosome‐associated membrane glycoprotein) levels in C4‐2B cells upon Myc‐SKP2 overexpression (n = 3). Scale bars are 20 μm. (E) CellLight Lysosome‐GFP, BacMam 2.0, labeling of lysosomal activity in association with FOXA1 in C4‐2B (n = 3) and 22Rv1 (n = 3). White arrows indicate colocalization between the lysosome and FOXA1. Scale bars are 25 μm. (F) IF images show the impact of Skp2 restoration on Lamp2 in Pten/Trp53/Skp2 triple‐null mouse embryonic fibroblasts (MEFs) proceeding transient overexpression of Myc‐SKP2 (n = 3). White arrows indicate colocalization amongst Lamp2, FOXA1, and Skp2. Scale bars are 25 μm. (G) qRT‐PCR analysis of Skp2 and the lysosomal genes Hexb and Mcoln1 in Pten/Trp53/Skp2 triple‐null MEFs proceeding the transient overexpression of Myc‐SKP2 or an empty vector (EV). Results represent relative expression values to the housekeeping gene beta‐Actin (n = 3). (H) Western blotting analysis of Skp2, FOXA1, and Lamp2 levels for Pten/Trp53/Skp2 triple‐null MEFs proceeding overexpression of Myc‐SKP2 (0–2 μg). Quantification analysis for the corresponding relative protein levels is shown in the right panel (n = 3). (I) A working model on the K6‐ and K29‐linked ubiquitination of FOXA1 by SKP2 in lysosomal degradation. Comparison between groups was performed using Student's t‐test. Bars indicate SEM. *P < 0.05, **P < 0.01, ***P < 0.001, ****P < 0.0001.

References

    1. Siegel RL, Miller KD, Wagle NS, Jemal A. Cancer statistics. CA Cancer J Clin. 2023;73(2023):17–48. - PubMed
    1. Sung H, Ferlay J, Siegel RL, Laversanne M, Soerjomataram I, Jemal A, et al. Global cancer statistics 2020: GLOBOCAN estimates of incidence and mortality worldwide for 36 cancers in 185 countries. CA Cancer J Clin. 2021;71:209–249. - PubMed
    1. Yuan X, Cai C, Chen S, Chen S, Yu Z, Balk SP. Androgen receptor functions in castration‐resistant prostate cancer and mechanisms of resistance to new agents targeting the androgen axis. Oncogene. 2014;33:2815–2825. - PMC - PubMed
    1. Zhao XY, Malloy PJ, Krishnan AV, Swami S, Navone NM, Peehl DM, et al. Glucocorticoids can promote androgen‐independent growth of prostate cancer cells through a mutated androgen receptor. Nat Med. 2000;6:703–706. - PubMed
    1. Lee CF, Chen YA, Hernandez E, Pong RC, Ma S, Hofstad M, et al. The central role of sphingosine kinase 1 in the development of neuroendocrine prostate cancer (NEPC): a new targeted therapy of NEPC. Clin Transl Med. 2022;12:e695. - PMC - PubMed

Publication types

Substances