

ATR inhibition augments the efficacy of lurbinectedin in small-cell lung cancer
- PMID: 37491889
- PMCID: PMC10405061
- DOI: 10.15252/emmm.202217313
ATR inhibition augments the efficacy of lurbinectedin in small-cell lung cancer
Erratum in
-
Author Correction: ATR inhibition augments the efficacy of lurbinectedin in small-cell lung cancer.EMBO Mol Med. 2024 Mar;16(3):664. doi: 10.1038/s44321-024-00029-x. EMBO Mol Med. 2024. PMID: 38366163 Free PMC article.
Abstract
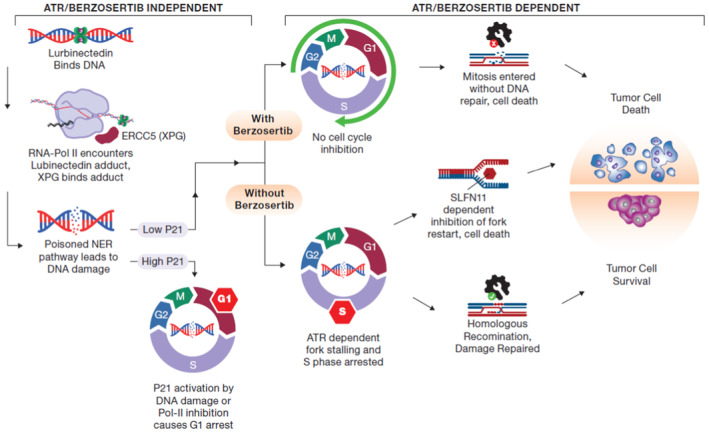
Small-cell lung cancer (SCLC) is the most lethal type of lung cancer. Specifically, MYC-driven non-neuroendocrine SCLC is particularly resistant to standard therapies. Lurbinectedin was recently approved for the treatment of relapsed SCLC, but combinatorial approaches are needed to increase the depth and duration of responses to lurbinectedin. Using high-throughput screens, we found inhibitors of ataxia telangiectasia mutated and rad3 related (ATR) as the most effective agents for augmenting lurbinectedin efficacy. First-in-class ATR inhibitor berzosertib synergized with lurbinectedin in multiple SCLC cell lines, organoid, and in vivo models. Mechanistically, ATR inhibition abrogated S-phase arrest induced by lurbinectedin and forced cell cycle progression causing mitotic catastrophe and cell death. High CDKN1A/p21 expression was associated with decreased synergy due to G1 arrest, while increased levels of ERCC5/XPG were predictive of increased combination efficacy. Importantly, MYC-driven non-neuroendocrine tumors which are resistant to first-line therapies show reduced CDKN1A/p21 expression and increased ERCC5/XPG indicating they are primed for response to lurbinectedin-berzosertib combination. The combination is being assessed in a clinical trial NCT04802174.
Keywords: ATR inhibitor; SCLC; biomarker; neuroendocrine; synergy.
© 2023 The Authors. Published under the terms of the CC BY 4.0 license. This article has been contributed to by U.S. Government employees and their work is in the public domain in the USA.
Conflict of interest statement
This work was supported by the intramural programs of the Center for Cancer Research, NCI (ZIA BC 011793). AZ and FTZ are employees of Merck KGaA, Darmstadt, Germany. BE and C‐FL are employees of the EMD Serono Research & Development Institute Inc., Billerica, MA, USA; a business of Merck KGaA, Darmstadt, Germany. AT and YP report research funding to the institution from the following entities: EMD Serono (CrossRef Funder ID:
Figures
- A
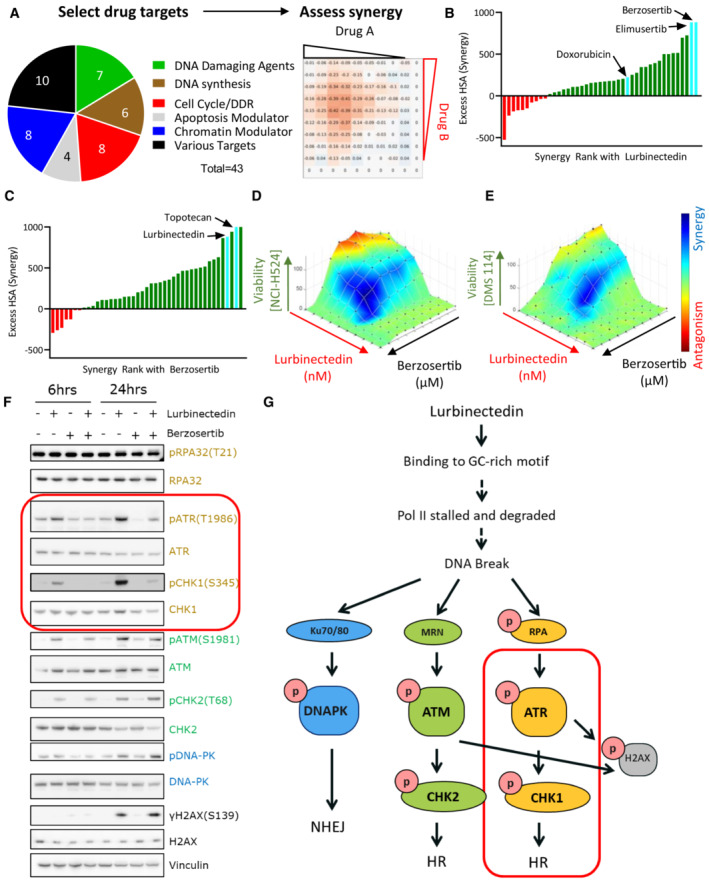
A synergy screen was previously performed with 43 agents targeting multiple pathways in combination with each other. NCI‐H446 SCLC cells were treated with drugs in a 10 × 10 matrix format, viability was assessed using Cell Titer Glo, and synergy was assessed using highest single‐agent (HSA).
- B
Lurbinectedin synergy was ranked based on HSA synergy values. The highest synergy was observed with two ATR inhibitors, berzosertib and elimusertib, both of which displayed more synergy than doxorubicin.
- C
Berzosertib synergy with therapeutics ranked based on synergy. Topotecan and lurbinectedin both strongly synergized with berzosertib.
- D, E
Lurbinectedin and berzosertib synergized in SCLC cell lines NCI‐H524 and DMS 114. Synergy of lurbinectedin and berzosertib was assessed by treating these drugs in a 10 × 10 matrix format for 72 h in NCI‐H524 (D) (HSA 410.7) and DMS 114 cells (E) (HSA 286.3). Synergy was calculated by adding HSA across all combinations in the matrix (100 combinations, replicates = 3, n = 1). Synergy is denoted by blue and antagonism in red.
- F
Multiple DNA damage response pathways were activated by lurbinectedin. Treatment with the ATR inhibitor berzosertib specifically inhibited the activation of ATR and its downstream target CHK1 (both targets indicated by red box). DMS 114 cells were treated with lurbinectedin (1 nM) ± berzosertib (1 μM) for 6 or 24 h, and targets were assessed by immunoblotting.
- G
Lurbinectedin activated all three key DNA damage response proteins, DNA‐PK, ATR, and ATM. Berzosertib is effective at inhibiting the activation of ATR and downstream ATR target CHK1 (indicated by red box), with less notable effects on other DNA damage repair pathways.
- A
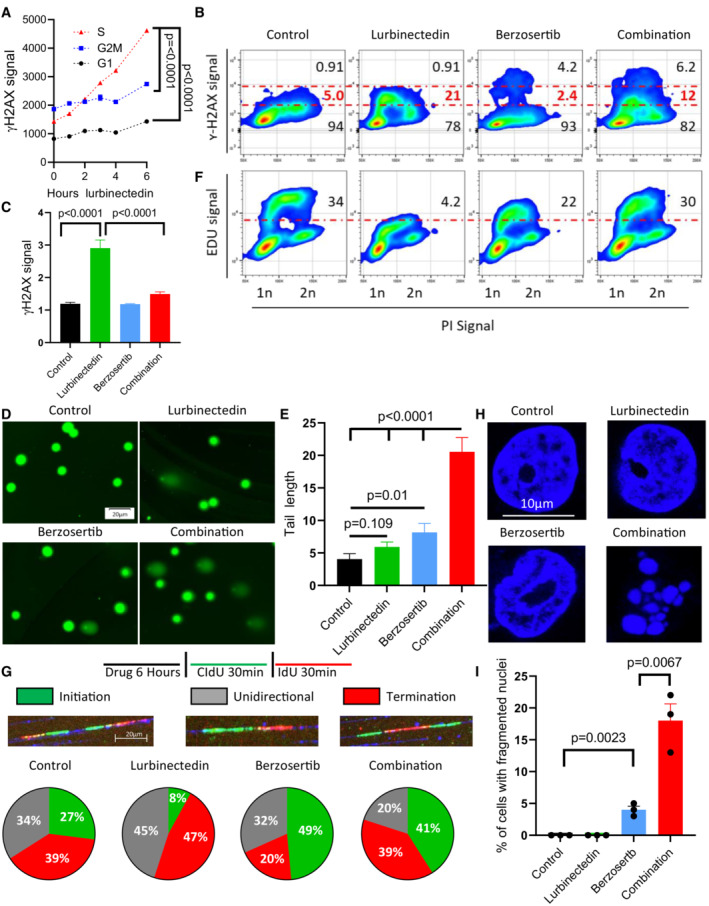
Lurbinectedin induced changes to γH2AX across different phases of the cell cycle, with the greatest degree of activation in S‐phase. DMS 114 cells were treated with 1 nM lurbinectedin for 1 to 6 h and γH2AX induction was assessed using flow cytometry; four replicates of 10,000 cells for each timepoint were assessed, and error bars represent SEM, n = 2. Cell cycle was assessed using propidium iodide.
- B
Lurbinectedin treatment increased γH2AX induction, while berzosertib treatment caused a small portion of cells to display increased γH2AX signal. Berzosertib cotreatment with lurbinectedin caused a decrease in γH2AX accumulation for the majority of cells leading to a decreased median accumulation of γH2AX, however, an increase in γH2AX in a smaller portion of cells led to an increased average accumulation (averages and medians are shown in Fig EV1D–F). DMS 114 cells were treated with ±1 nM lurbinectedin ±2 μM berzosertib for 6 h γH2AX induction was assessed using flow cytometry. 10 mM EdU was added for the last hour prior to collection (assessed Fig 2F). Numbers on the graph indicate the average percent of cells across four replicates of 10,000 cells with low, medium, or high γH2AX, n = 3.
- C
Lurbinectedin treatment increased γH2AX induction, which was reduced with berzosertib treatment. γH2AX induction was assessed using immunofluorescence in DMS 114 cells were treated with ±1 nM lurbinectedin ±2 μM berzosertib for 6 h. Quantification is from 100 to 150 cells per treatment, with error bars indicating SEM, comparisons were made using an unpaired two‐tailed Student's t‐test in PRISM, n = 3. Representative images for this experiment are in Appendix Fig S2A.
- D, E
Combination of lurbinectedin and berzosertib caused DNA damage. DMS 114 cells were treated with ±1 nM lurbinectedin ±2 μM berzosertib for 6 h and total DNA damage was assessed using an alkaline comet assay. These data represent average tail length for each group with 150–250 cells measured per group, n = 3 error bars represent SEM, P‐values represent unpaired two‐tailed Student's t‐tests performed in PRISM.
- F
Lurbinectedin treatment caused a decrease in DNA replication as assessed by EdU incorporation while berzosertib cotreatment largely rescued this phenotype. Numbers represent the average percent of cells across four replicates with high EdU incorporation indicating functional DNA replication, n = 3. These cells are the same as assessed in Fig 2B.
- G
Lurbinectedin treatment inhibited fork initiation, an effect that was rescued by the addition of berzosertib. DMS 114 cells were treated with ±1 nM lurbinectedin ±2 μM berzosertib for 6 h, and using DNA combing, we assessed motifs of incorporation of IdU and CIdU indicating initiation, termination, or unidirectional DNA forks. Forks were assessed and verified individually to avoid algorithmic assessment, with 100–200 forks quantified per group n = 2.
- H, I
Berzosertib treatment alone caused a small portion of cells to undergo mitotic catastrophe, however, cotreatment of lurbinectedin and berzosertib caused a large portion of cells to undergo mitotic catastrophe. DMS 114 cells were treated with ±1 nM lurbinectedin ±2 μM berzosertib for 6 h with the final 3 h being in the presence of nocodazole followed by release from all drugs and 45 min of continued growth. Cells that had undergone mitotic catastrophe were assessed as those which were multinucleated. Representative images (H) and quantification of percent of cells that underwent mitotic catastrophe (I). Graph represents average of three separate experiments with statistics determined from assessing 100 nuclei per group, error bars represent SEM, and P‐values are indicative of unpaired two‐tailed Student's t‐tests performed in PRISM.
- A
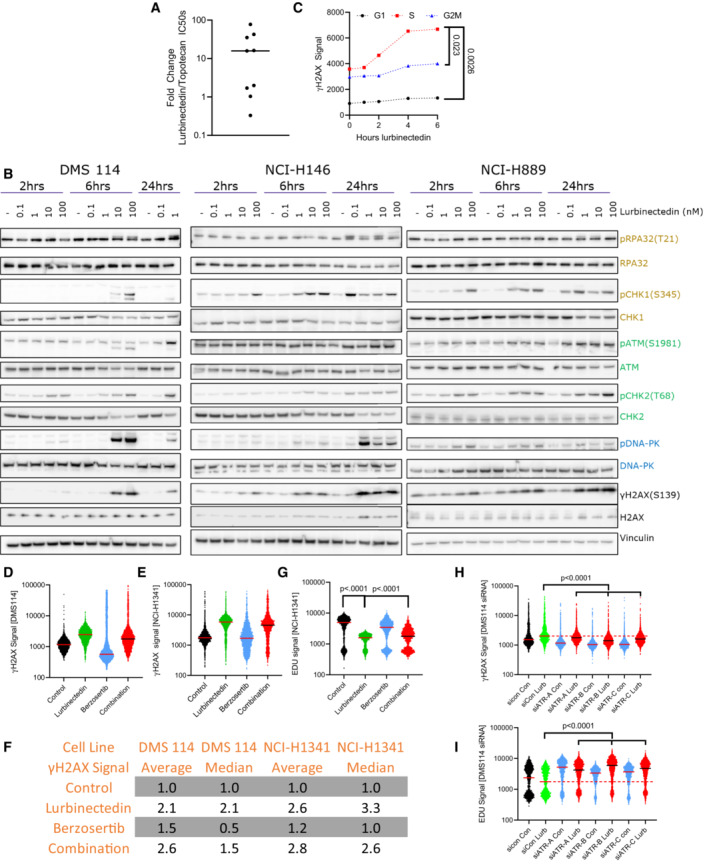
The majority of SCLC cell lines were significantly more sensitive to lurbinectedin as compared to topotecan. IC50s for topotecan and lurbinectedin were assessed in nine SCLC cell lines (biological replicates = 2, technical replicates = 3).
- B
Lurbinectedin induced the ATR (yellow/gold), ATM (green), and DNA‐PK (blue) damage repair pathways as well as inducing γH2AX (DNA damage marker) in all three cell lines. DMS 114, NCI‐H146, and NCI‐H889 SCLC cell lines were treated with lurbinectedin at various concentrations for 2, 6, and 24 h. DMS 114 cells are lacking 24 h lurbinectedin concentrations of 10 and 100 nM due to excessive cell death under these conditions in the DMS 114 cell line.
- C
Lurbinectedin caused the greatest increase in γH2AX induction in S‐phase cells in NCI‐H1341 cells. NCI‐H1341 cells (SCLC cell line) were treated with 1 nM lurbinectedin from 1 to 6 h and γH2AX induction was assessed using FACS, four technical replicates of 10,000 cells for each timepoint were assessed; biological replicates = 3. Cell cycle was assessed using propidium iodide.
- D–G
The average γH2AX signal increased with the addition of berzosertib to lurbinectedin (likely due to a small portion of cells as demonstrated in Fig 2B) while the median decreased indicating the majority of cells displayed decreased γH2AX signal. DMS 114 and NCI‐H1341 cells were treated with ±1 nM lurbinectedin ±2 μM berzosertib for 6 h, for the last hour EDU was added. S‐phase cells were selected using PI content in FlowJo. γH2AX signal of S‐phase cells is represented with a line at the median. (F) Average and median of ~10,000 cells for all groups were assessed and compared to control for both NCI‐H1341 and DMS 114, biological replicates = 3. (G) NCI‐H1341 cells displayed decreased EDU signal with the addition of lurbinectedin, this was partially rescued with cotreatment with berzosertib. Comparisons were made using an unpaired two‐tailed Student's t‐test in PRISM; DMS 114 data are displayed in Fig 2B.
- H, I
DMS 114 cells were treated with siRNA against ATR or Control siRNA. Three days later, they were treated with ±1 nM lurbinectedin ±2 μM berzosertib for 6 h, for the last hour EDU was added. γH2AX and EdU signal of S‐phase cells is represented with a line at the median. A total of 10,000 cells for each condition were assessed, biological replicates = 2.
- A, B
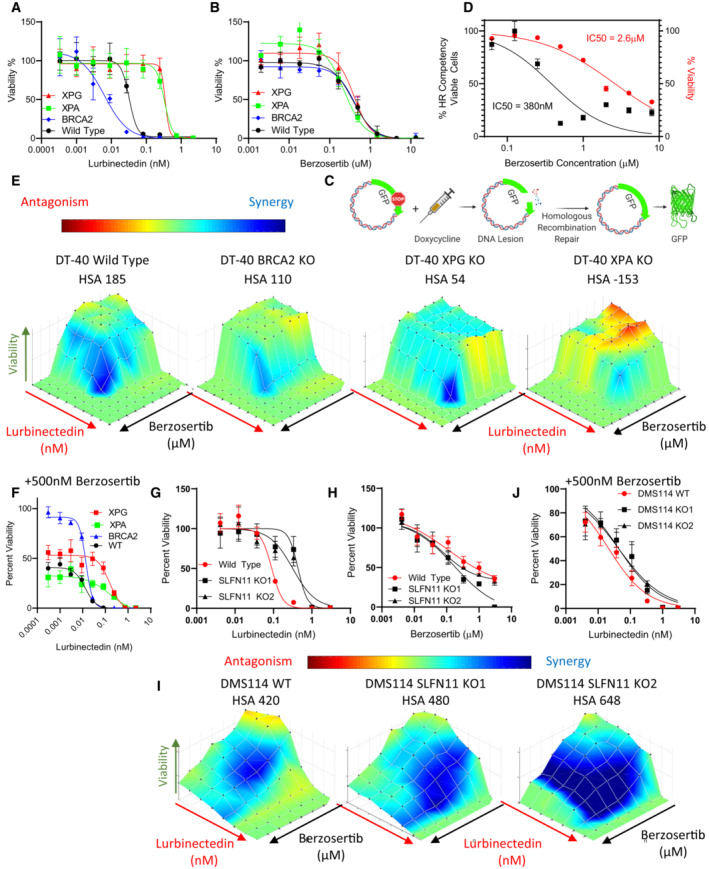
BRCA2 KO led to increased lurbinectedin efficacy while XPG and XPA KO decreased efficacy, none of the knockouts displayed significantly different sensitivity to berzosertib. Lurbinectedin and berzosertib were treated in wild‐type, BRCA2‐KO, ERCC5‐KO, and XPA‐KO knockout DT40 cells at varying concentrations for 72 h, technical replicates = 3 and biological replicates = 3.
- C, D
Berzosertib inhibited HR competency at significantly lower concentrations (IC50 95%CI 0.2571 to 0.5847 μM) than required for berzosertib to inhibit viability (IC50 95%CI 2.285 to 3.016 μM). To assess HR competency, U2OS cells were stably transfected with a plasmid‐expressing truncated GFP. Upon doxycycline treatment, this truncated version is cleaved, and cells which are HR competent are selectively able to repair the plasmid allowing for the expression of full‐length GFP. Berzosertib impact on HR after accounting for changes to viability was plotted against berzosertib concentration. Each sample was assessed with > 10,000 cells, biological replicates = 3. IC50s were calculated utilizing the normalized variable slope model in PRISM.
- E, F
BRCA2‐KO marginally reduced synergy of lurbinectedin and berzosertib while XPG‐KO and XPA‐KO reduced synergy to a greater extent. XPG‐KO and XPA‐KO cells maintain resistance to lurbinectedin even in the presence of berzosertib, indicating that berzosertib cannot rescue NER deficiency‐induced resistance. The synergy of berzosertib and lurbinectedin across DT40 cells with wild‐type, BRCA2‐KO, ERCC5‐KO, or XPA‐KO was assessed after 72 h of treatment in a 10 × 10 matrix format; technical replicates = 3, biological replicates = 3. In (F), we demonstrate efficacy of lurbinectedin with 500 nM berzosertib (from the matrix data) as a marker of efficacy of the combination.
- G–J
We determined that SLFN11‐KO in two DMS 114 models reduced lurbinectedin sensitivity (G) while not significantly effecting berzosertib sensitivity (H). SLFN11‐KO led to increased synergy in both models (I). Accordingly, the addition of berzosertib rescued SLFN11‐induced resistance in both models as lurbinectedin IC50s in all models in the presence of 500 nM berzosertib were similar (J). DMS 114 WT and two SLFN11 clones were plated in 10 × 10 matrix formats and lurbinectedin and berzosertib synergy was assessed, replicated = 3, n = 3.
- A
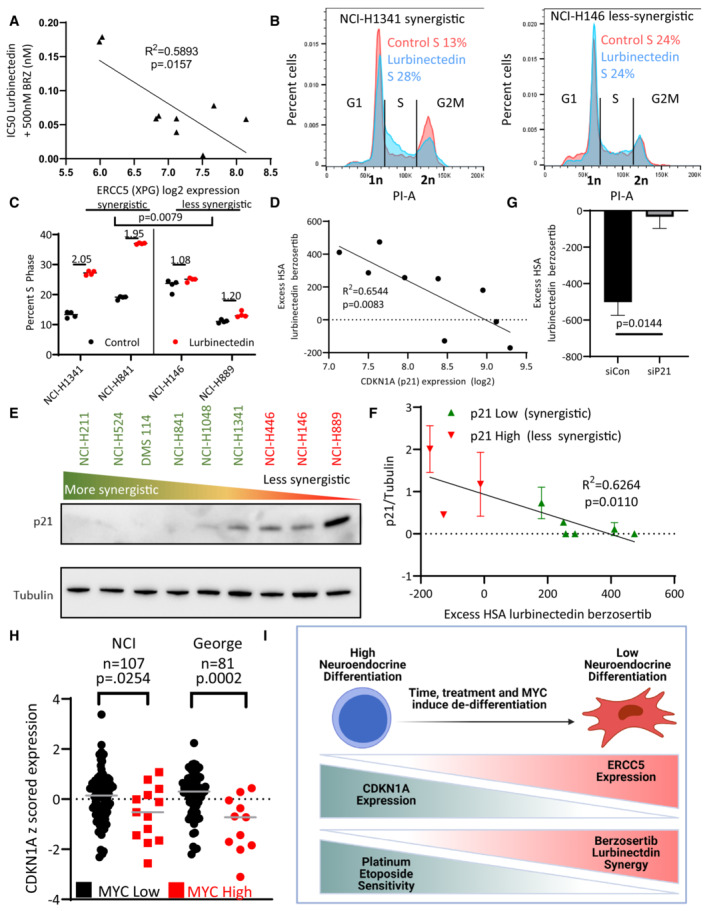
ERCC5 (XPG) expression inversely correlated with combination efficacy, that is, when the expression of ERCC5 (XPG) was high, the combination was more effective. The IC50 of lurbinectedin in the presence of 500 nM berzosertib (combination efficacy) was determined in nine cell lines after assessing all nine lines using a 10 × 10 matrix of lurbinectedin and berzosertib combinations (replicates = 3, n = 1); Pearson correlation was assessed in PRISM.
- B, C
Lurbinectedin increased S‐phase arrest as assessed by propidium iodide staining. Synergistic cell lines had a greater increase in S‐phase than less synergistic lines. Synergistic (NCI‐H841 and NCI‐H1341) and less synergistic (NCI‐H146 and NCI‐H889) cell lines were treated with ±1 nM lurbinectedin ±2 μM berzosertib. Quantification in (C) is representative of four technical replicates of 10,000 cells per group biological replicates, n = 3, with fold change in S‐phase cells being compared between synergistic and less synergistic cell lines using an unpaired two‐tailed Student's t‐test in PRISM. These data are also described in Appendix Fig S4C.
- D
CDKN1A (p21) RNA expression inversely correlated with synergy of lurbinectedin and berzosertib, indicating that CDKN1A (p21) could potentially inhibit synergy. Pearson correlation was assessed in PRISM.
- E, F
Synergy was lower in cells that displayed higher expression of p21 protein. (E) Cell lines were ordered by HSA synergy score (most‐to‐least synergy, left to right), and p21 protein expression was assessed by immunoblotting. (F) Quantitation of p21 protein compared to control tubulin across two biological replicates, error bars represent SD; Pearson correlation was assessed in PRISM.
- G
Knockdown of CDKN1A (p21) in NCI‐H889 cells led to increased synergy. NCI‐H889 cells were treated with siRNA against control or CDKN1A (p21), followed by dosing in a 10 × 10 matrix format in triplicate with lurbinectedin and berzosertib and collection after 72 h. HSA synergy was determined and summed across the 10 × 10 matrix, graph represents the average of three independent experiments of 10 × 10 matrixes in triplicate (technical replicates), error bars = SD, and unpaired two‐tailed Student's t‐test performed in PRISM.
- H
High MYC family member patient samples had lower CDKN1A (p21) expression consistent with high MYC family member expression causing decrease in CDKN1A (p21). In two independent SCLC datasets, MYC, MYCL, and MYCN expressions were z‐scored (within each database) and the max MYC family member z‐score expression was determined for each sample. Those samples which were greater than 1 SD above average were considered to be high MYC family member expressing. P‐values are indicative of unpaired two‐tailed Student's t‐test assessed in PRISM.
- I
As SCLC progresses, cancer cells progress from a NE‐differentiated state to a non‐NE state. These non‐NE cells have a lower expression of CDKN1A (p21) and a higher expression of ERCC5 (XPG). These are characteristics that make them less responsive to the standard first‐line platinum/etoposide regimen, however, this should make them more sensitive to the combination of lurbinectedin and berzosertib.
- A
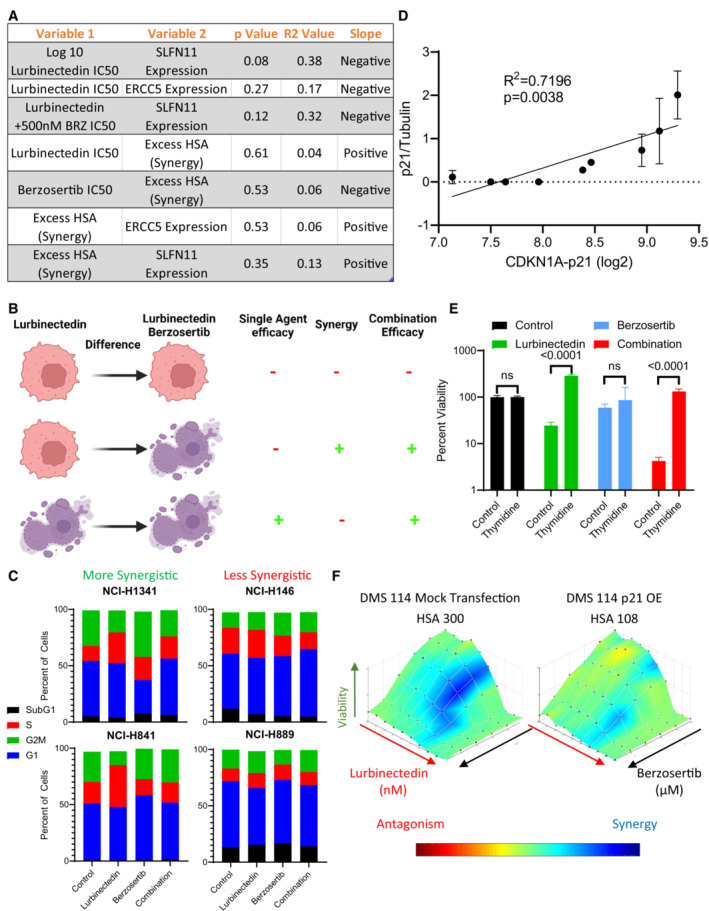
The efficacy and synergy of lurbinectedin and berzosertib were assessed across nine cell lines in a 10 × 10 matrix format, replicates = 3, n = 1. We determined IC50s for lurbinectedin and berzosertib utilizing an unnormalized variable slope model in PRISM. RNA values for all genes investigated for these cell lines are publicly available at
https://discover.nci.nih.gov/rsconnect/cellminercdb . These data represent the statistics for simple linear regression as assessed in PRISM when plotting variable 1 against variable 2. Overall, these correlations are nonsignificant, however, SLFN11 expression trended toward negatively associating with lurbinectedin IC50s in the nine cell lines. - B
Lurbinectedin efficacy (lurbinectedin IC50), synergy between lurbinectedin and berzosertib (HSA), and combination efficacy (lurbinectedin IC50 in the presence of 500 nm berzosertib) were assessed. Here, we demonstrate different conditions between cells that are resistant (red/alive) and sensitive (purple/dead) to either lurbinectedin alone or lurbinectedin–berzosertib in order to differentiate these terms. Importantly, the combination can be effective without synergy (i.e., the third line), meaning these terms cannot be utilized interchangeably.
- C
Synergistic cell lines (NCI‐H1341, NCI‐H841) as compared to less synergistic cell lines (NCI‐H146, NCI‐H899) displayed increased S‐phase accumulation after lurbinectedin treatment, which could be ameliorated with berzosertib cotreatment. NCI‐H1341, NCI‐H841 NCI‐H146, and NCI‐H899 were treated with ±1 nM lurbinectedin ±2 μM berzosertib for 24 h and assessed using PI to determine cell cycle with flow cytometry analysis in FlowJo. Each treatment group for each cell line had 10,000 cells, technical replicates = 4, and biological replicates = 3.
- D
p21 protein normalized to control tubulin across two independent experiments with fresh samples correlated with log2 CDKN1A RNA expression. We assessed p21 protein expression by western blot in nine cell lines; error bars represent SD. Pearson correlation was assessed in PRISM.
- E
Cells that were halted in G1 using a double thymidine block led to a decrease in sensitivity to lurbinectedin, and to the combination of lurbinectedin and berzosertib. Here, cells treated with berzosertib, lurbinectedin, and the combination without thymidine are normalized to thymidine‐free and untreated control, and cells treated with berzosertib, lurbinectedin, and the combination along with thymidine are normalized to thymidine‐alone control cells. NCI‐H841 (SCLC cell line chosen largely due to not being sensitive to loss of viability upon thymidine arrest) cells underwent a double‐thymidine block‐enforcing G1 arrest. Cells were treated with ±lurbinectedin 1 nM ± 2 μM berzosertib ± enforcement of thymidine arrest and collected after 72 h, replicates = 4, n = 3, P‐values indicate unpaired two‐tailed Student's t‐test in PRISM, error bars are representative of SD.
- F
p21 overexpression in DMS 114 cells led to a decrease in lurbinectedin–berzosertib combination synergy; DMS 114 cells were treated with mock transfection or with overexpression of Flag‐tagged wild‐type p21 (Addgene Plasmid #16240). Cells were split at 1,000 cells/well into 384‐well plates after 24 h and then treated the following day with lurbinectedin and berzosertib in a 10 × 6 matrix format, cells were collected after 72 h, and synergy was assessed; technical replicates = 4, biological replicates = 2.
- A
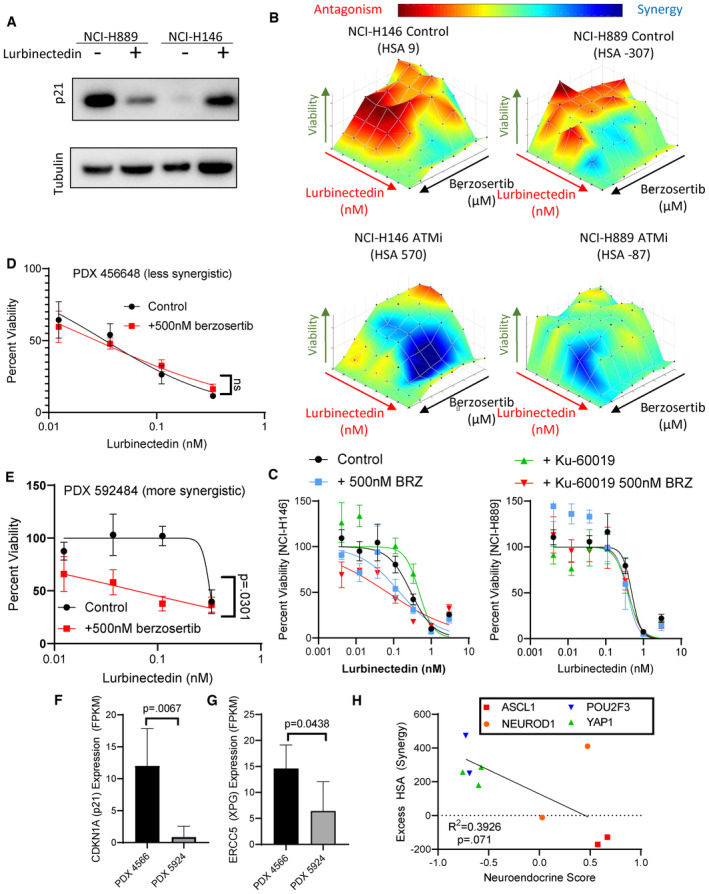
Lurbinectedin treatment caused a decrease in p21 in NCI‐H899 (p53 mutant) while it caused an increase in p21 in NCI‐H146 (p53 wild‐type) as assessed by immunoblotting. Cells were treated with ±1 nM lurbinectedin for 6 h and collected.
- B, C
The ATM inhibitor KU60019 increased synergy and increased combination efficacy of lurbinectedin and berzosertib in NCI‐H146 cells (p53 wild = type) while not increasing synergy or combination efficacy to as great as an extent in NCI‐H889 (p53 mutant). H889 and NCI‐H146 cells were treated with a combination of lurbinectedin and berzosertib in an 8 × 8 matrix format ±2 μM KU60019 for 72 h, technical replicates = 4 and biological replicates = 2.
- D, E
PDX 592484 displayed greater synergy of lurbinectedin with berzosertib as compared to the PDX 456648 as displayed by the greater increase in lurbinectedin sensitivity with the addition of berzosertib. Patient‐derived xenograft organoids were dissociated and plated in 384‐well plates and treated with lurbinectedin ± 500 nM berzosertib for 72 h, technical replicates = 3, and biological replicates = 2.
- F, G
The more synergistic organoid model (PDX 592484) expressed less CDKN1A (p21) and ERCC5 (XPG) potentially explaining the not only increased synergy but also decreased overall efficacy of lurbinectedin even in the presence of berzosertib as compared to PDX 456648. Patient‐derived xenograft organoids samples were assessed using RNA seq, data are shown as TMM FPKM; PDX456648 technical replicates = 6 and PDX 592484 technical replicates = 4 for RNA seq; we utilized unpaired Student's t‐tests in PRISM to compare groups.
- H
Neuroendocrine scores inversely associated with synergy in our nine cell lines, with NE cells displaying decreased synergy as compared to non‐NE cells. Neuroendocrine scores and SCLC subtype clustering data (ASCL1, NEUROD1, POU2F3, and YAP1) are publicly available at
https://discover.nci.nih.gov/rsconnect/cellminercdb , and HSA was determined as described previously. Pearson correlation was determined using PRISM.
- A
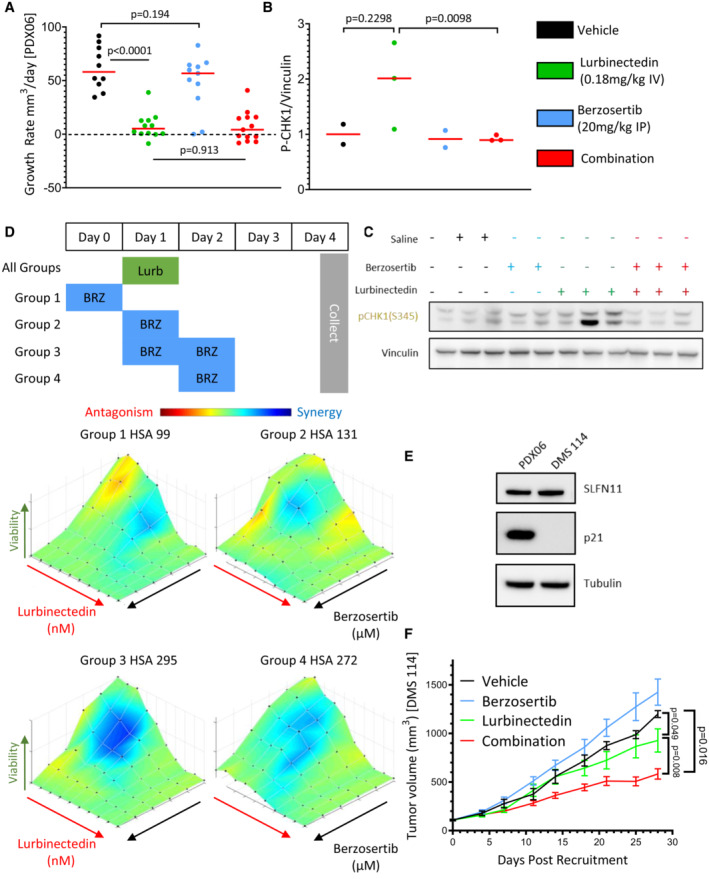
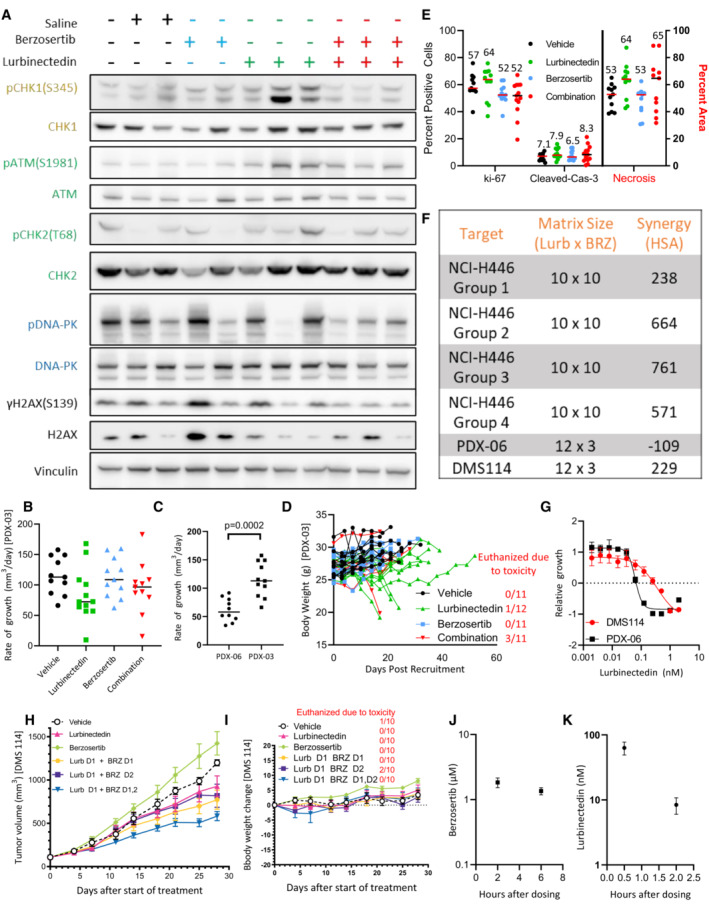
Lurbinectedin was very efficacious and the addition of berzosertib did not significantly improve the almost complete inhibition of tumor growth caused by lurbinectedin in a PDX mouse model of SCLC (PDX‐06), n = 10–13 mice per group, red bar indicates median, and P‐values are indicative of unpaired two‐tailed Student's t‐test calculated in PRISM. Tumor‐bearing mice were treated with lurbinectedin (0.18 mg/kg IV) and berzosertib (20 mg/kg IP) in a format mirroring our clinical trial with topotecan/berzosertib in SCLC, lurbinectedin day 1, and berzosertib days 2 and 5 of a 7‐day cycle. Tumor growth rates were calculated as the difference between the initial tumor size and the final tumor size after death of the mouse due to toxicity or progression of tumor divided by the total number of days treated.
- B, C
We determined that lurbinectedin trended towards increasing p‐chk1 while berzosertib cotreatment significantly reduced p‐chk1 activation in vivo indicating target engagement. Tumors from mice with the same tumor type (PDX‐06) as in (A) were collected 24 h after being dosed with the indicated drugs. P‐values are indicative of unpaired two‐tailed Student's t‐test calculated in PRISM; western blot for (C) is also shown in Appendix Fig S2A.
- D
Lurbinectedin synergy was maximal in DMS 114 cells when treated on day 1 with lurbinectedin and days 1 and 2 with berzosertib. DMS 114 cells were treated with lurbinectedin and berzosertib in a 10 × 6 matrix format replicates = 4, n = 1. All groups were treated for 24 h with lurbinectedin, while group 1 was pretreated with berzosertib, group 2 was cotreated with berzosertib, group 3 was co‐ and posttreated with berzosertib, and group 4 was posttreated with berzosertib for 24 h. At the end of 5 days, cells were collected and synergy was assessed across the matrixes.
- E
PDX‐06 (less synergistic) and DMS 114 (more synergistic) cells had equivalent SLFN11, while DMS 114 had less p21. p21 and SLFN11 protein expression was assessed using immunoblotting.
- F
Berzosertib cotreatment improved lurbinectedin efficacy in a DMS 114 xenograft mouse model of SCLC. Lurbinectedin was dosed at 0.18 mg/kg (intravenous) and berzosertib at 50 mg/kg (oral) for four 7‐day cycles in dosing regiments consistent with (D) n = 10 mice per group. Consistent with our results in (D), the greatest degree of increased and overall efficacy was seen in group 3 (lurbinectedin day 1, berzosertib days 1 and 2), P‐values are indicative of paired two‐tailed Student's t‐test calculated in PRISM, and error bars are representative of SEM. The other groups are displayed in Appendix Fig S7H and I.
- A
In the PDX‐06 model, lurbinectedin appeared to induce p‐CHK1 activation which was reduced with berzosertib cotreatment (quantified in Fig 4B). PDX‐06 tumors were collected 24 h after being dosed with the indicated drugs. We assessed targets in the ATR (yellow/gold), ATM (green), and DNA‐PK (blue) damage repair pathways as well as γH2AX (DNA damage marker).
- B
Lurbinectedin and berzosertib were less effective in the more aggressive mouse model of SCLC PDX‐03 as compared to PDX‐06 (Fig 4A). PDX‐03 was treated the same as PDX‐06 with lurbinectedin (0.18 mg/kg IV, with an increased volume of 200 μl vs. 100 μl) and berzosertib (20 mg/kg IP) in a format mirroring our clinical trial with topotecan/berzosertib in SCLC, lurbinectedin day 1, and berzosertib days 2 and 5 of a 7‐day cycle. To approximate efficacy across an experiment with significant toxicity, we assessed growth rate as tumor size at animal death due to either toxicity or progression of tumor minus tumor volume at date of initiation, divided by days between initiation and final assessment of tumor for a growth rate.
- C
The PDX‐03 model was more aggressive than the PDX‐06 model as demonstrated by comparing rate of growth for the control arms for both experiments. PDX‐06 mice = 10, PDX‐03 mice = 11, and an unpaired two‐tailed Student's t‐test was used to compare rates.
- D
Lurbinectedin and the combination were less toxic in PDX‐03 as compared to PDX‐06, likely due to the increased volume for dosing of lurbinectedin, however, several mice still required sacrifice. Mouse body weights corresponding to Appendix Fig S7B, mice which required sacrifice due to toxicity (body weight loss or other) are quantified to the right in red.
- E
The combination of lurbinectedin and berzosertib overall appeared to decrease replication and increase markers of cell death. We assessed markers of replication (ki‐67) and cell death (cleaved caspase‐3 and necrosis) as assessed by IHC and H&E staining from tumors after collection from all mice possibly from our PDX‐03 efficacy study (Appendix Fig S7B). Cleaved caspase and ki‐67 are reported as percent positive of cells, while necrosis is reported as percent area. Lines represent median of groups as do numbers above.
- F, G
Similar to Fig 4D to determine differences in synergy with different scheduling regiments of lurbinectedin and berzosertib, we treated NCI‐446 cells in a 10 × 10 matrix format; technical replicates = 3, biological replicates = 1. All groups were treated for 24 h with lurbinectedin, while group 1 was pretreated with berzosertib, group 2 was cotreated with berzosertib, group 3 was co‐ and posttreated with berzosertib, and group 4 was posttreated with berzosertib for 24 h. At the end of 4 days, cells were collected and synergy was assessed across the matrixes. We determined that group 3 (co‐ and posttreatment) displayed the greatest degree of synergy, mirroring our results with DMS 114 cells in Fig 4D. We also assessed synergy of DMS 114 cells and our PDX‐06 cell line in a 12 × 3 matrix format, technical replicates = 4 and biological replicates = 2, and determined that PDX‐06 cells appeared to have less synergy than DMS 114 cells (F) and were more sensitive to lurbinectedin (G).
- H
The most effective schedule in the DMS 114 xenograft model was treating with lurbinectedin and berzosertib cotreated and posttreated (lurbinectedin day 1, berzosertib days 1, 2) mirroring our in vitro results. The most effective scheduling model is shown in Fig 4F, error bars are representative of SEM, mice = 10 per group.
- I
In the DMS 114 mouse model of SCLC, lurbinectedin day 1 and berzosertib days 1 and 2 were nontoxic. Mouse body weights from the PDX experiment are demonstrated in Appendix Fig S1H. The number of mice sacrificed due to toxicity in each group is also displayed.
- J, K
Concentrations of berzosertib and lurbinectedin in mouse plasma were assessed in mice utilizing mass spectrometry after retro‐orbital collection of blood at the indicated time points after dosing with lurbinectedin (0.18 mg/kg intravenous) and berzosertib (50 mg/kg oral), mice = 5 per group; error bars are representative of SD.
References
-
- Berenbaum MC (1989) What is synergy? Pharmacol Rev 41: 93–141 - PubMed
Publication types
MeSH terms
Substances
Associated data
Grants and funding
LinkOut - more resources
Full Text Sources
Other Literature Sources
Medical
Research Materials
Miscellaneous
