Review
. 2023 Jul;20(204):20230115.
doi: 10.1098/rsif.2023.0115. Epub 2023 Jul 26.

Tissues as networks of cells: towards generative rules of complex organ development

Affiliations
Review

Tissues as networks of cells: towards generative rules of complex organ development

Sabine C Fischer et al. J R Soc Interface. 2023 Jul.

Abstract

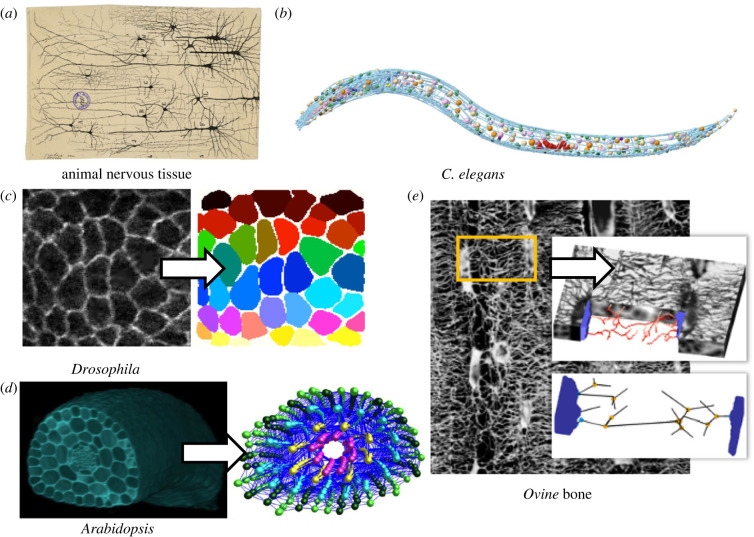
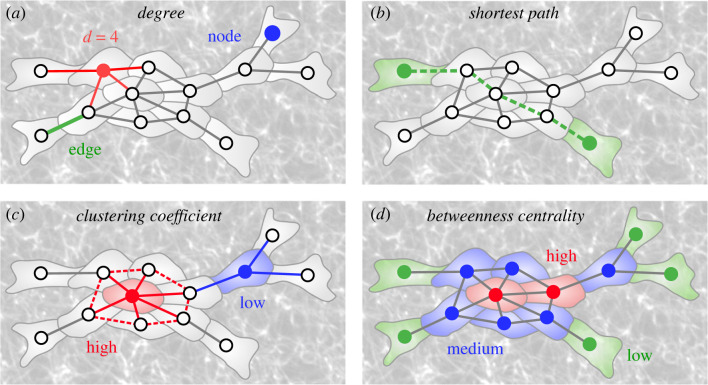
Network analysis is a well-known and powerful tool in molecular biology. More recently, it has been introduced in developmental biology. Tissues can be readily translated into spatial networks such that cells are represented by nodes and intercellular connections by edges. This discretization of cellular organization enables mathematical approaches rooted in network science to be applied towards the understanding of tissue structure and function. Here, we describe how such tissue abstractions can enable the principles that underpin tissue formation and function to be uncovered. We provide an introduction into biologically relevant network measures, then present an overview of different areas of developmental biology where these approaches have been applied. We then summarize the general developmental rules underpinning tissue topology generation. Finally, we discuss how generative models can help to link the developmental rule back to the tissue topologies. Our collection of results points at general mechanisms as to how local developmental rules can give rise to observed topological properties in multicellular systems.

Keywords: cell graphs; complex networks; connectivity; developmental biology; generative models.


Conflict of interest statement

We declare we have no competing interests.

Figures

Figure 1.
Figure 1.
Examples of network analysis applied to developmental systems. (a) Cajal diagram describing neuronal connectivity (Museo Cajal, Madrid, Spain). (b) Caenorhabditis elegans network describing the connectivity between neurons, from [10] (CC-BY). (c) A confocal image of the Drosophila epithelium and an illustration as to how it can be segmented (original work). (d) Three-dimensional confocal image stack of a plant hypocotyl and its abstraction into a network describing cell connectivity, adapted from [11]. (e) Osteocyte network in bone and image analysis quantifying its connectivity within the bone tissue, adapted from [12].
Figure 2.
Figure 2.
Illustrations of biologically relevant network measures. (a) Node degree is the number of edges (direct neighbours) connected to a node (cell). (b) The topological shortest path between two nodes (cells) is the minimum number of nodes (cells) between one node (cell) and another. (c) The clustering coefficient of a node (cell) is the fraction of possible edges between its direct neighbours that actually exist. (d) The betweenness centrality of a node (cell) is the fraction of all shortest paths in the network (tissue) that run through that node (cell).
Figure 3.
Figure 3.
Examples of the application of network approaches towards understanding tissue organization and function. (a) Local cell division orientation in the Drosophila epithelium follows rules based on the constraint of degree across the tissue. (b) Orientation of cell division planes in the Arabidopsis shoot apical meristem conforms to local geometric (shortest wall), local topological (minimum degree) and global topological (minimum random walk) rules, adapted from [34]. (c) Three-dimensional segmentation of the cells of the Arabidopsis hypocotyl with two epidermal cell types (trichoblast and atrichoblast) given distinct colours, adapted from [11]. (d) Degree distribution of each hypocotyl epidermal cell type, adapted from [11]. (e) Betweenness centrality distribution of each hypocotyl epidermal cell type, adapted from [11]. (f) Confocal image of the hypocotyl showing preferential movement of fluorescein through atrichoblast cells, adapted from [11]. (g) Network analyses of the inner cell mass in mouse embryos reveals local patterns in early and mid blastocysts, adapted from [25]. (h) Hodgkin lymphoma cells exhibit preferences for the shape of their neighbouring cells, from [26]. (i) The osteocyte network in highly organized fibrolamellar bone shows a more tree-like topology (top) and aligned paths in maps of betweenness centrality (bottom) compared with disordered woven bone, adapted from [17].
Figure 4.
Figure 4.
Illustration of developmental rules. (a) Rules that influence cell packing within a constraint tissue geometry. (b) Topological rearrangements due to cellular movement and cell shape changes. (c) Emergence of neuronal or osteocyte topology by growth cones splitting, merging and terminating.

References

    1. Stone JR. 1997. The spirit of D'Arcy Thompson dwells in empirical morphospace. Math. Biosci. 142, 13-30. (10.1016/S0025-5564(96)00186-1) - DOI - PubMed
    1. Xu H, Bassel GW. 2020. Linking genes to shape in plants using morphometrics. Annu. Rev. Genet. 54, 417-437. (10.1146/annurev-genet-022620-094553) - DOI - PubMed
    1. Oates AC, Gorfinkiel N, González-Gaitán M, Heisenberg CP. 2009. Quantitative approaches in developmental biology. Nat. Rev. Genet. 10, 517-530. (10.1038/nrg2548) - DOI - PubMed
    1. Wolpert L, Tickle C, Arias AM. 2019. Principles of development, 6th edn. Oxford, UK: Oxford University Press.
    1. Ball P. 2011. Shapes: nature's patterns: a tapestry in three parts. Oxford, UK: Oxford University Press.

Publication types

LinkOut - more resources