. 2023 Oct 1;180(10):739-754.
doi: 10.1176/appi.ajp.20220478. Epub 2023 Jul 26.

Single-Nucleus Transcriptome Profiling of Dorsolateral Prefrontal Cortex: Mechanistic Roles for Neuronal Gene Expression, Including the 17q21.31 Locus, in PTSD Stress Response

Affiliations

Single-Nucleus Transcriptome Profiling of Dorsolateral Prefrontal Cortex: Mechanistic Roles for Neuronal Gene Expression, Including the 17q21.31 Locus, in PTSD Stress Response

Chris Chatzinakos et al. Am J Psychiatry. .

Erratum in

  • Correction to Chatzinakos et al.
    [No authors listed] [No authors listed] Am J Psychiatry. 2025 Jul 1;182(7):689. doi: 10.1176/appi.ajp.20220478correction. Am J Psychiatry. 2025. PMID: 40589260 No abstract available.

Abstract

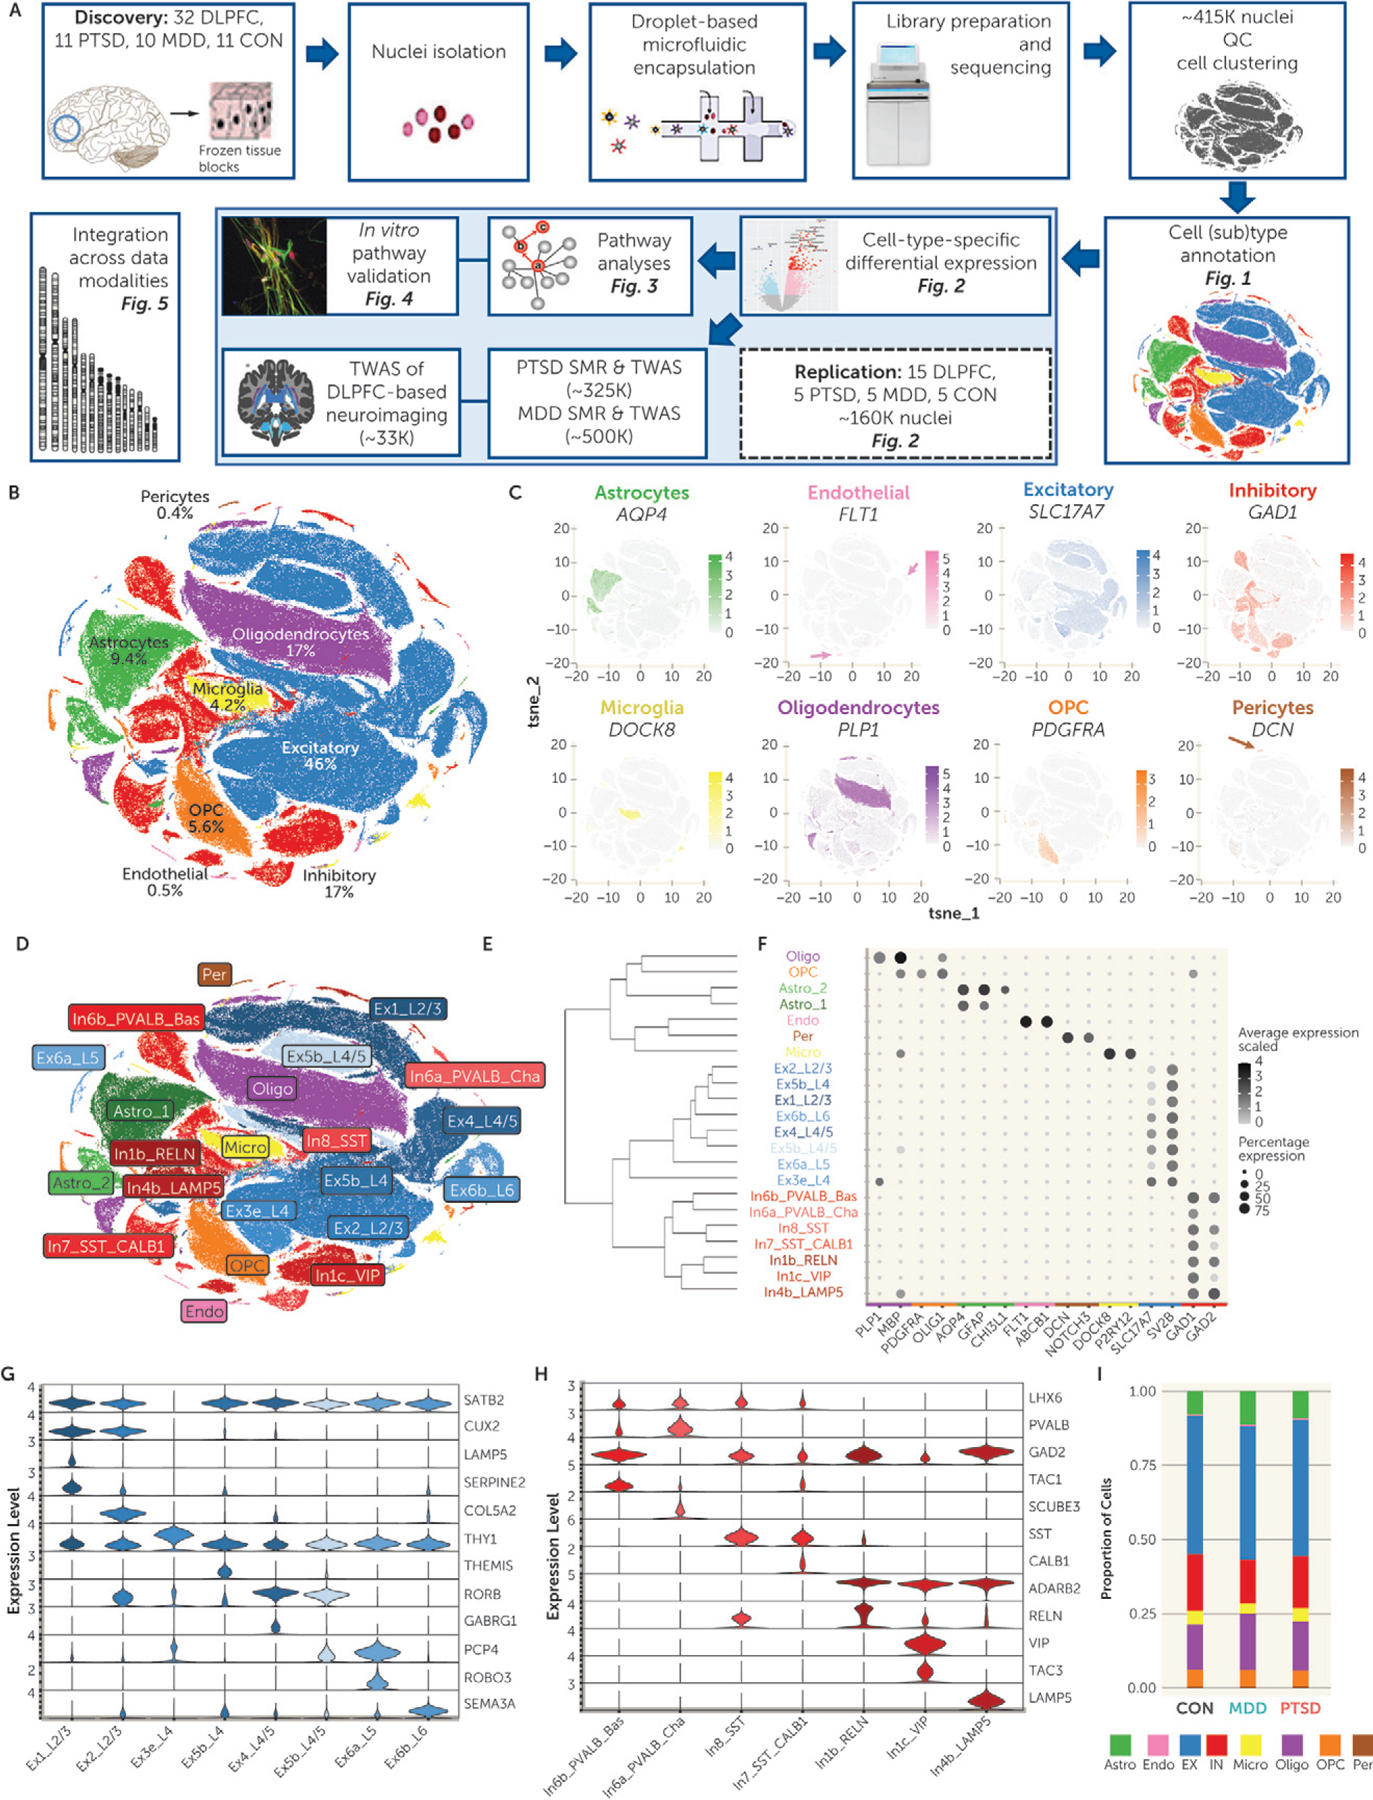
Objective: Multidisciplinary studies of posttraumatic stress disorder (PTSD) and major depressive disorder (MDD) implicate the dorsolateral prefrontal cortex (DLPFC) in disease risk and pathophysiology. Postmortem brain studies have relied on bulk-tissue RNA sequencing (RNA-seq), but single-cell RNA-seq is needed to dissect cell-type-specific mechanisms. The authors conducted the first single-nucleus RNA-seq postmortem brain study in PTSD to elucidate disease transcriptomic pathology with cell-type-specific resolution.

Method: Profiling of 32 DLPFC samples from 11 individuals with PTSD, 10 with MDD, and 11 control subjects was conducted (∼415K nuclei; >13K cells per sample). A replication sample included 15 DLPFC samples (∼160K nuclei; >11K cells per sample).

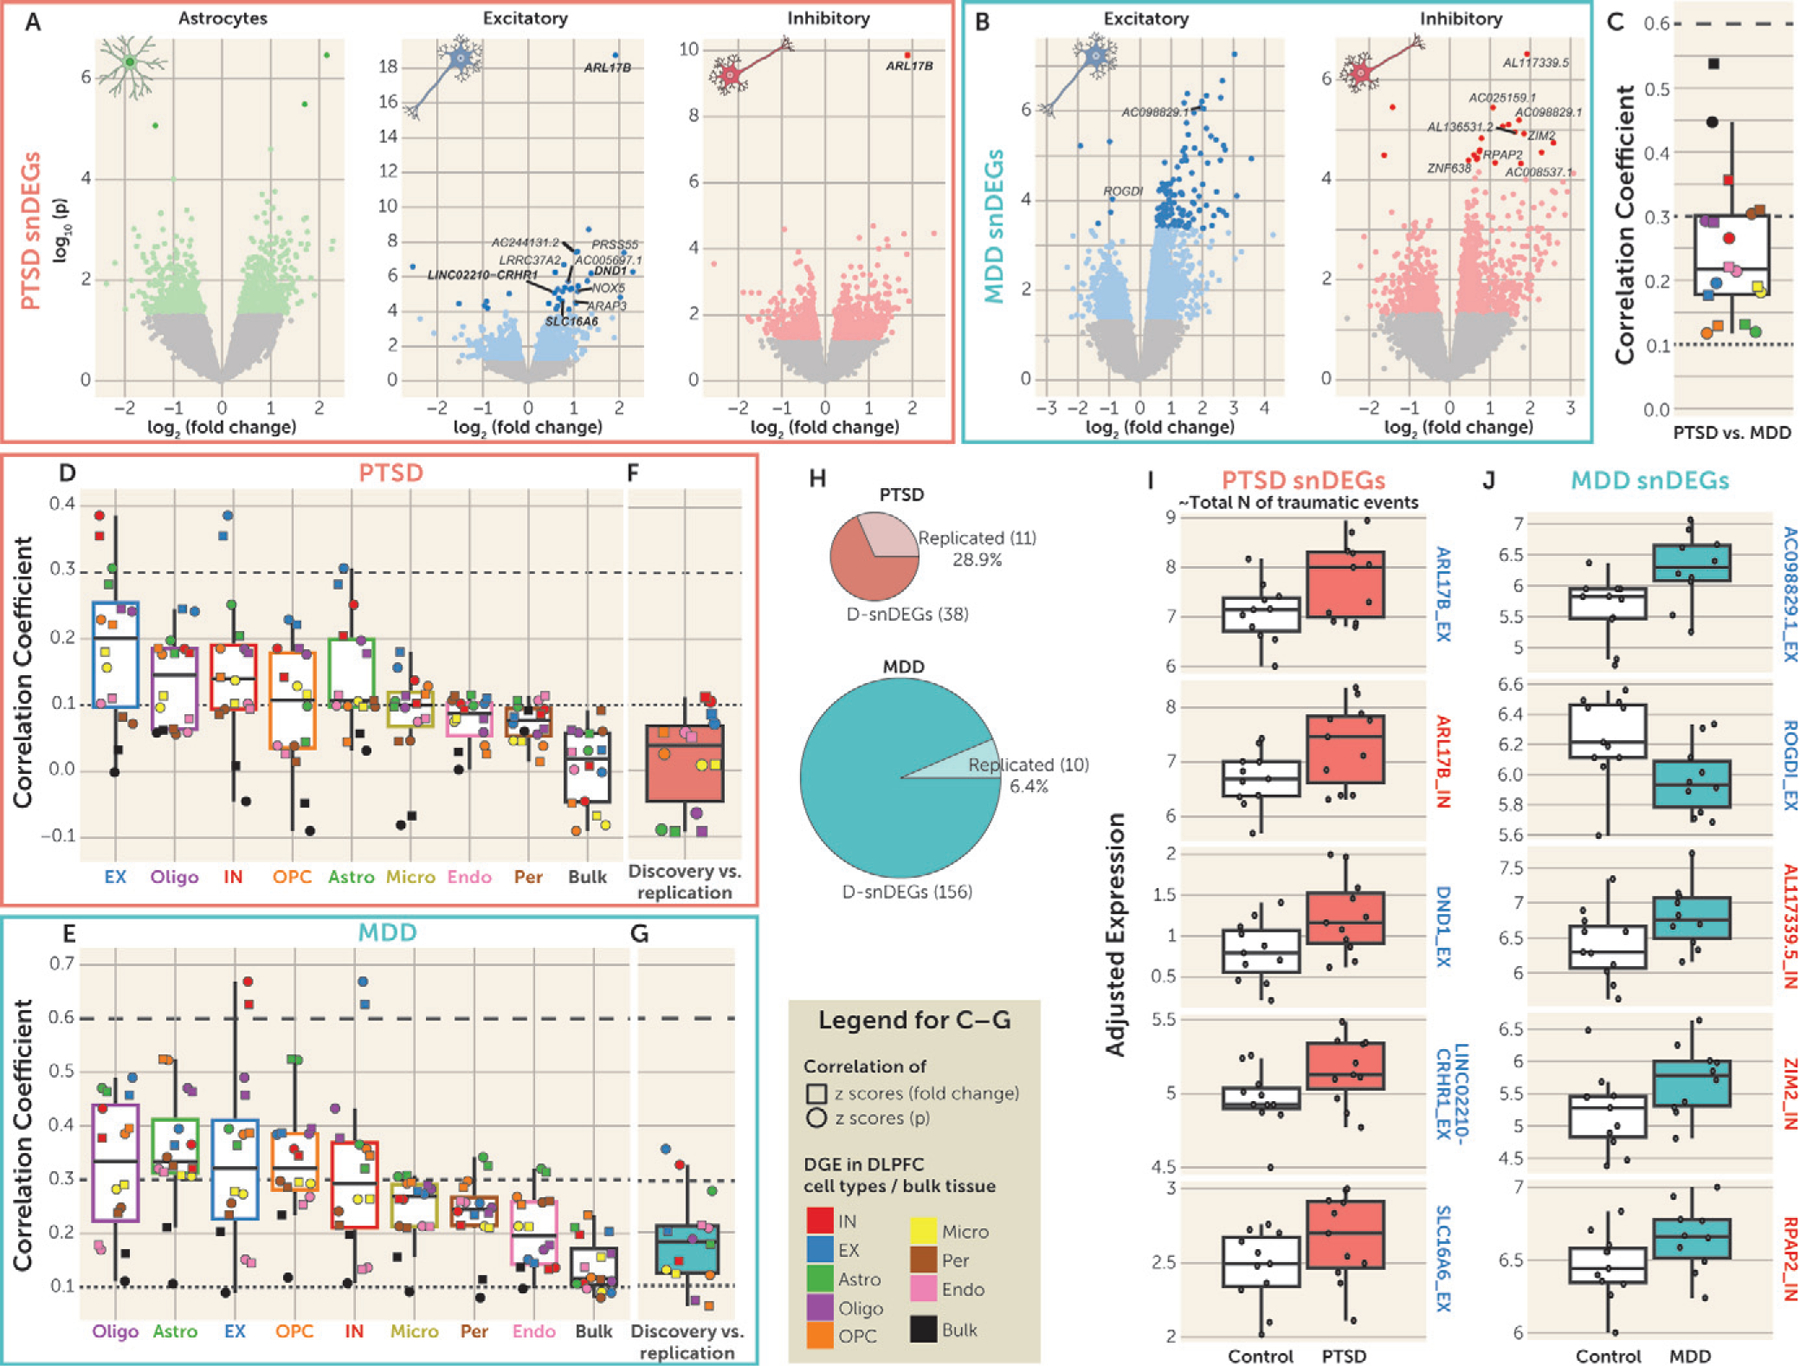
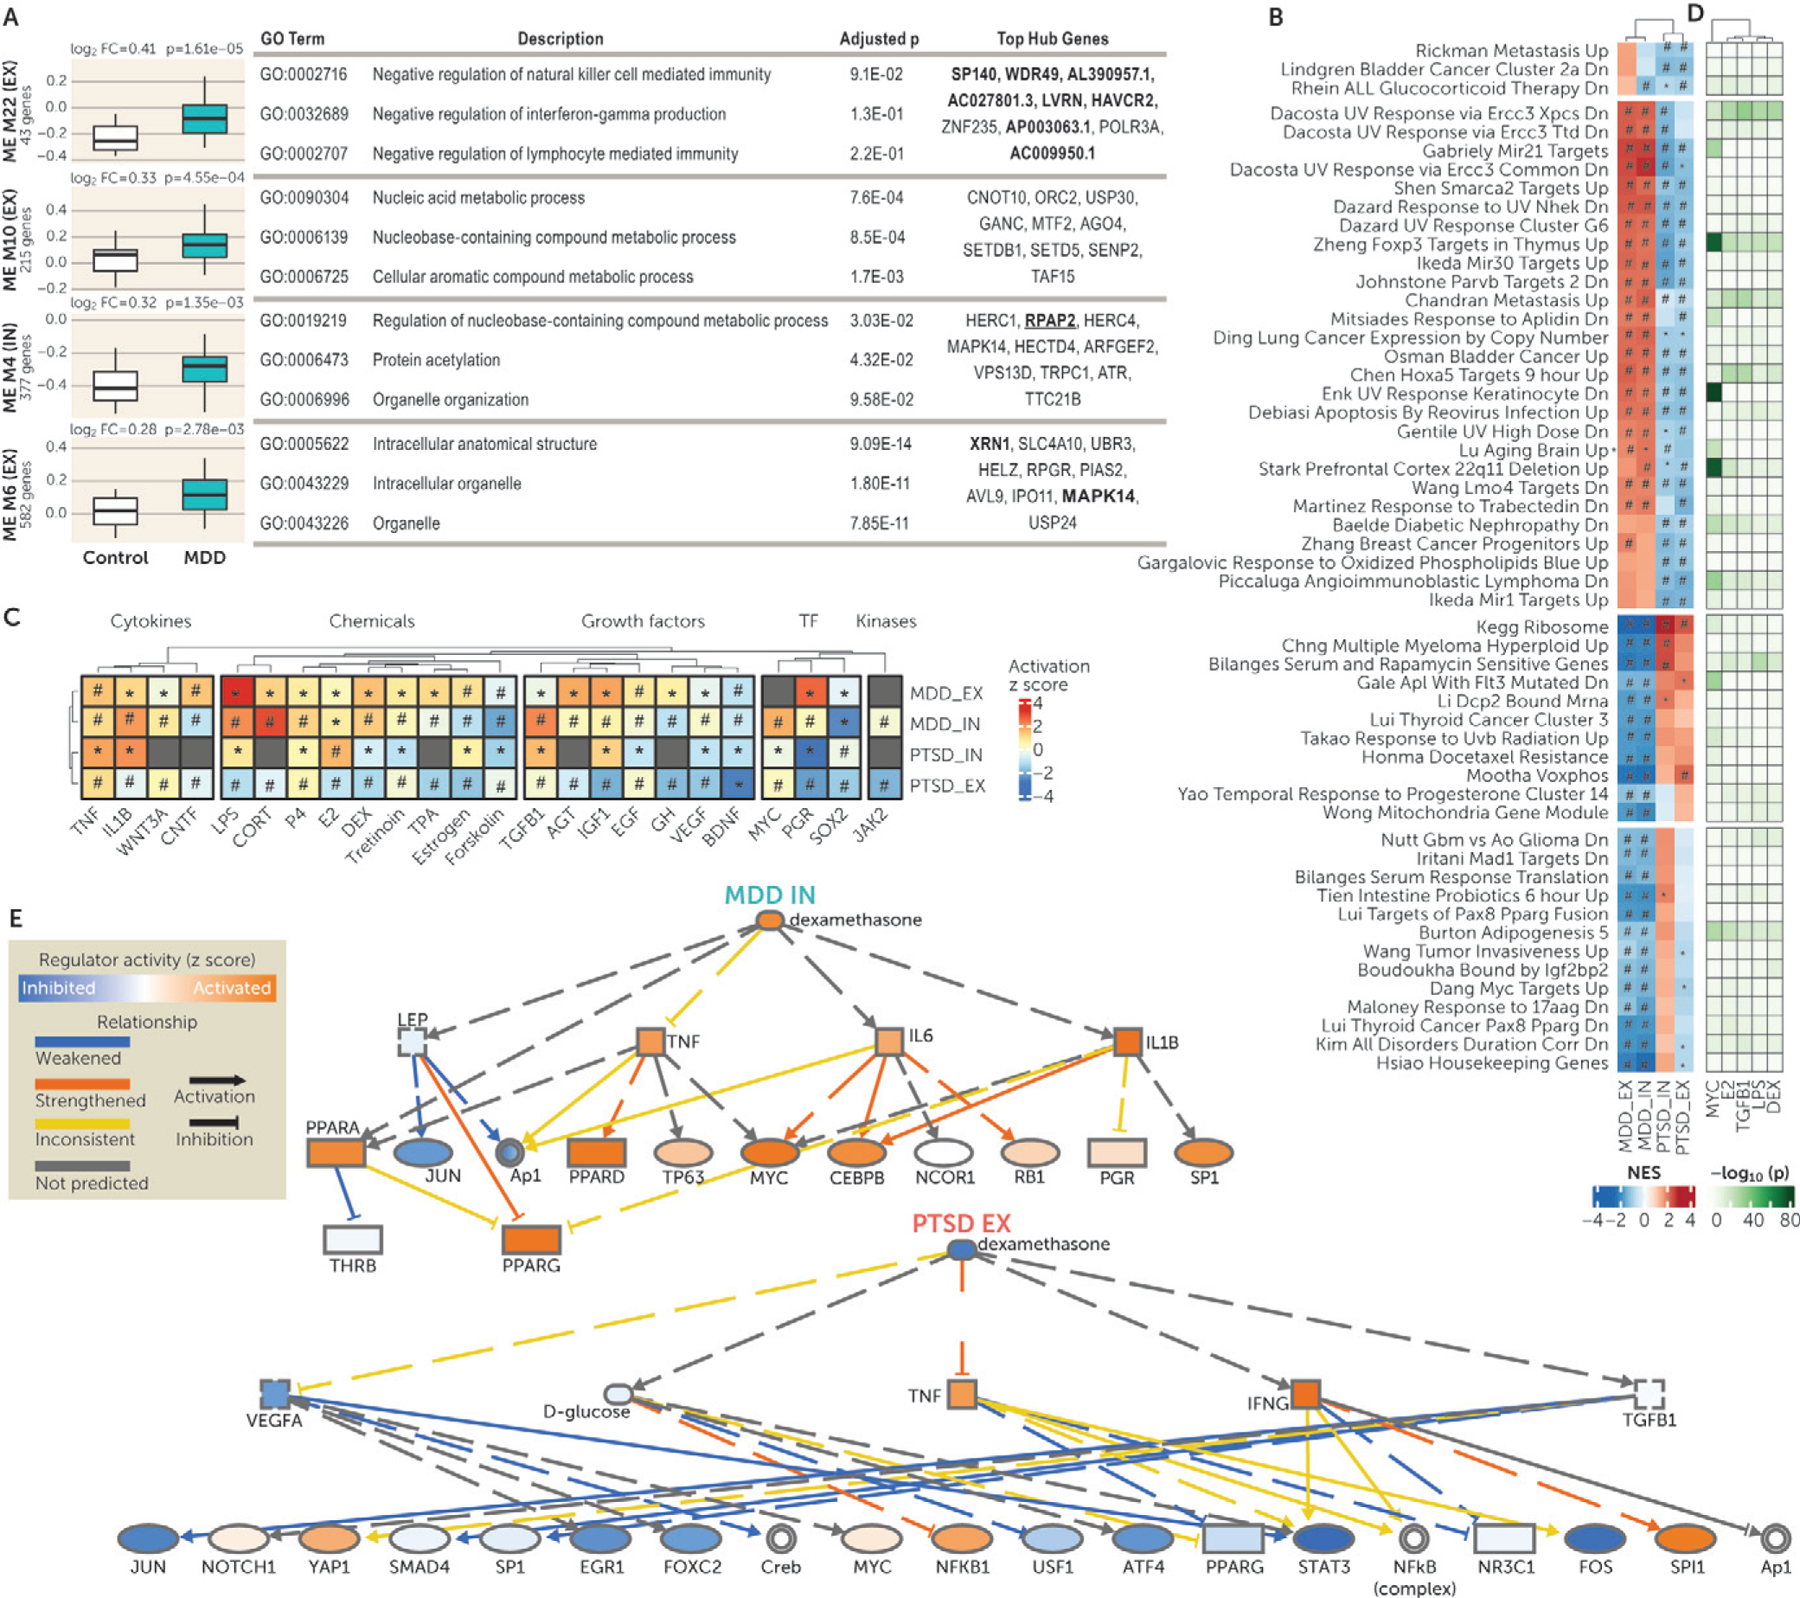
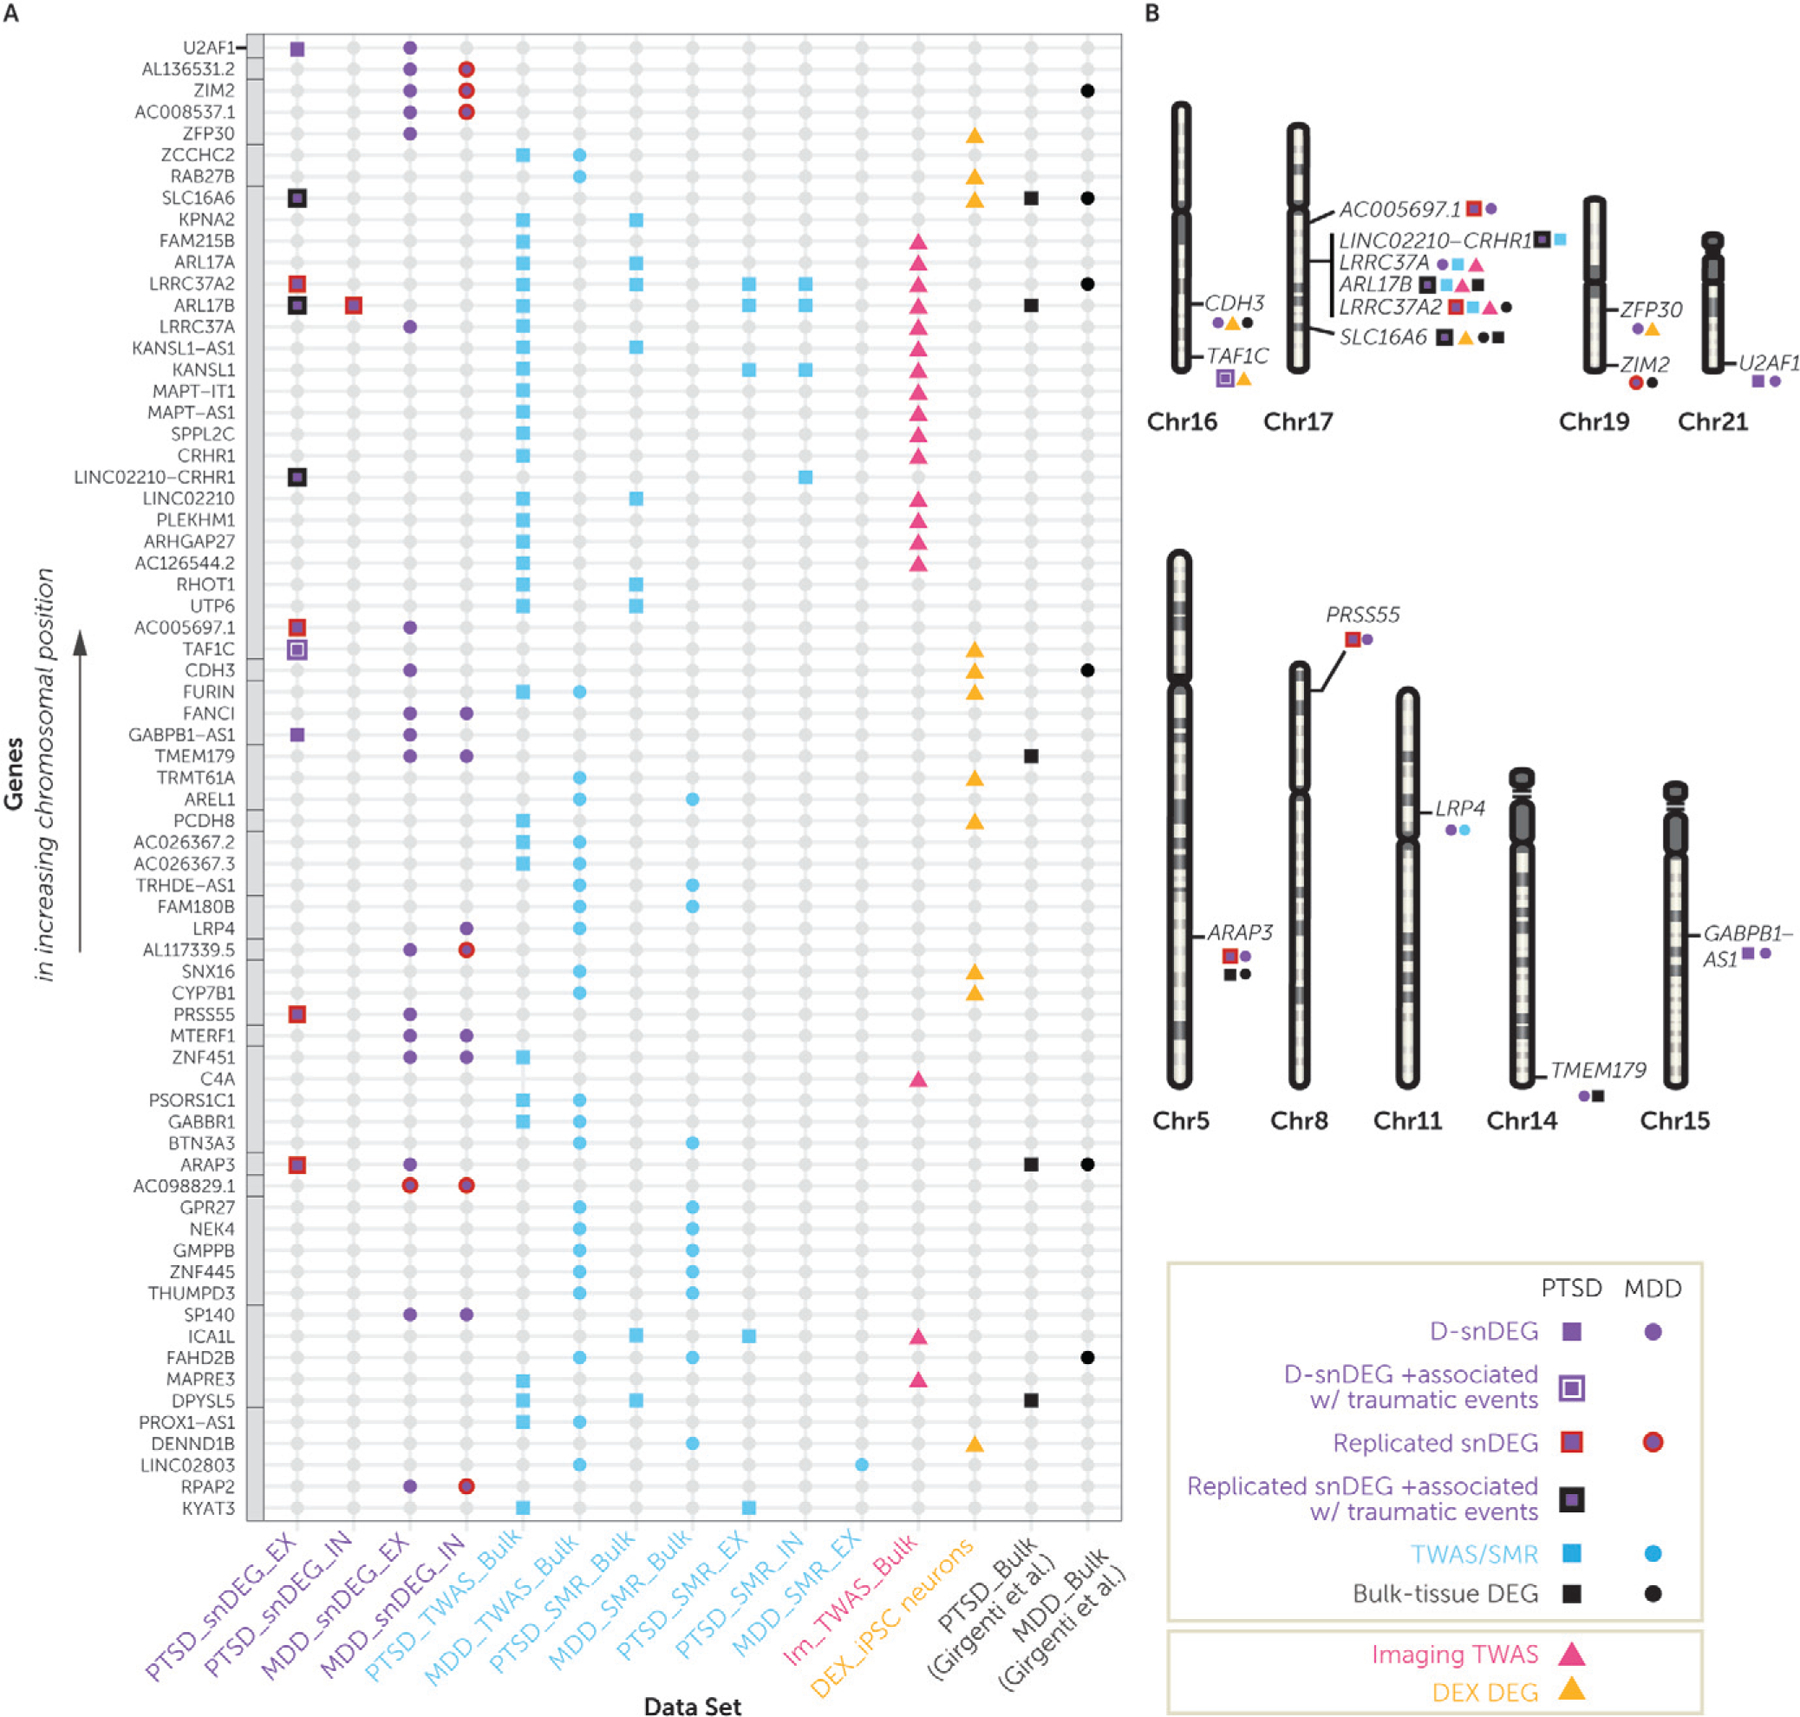
Results: Differential gene expression analyses identified significant single-nucleus RNA-seq differentially expressed genes (snDEGs) in excitatory (EX) and inhibitory (IN) neurons and astrocytes, but not in other cell types or bulk tissue. MDD samples had more false discovery rate-corrected significant snDEGs, and PTSD samples had a greater replication rate. In EX and IN neurons, biological pathways that were differentially enriched in PTSD compared with MDD included glucocorticoid signaling. Furthermore, glucocorticoid signaling in induced pluripotent stem cell (iPSC)-derived cortical neurons demonstrated greater relevance in PTSD and opposite direction of regulation compared with MDD, especially in EX neurons. Many snDEGs were from the 17q21.31 locus and are particularly interesting given causal roles in disease pathogenesis and DLPFC-based neuroimaging (PTSD: ARL17B, LINC02210-CRHR1, and LRRC37A2; MDD: LRRC37A and LRP4), while others were regulated by glucocorticoids in iPSC-derived neurons (PTSD: SLC16A6, TAF1C; MDD: CDH3).

Conclusions: The study findings point to cell-type-specific mechanisms of brain stress response in PTSD and MDD, highlighting the importance of examining cell-type-specific gene expression and indicating promising novel biomarkers and therapeutic targets.

Keywords: Biological Markers; Genetics/Genomics; Glucocorticoid; Major Depressive Disorder; Posttraumatic Stress Disorder; RNA Sequencing.


Conflict of interest statement

Dr. Morrison is currently an employee of Neumora Therapeutics. Dr. McCullough is currently an employee of Jazz Pharmaceuticals. Dr. Carlezon has served as a consultant for PSY Therapeutics. Dr. Krystal has served as a consultant for Aptinyx, Biogen Idec MA, Bionomics (Australia), Boehringer Ingelheim International, Epiodyne, EpiVario, Janssen Research and Development, Jazz Pharmaceuticals, Otsuka America Pharmaceutical, Spring Care, and Sunovion Pharmaceuticals; he has served on scientific advisory boards for Biohaven Pharmaceuticals, BioXcel Therapeutics (clinical advisory board), Cerevel Therapeutics, Delix Therapeutics, Eisai, EpiVario, Jazz Pharmaceuticals, Neumora Therapeutics, Neurocrine Biosciences, Novartis Pharmaceuticals, Psycho-Genics, Takeda Pharmaceuticals, Tempero Bio, and Terran Biosciences; he has been involved in studies that have received medications from AstraZeneca, Cerevel, and Novartis; he is cofounder of Freedom Biosciences; he holds stock in Biohaven Pharmaceuticals, Freedom Biosciences, and Spring Health and stock options in Biohaven Pharmaceuticals Medical Sciences, Cartego Therapeutics, Damona Pharmaceuticals, Delix Therapeutics, EpiVario, Neumora Therapeutics, Rest Therapeutics, Tempero Bio, Terran Biosciences, and Tetricus; he serves as Editor on the editorial board of Biological Psychiatry; and he is named on patents and patent applications related to psychiatric disorders and treatments. Dr. Ressler has served as a consultant for Acer, Alkermes, Bionomics, BioXcel, and Jazz Pharmaceuticals and on scientific advisory boards for Janssen, Boehringer Ingelheim, the Brain Research Foundation, Resilience Therapeutics, Sage, Senseye, and Verily, and he has received sponsored research support from Alto Neuroscience, BrainsWay, and Takeda. Dr. Daskalakis has served as a consultant for BioVie Pharma and Sunovion Pharmaceuticals and has served on scientific advisory boards for Circular Genomics and Sentio Solutions. The other authors report no financial relationships with commercial interests.

Figures

FIGURE 1.
FIGURE 1.. Single-nucleus transcriptomics in PTSDa
a Panel A shows the single-nucleus RNA sequencing (snRNA-seq) workflow. To create a discovery data set, postmortem brain samples were taken from dorsolateral prefrontal cortex (DLPFC) of 32 individuals: 11 with posttraumatic stress disorder (PTSD), 10 with major depressive disorder (MDD), and 11 neurotypical control subjects (CON). Nuclei were isolated and encapsulated with barcoded gel beads, using the 10x Genomics microfluidic chips and device. Encapsulation was followed by nucleus lysis, library preparation, and sequencing. The mapped reads corresponded to ~415K nuclei (>13K cells per sample). Nuclei passing quality-control (QC) metrics were clustered. Cell clusters were annotated for cell type and cell subtype identity. Differential gene expression analysis identified snRNA-seq differentially expressed genes (snDEGs) in the major cell types based on two outcomes, PTSD and MDD, and replication was assessed by generating an snRNA-seq data set from an independent set of 15 individuals (five subjects per group) containing ~160K nuclei (>10K cells per sample). Pathway analyses of the identified snDEGs were conducted, followed by validation of a disease-associated pathway in induced pluripotentstem cell–derived mature neurons exposed to glucocorticoids. The overlap of the identified snDEGs with the geneticrisk of PTSD and MDD was evaluated through large-scale DLPFC-based summary-data-based Mendelian randomization (SMR) and transcriptome-wide association study (TWAS), and the overlap with genetic underpinnings of brain structure and connectivity was evaluated through DLPFC-based TWAS of DLPFC-based neuroimaging. Integrating the results across all data modalities highlighted the most convergent loci and genes. Panel B is a t-distributed stochastic neighbor embedding (t-SNE) plot of the post-QC 362,996 cells from the discovery data set, annotated into eight major cell types. Cell type annotation relied on cell-type-specific canonical and previously reported markers in prior snRNA-seq studies. Cell type proportions are indicated as percentage in the full dataset. OPC=oligodendrocyte precursor cells. Panel C shows eightt-SNEplots of the post-QC 362,996 cells annotated by major cell-type-specific canonical markers. Above each plot is the marker used for annotation, and cells with expression are shown with their respective color. Greater color intensity denotes greater expression of the respective marker. Genes used for cell type annotation were PLP1 for oligodendrocytes, PDGFRA for OPCs, AQP4 for astrocytes, FLT1 for endothelial cells, DCN for pericytes, DOCK8 for microglia, SLC17A7 for excitatory (EX) neurons, and GAD1 for inhibitory (IN) neurons. Arrows indicate the smaller cell clusters. Panel D is a t-SNE plot of the post-QC 362,996 cells, annotated into 22 cellsubtypes. Cell subtype annotation relied on known cell-type-specific markers. Two cell clusters were assigned to astrocyte subtypes, eight to EX subtypes, and seven to IN subtypes. Panel E is a dendrogram depicting hierarchical clustering between the 22 cell clusters based on the overall gene expression, and panel Fisa dot plot depicting gene expression levels of cell-type-specific markers used to annotate the cell clusters into cell types and subtypes. The color of the lettering of the name of each cell cluster corresponds to the major cell type they belong to (colors are matched with panel D). At the bottom are the genes used for cell type annotation. The size of each dot represents the percentage of cells expressing the gene, where the lower threshold was set at 25%. The color intensity denotes the average scaled expression level. Panels Gand Hareviolinplotsofgeneexpressionofcell-type-specificmarkersusedtoannotate EX and IN cell subtypes, respectively. Markers used are labeled on the right of each plot. The eight EX clusters’ annotation was based on the expression of cortical layer markers. The IN clusters’ annotation was based on the expression of genes associated with developmental origin (e.g., LHX6, ADARB2), corticallayer, calciumbinding (e.g., PVALB), neuropeptide signaling(e.g., SST, TAC1, VIP), and other canonical and noncanonical marker expression. Panel I is abar plot of the proportions of each of the major cell types in the control (CON), MDD, and PTSD groups. Similar cell type composition is observed in all three groups. Proportions are expressed as ratios and add up to 1.
FIGURE 2.
FIGURE 2.. Single-nucleus differentially expressed genes (snDEGs) in PTSDa
a Panel A shows volcano plots of the posttraumatic stress disorder (PTSD) differential gene expression (DGE) of the discovery sample in astrocytes and excitatory (EX) and inhibitory (IN) neurons. Colored dots denote nominally significant genes (p<0.05), and the darker colored dots denote genes with false discovery rate (FDR)–adjusted p<0.05 (termed discovery snDEGs: D-snDEGs). The genes that were found to be snDEGs in the replication data set are named on each plot. D-snDEGs that were also significantly associated with total number of traumatic events (FDR-adjusted p<0.05) are depicted as squares, and their names are in boldface if they were snDEGs in both discovery and replication. Panel B shows volcano plots of the major depressive disorder (MDD) differential gene expression of the discovery sample in EX and IN neurons. Colored dots denote nominally significant genes (p<0.05), and the darker colored dots denote genes with FDR-adjusted p<0.05 (D-snDEGs). The replicated D-snDEGs are named. Panel C shows the correlation of PTSD and MDD DGE in the discovery sample. Two types of correlation analyses were performed: Pearson correlation of standardized scores of fold changes (squares) and signed p values (circles). Data are represented as median ±1.5 interquartile range (IQR), and the individual points denote the correlation between PTSD and MDD for each cell type or bulk tissue. Dashed lines at coefficients 0.1, 0.3, and 0.6 annotate weak, moderate, and high strength of correlation, respectively. Panels D and E show the correlation of the DGE in association with PTSD and MDD, respectively, between cell types or bulk tissue in the discovery sample. Two types of correlation analyses were performed: Pearson correlation of standardized scores of fold changes (squares) and signed p values (circles). Cell type/bulk tissue box plots are ordered from highest (left) to lowest (right) median correlation. Data are represented as median ±1.5 IQR, and the individual points denote the correlation at each cell type or bulk tissue. Dashed lines at coefficients 0.1, 0.3, and 0.6 annotate weak, moderate, and high strength of correlation, respectively. Panels F and G show the correlation ofthe DGE in association with PTSD and MDD, respectively, between the discovery and replication samples. Two types of correlation analyses were performed: Pearson correlation of standardized scores of fold changes (squares) and signed p values (circles). Data are represented as median ±1.5 IQR, and the individual points denote the correlation at each cell type or bulk tissue. Dashed lines at coefficients 0.1, 0.3, and 0.6 annotate weak, moderate, and high strength of correlation, respectively. Panel H presents pie charts of the number of D-snDEGs and replicated D-snDEGs for PTSD and MDD. Panels I and J summarize the expression of the top five replicated D-snDEGs in association with PTSD/total number of traumatic events and MDD, respectively, in the discovery data set. The replicated D-snDEGs are ranked according to the p value in the discovery data set (lowest p values at the top). The red boxes correspond to the PTSD group (N=11), the green boxes to the MDD group (N=10), and the white boxes to the control group (N=11). The depicted genes are either EX (blue outline) or IN (red outline) neurons’ D-snDEGs. The y-axis depicts adjusted expression. Data are represented as median ±1.5 IQR, and the individual subject values are depicted as circles. For each gene, the t statistic and p value of the group differences (PTSD vs. control and MDD vs. control) were estimated by the limma-based DGE analysis and are included in Tables S6 and S7 in the online supplement.
FIGURE 3.
FIGURE 3.. Alterations in network, pathway, and upstream regulator activity in PTSD and MDDa
a Panel A shows the module eigengene (ME) expression of coexpression networks associated with major depressive disorder (MDD). Expression of modules with false discovery rate (FDR)–adjusted p<0.05 is plotted. For each module, the t statistic and p value of the group differences (posttraumatic stress disorder [PTSD] vs. control and MDD vs. control) were estimated by the differential ME expression analysis and are included in Table S11B in the online supplement. Fold change values and p values are shown above each plot. Information about the number of coexpressed genes in each module and the cell type (excitatory [EX] or inhibitory [IN] neurons) is provided in the y-axis labels. Each module was subjected to Gene Ontology (GO) enrichment analysis, and the top three enrichment terms are shown together with the FDR-adjusted p value <0.05. The top 10 hub genes in each module are also displayed in the last column. The hub genes that are significant single-nucleus differentially expressed genes in the discovery data set (D-snDEGs) are in boldface, and replicated D-snDEGs are in boldface and underlined. In panel B, gene-set enrichment analysis identified 54 pathways with differential enrichments in PTSD compared with MDD in EX and/or IN neurons. Depicted pathways are from C2-curated gene sets from Molecular Signatures Database. Each cell represents the normalized enrichment score (NES) of the respective pathway, with red indicating positive enrichment and blue negative enrichment; the intensity of the color denotes the magnitude of the effect. An asterisk indicates that the enrichment of the respective gene set was nominally significant (p<0.05), and a hash sign indicates that the enrichment of the respective gene set was FDR significant (FDR-adjusted p<0.05). Biclustering was based on pathway NESs for PTSD and MDD in EX and IN neurons. The clustering of columns (MDDEX, MDDIN, PTSDIN, and PTSDEX) is depicted, and rows (pathways) are clustered in four blocks (separated by white space). In panel C, upstream regulator analysis highlights that networks of cytokines, hormones, and other regulatory molecules are differentially activated in MDD and PTSD. Upstream regulator analysis was performed using Ingenuity Pathway Analysis (IPA). The heat map shows the predicted activity of upstream regulators that were FDR significant in both cell types in at least one disorder. Each cell represents the activation z score of the respective upstream regulator, with red indicating positive z score (activated), blue negative z score (inhibited), and gray not predicted activity; the intensity of the color denotes the magnitude of the effect. An asterisk indicates that the upstream regulator was nominally significant (p<0.05), and a hash sign indicates that the upstream regulator was FDR significant (FDR-adjusted p<0.05). Biclustering was based on activation z scores for PTSD and MDD in EX and IN neurons. The columns (upstream regulators) are clustered within the functional class they belong to (cytokines, endogenous and exogenous chemicals, growth factors, transcription factors [TF], and kinases) and the rows are clustered by DGE signature (MDD EX, MDD IN, PTSD IN, and PTSD EX). CORT=corticosterone; DEX=dexamethasone; E2=estradiol; GH=growth hormone; LPS=liposaccharide; P4=progesterone; TF=transcription factors; TPA=12-O-tetrade-canoylphorbol-13-acetate. Panel D is a heat map with the gene overlap of target genes of upstream regulators with the respective pathways. The top five upstream regulators based on their overlap with pathways are depicted. Each cell represents the NES of the respective pathway, with the green color intensity denoting the level of significance of the overlap. DEX=dexamethasone; E2=estradiol; LPS=liposaccharide. Panel E shows mechanistic networks for dexamethasone effects in MDD IN neurons (upper) and PTSD EX neurons (lower). The mechanistic network of the upstream regulators and their relationship were predicted by IPA. The molecules (nodes) shown in blue are predicted to be inhibited, and those shown in orange are predicted to be activated; color intensity represents the level of inhibition or activation. Lines (edges) ending with an arrow indicate activation, and lines without an arrow indicate inhibition. Blue lines represent weakened relationship, orange lines represent strengthened relationship, yellow lines represent inconsistent effects relative to the state of downstream molecule, and gray lines represent interactions for which direction of change is not predicted. Continuous and dashed lines indicate direct and indirect effects, respectively. The shapes of the nodes reflect the functional class of molecule product: transcription regulator (ellipse), cytokine/growth factor (square), ligand-dependent nuclear receptor (rectangle), and complex/group/other (circle).
FIGURE 4.
FIGURE 4.. In vitro validation of a single-nucleus RNA-seq–discovered pathway with iPSC-derived neuronsa
a Panel A shows results of the enrichment of genome-wide association studies (GWASs) of posttraumatic stress disorder (PTSD) and major depressive disorder (MDD) summary statistics in cell-type-specific markers for induced pluripotent stem cells (iPSCs), peripheral blood mononuclear cells (PBMCs), and cortical neurons. Each point represents the negative logarithm of the MAGMA-based enrichment p value (y-axis) for each literature-reported marker gene set (x-axis) (see marker gene sets in Table S14 in the online supplement). The shapes denote the two different input GWASs’ summary statistics (square=PTSD; triangle=MDD), and error bars indicate standard error of the mean. Opaque dots denote cell-type-specific markers that were false discovery rate (FDR) significant. Panel B illustrates iPSCs being differentiated into cortical neurons. The top left panel is a bright-field image of an iPSC colony displaying nominal cellular morphology; the bottom left panel is an immunofluorescence image of iPSCs expressing the canonical nuclear pluripotency marker NANOG (green). The top right panel is a bright-field image of iPSC-derived cortical cultures after ~60 days of differentiation displaying expansive neurite arborization and connectivity; the bottom right panel is an immunofluorescence image of neurons expressing the mature neuron markers for cytoskeleton and nucleus, MAP2 (green), and NeuN (red). DAPI is used as a nuclear counterstain. Scale bars are 100 mm. Panel C shows gene expression in control iPSC-derived neurons of literature-reported cell-type-specific markers for iPSCs, PBMCs, and neurons (see Table S14 in the online supplement). Blue denotes the iPSCs’ marker set, orange the PBMCs’ marker set, and red the neurons’ marker set. Data are represented as box plots of normalized expression (log2 scale), with data points labeled with their corresponding marker gene. The between-gene-set differences in expression were estimated by two-tailed Wilcoxon signed-rank test. Panel D shows representative micrographs of glucocorticoid receptor (GR) in iPSC-derived neurons. Cells were stained with the neuronal nuclear marker NeuN (red), the GR protein (green), and the nuclear DNA marker DAPI (blue). The left panel is of iPSC-derived neurons in vehicle conditions, with minimal GR signal localized in the nucleus. The right panel is of iPSC-derived neurons exposed to 100 nM dexamethasone (DEX) for 1 hour, showing that GR signal has been translocated into the nuclei. White arrows indicate colocalization of GR with NeuN. Panel E shows nuclear GR levels, with quantification of the average ratio of GR signal to nucleus area for individual neuronal nuclei across control (0 nM) and 100 nM DEX conditions, with DEX-treated neurons having a higher ratio of GR signal in their nuclei (control group, N=122 nuclei; DEX group, N=157 nuclei). Data are represented as violin plots using a fold change (from the mean of the control group). The p value of the group difference was estimated by a two-tailed Wilcoxon signed-rank test. Panel F shows DEX-induced increased levels of phosphorylated GR at Ser211 (pGR-Ser211), indicative of an activated and nucleus-localized GR in iPSC-derived neurons (control group, 0 nM DEX; DEX group, 100 nM DEX). Data are represented as mean fold change (from the control group) ± standard error of the mean. The p value of the group difference was estimated by a two-tailed unpaired t test. Panel G shows DEX-induced increase in FKBP5 protein levels (in fold change), indicative of direct GR-binding to the FKBP5 gene leading to upregulation. FKBP5 protein was measured by capillary-based immunoblotting (control group, 0 nM DEX; DEX group, 100 nM DEX). Data are represented as mean fold change (from the control group) ± standard error of the mean. The p value of the group difference was estimated by a two-tailed unpaired t test. Panel H is a volcano plot illustrating the relationship of p value with fold changes of differential gene expression (DGE) results based on 100 nM versus 0 nM DEX in iPSC-derived neurons. Green denotes downregulation, and purple denotes upregulation. Dots with high-intensity color indicate differentially expressed genes with FDR-adjusted p<0.05. Low-intensity color denotes p<0.05. Gray dots indicate that the gene was not significant. The top genes with p<1.0–27 have been named. Panels I and J are rank-rank hypergeometric overlap (RRHO) plots between DEX-induced DGE in iPSC-derived neurons and PTSD and MDD neuronal DGE, respectively (excitatory neurons [EX] at left and inhibitory neurons[IN] at right). For this analysis, genes in each DGE list were ranked according to the product of the sign of log2(fold change) with −log10(p). The plotted RRHO heat map represents the extent of overlap with the colors based on −log10(p) of the hypergeometric test measuring the significance of overlap of gene lists. Warm colors in the bottom left and top right quadrants reflect overlap in genes with upregulation or downregulation, respectively, in both data sets. Warm colors in the top left and bottom right quadrants reflect overlaps in genes with opposite direction of effects in the two data sets. The coefficient (ρ) of Spearman correlations based on the ranking metrics are given as reference of effect size of the relationship. Panels Kand L present scatterplots of z statistics of the PTSD effect and MDD effect, respectively, in EX neurons and IN neurons with DEX effect in iPSC-derived neurons. Nominally significant genes in each pair of analyses were selected, and genes with z score (of signed p value) >3 in the PTSD and/or the MDD analysis, respectively, are named. Each red circle corresponds to a gene and denotes the PTSD effect or the MDD effect in EX neurons paired with the DEX effect in iPSC-derived neurons, and each blue triangle corresponds to a gene and denotes the PTSD effect or the MDD effect in IN neurons paired with the DEX effect in iPSC-derived neurons. For each panel, the regression line was plotted along with the confidence interval, and the Pearson correlation coefficient, the p value, and the size of the gene set are listed. Inserts show also the respective normalized enrichment score (NES) of PTSD and MDD DGE signatures for DEX-regulated genes (up or down) in iPSC-derived neurons’ DGE. An asterisk indicates significant enrichment.
FIGURE 5.
FIGURE 5.. Highlighting the most important genes upon integration of all the reported data modalities in this studya
a Panel A is an integrative dot plot with all genes that were false discovery rate (FDR) significant in at least two analyses used in this study. The genes are listed from bottom to top in increasing chromosomal position order, with the gray boxes annotating genes that belong to the same chromosome. Purple denotes significant results from the dorsolateral prefrontal cortex (DLPFC) single-nucleus RNA-seq analysis; squares depict significant posttraumatic stress disorder (PTSD) single-nucleus differentially expressed genes in the discovery data set (D-snDEGs), and circles depict major depressive disorder (MDD) D-snDEGs. A purple line surrounding the square indicates that the PTSD D-snDEG was also associated with number of traumatic events, and a black line surrounding the square indicates that a replicated PTSD D-snDEG was also associated with number of traumatic events. Blue denotes significant results from DLPFC-based transcriptome-wide association study (TWAS) or summary-data-based Mendelian randomization (SMR) analyses; squares depict PTSD FDR-significant genes, and circles depict MDD FDR-significant genes. Pink triangles denote TWAS genes of DLPFC-based neuroimaging, and orange triangles denote FDR-significant genes based on dexamethasone (DEX) treatment in iPSC-derivedneurons. Black denotes significant results from the previous DLPFC bulk-tissue RNA-seq study (22), with squares and circles depicting PTSD and MDD FDR-significant differentially expressed genes, respectively. In panel B, D-snDEG genes that were significant in more than one data modality or in both disorders in any modality are depicted on their chromosomal location. The 17q21.31 locus had four of such genes, and there was no other locus with more than one such gene.

References

    1. Substance Abuse and Mental Health Services Administration: Results From the 2010 National Survey on Drug Use and Health: Summary of National Findings. Rockville, Md, Substance Abuse and Mental Health Services Administration, September 2011. https://www.samhsa.gov/data/sites/default/files/NSDUHNationalFindingsRes...
    1. Goldstein RB, Smith SM, Chou SP, et al. : The epidemiology of DSM-5 posttraumatic stress disorder in the United States: results from the National Epidemiologic Survey on Alcohol and Related Conditions–III. Soc Psychiatry Psychiatr Epidemiol 2016; 51:1137–1148 - PMC - PubMed
    1. Wisco BE, Marx BP, Wolf EJ, et al. : Posttraumatic stress disorder in the US veteran population: results from the National Health and Resilience in Veterans Study. J Clin Psychiatry 2014; 75:1338–1346 - PMC - PubMed
    1. Gillespie CF, Bradley B, Mercer K, et al. : Trauma exposure and stress-related disorders in inner city primary care patients. Gen Hosp Psychiatry 2009; 31:505–514 - PMC - PubMed
    1. Flory JD, Yehuda R: Comorbidity between post-traumatic stress disorder and major depressive disorder: alternative explanations and treatment considerations. Dialogues Clin Neurosci 2015; 17:141–150 - PMC - PubMed

Publication types

MeSH terms

Substances

LinkOut - more resources