Cardiac surgery risk prediction using ensemble machine learning to incorporate legacy risk scores: A benchmarking study
- PMID: 37492033
- PMCID: PMC10363892
- DOI: 10.1177/20552076231187605
Cardiac surgery risk prediction using ensemble machine learning to incorporate legacy risk scores: A benchmarking study
Abstract
Objective: The introduction of new clinical risk scores (e.g. European System for Cardiac Operative Risk Evaluation (EuroSCORE) II) superseding original scores (e.g. EuroSCORE I) with different variable sets typically result in disparate datasets due to high levels of missingness for new score variables prior to time of adoption. Little is known about the use of ensemble learning to incorporate disparate data from legacy scores. We tested the hypothesised that Homogenenous and Heterogeneous Machine Learning (ML) ensembles will have better performance than ensembles of Dynamic Model Averaging (DMA) for combining knowledge from EuroSCORE I legacy data with EuroSCORE II data to predict cardiac surgery risk.
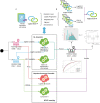
Methods: Using the National Adult Cardiac Surgery Audit dataset, we trained 12 different base learner models, based on two different variable sets from either EuroSCORE I (LogES) or EuroScore II (ES II), partitioned by the time of score adoption (1996-2016 or 2012-2016) and evaluated on holdout set (2017-2019). These base learner models were ensembled using nine different combinations of six ML algorithms to produce homogeneous or heterogeneous ensembles. Performance was assessed using a consensus metric.
Results: Xgboost homogenous ensemble (HE) was the highest performing model (clinical effectiveness metric (CEM) 0.725) with area under the curve (AUC) (0.8327; 95% confidence interval (CI) 0.8323-0.8329) followed by Random Forest HE (CEM 0.723; AUC 0.8325; 95%CI 0.8320-0.8326). Across different heterogenous ensembles, significantly better performance was obtained by combining siloed datasets across time (CEM 0.720) than building ensembles of either 1996-2011 (t-test adjusted, p = 1.67×10⁻⁶) or 2012-2019 (t-test adjusted, p = 1.35×10-193) datasets alone.
Conclusions: Both homogenous and heterogenous ML ensembles performed significantly better than DMA ensemble of Bayesian Update models. Time-dependent ensemble combination of variables, having differing qualities according to time of score adoption, enabled previously siloed data to be combined, leading to increased power, clinical interpretability of variables and usage of data.
Keywords: Cardiac surgery; dynamic model averaging; ensemble learning; legacy scores; machine learning; mortality; multi-modal data; risk prediction.
© The Author(s) 2023.
Conflict of interest statement
The author(s) declared no potential conflicts of interest with respect to the research, authorship, and/or publication of this article.
Figures


Similar articles
-
Performance Drift in Machine Learning Models for Cardiac Surgery Risk Prediction: Retrospective Analysis.JMIRx Med. 2024 Jun 12;5:e45973. doi: 10.2196/45973. JMIRx Med. 2024. PMID: 38889069 Free PMC article.
-
Comparison of machine learning techniques in prediction of mortality following cardiac surgery: analysis of over 220 000 patients from a large national database.Eur J Cardiothorac Surg. 2023 Jun 1;63(6):ezad183. doi: 10.1093/ejcts/ezad183. Eur J Cardiothorac Surg. 2023. PMID: 37154705 Free PMC article.
-
A comparative study of heterogeneous and homogeneous ensemble approaches for landslide susceptibility assessment in the Djebahia region, Algeria.Environ Sci Pollut Res Int. 2024 Jun;31(28):40554-40580. doi: 10.1007/s11356-023-26247-3. Epub 2023 Mar 9. Environ Sci Pollut Res Int. 2024. PMID: 36892699
-
Corn Yield Prediction With Ensemble CNN-DNN.Front Plant Sci. 2021 Aug 2;12:709008. doi: 10.3389/fpls.2021.709008. eCollection 2021. Front Plant Sci. 2021. PMID: 34408763 Free PMC article.
-
Ensemble machine learning model trained on a new synthesized dataset generalizes well for stress prediction using wearable devices.J Biomed Inform. 2023 Dec;148:104556. doi: 10.1016/j.jbi.2023.104556. Epub 2023 Dec 2. J Biomed Inform. 2023. PMID: 38048895
Cited by
-
The robot butler: How and why should we study predictive algorithms and artificial intelligence (AI) in healthcare?Digit Health. 2024 Mar 24;10:20552076241241674. doi: 10.1177/20552076241241674. eCollection 2024 Jan-Dec. Digit Health. 2024. PMID: 38528969 Free PMC article.
-
A review of evaluation approaches for explainable AI with applications in cardiology.Artif Intell Rev. 2024;57(9):240. doi: 10.1007/s10462-024-10852-w. Epub 2024 Aug 9. Artif Intell Rev. 2024. PMID: 39132011 Free PMC article.
-
Performance Drift in Machine Learning Models for Cardiac Surgery Risk Prediction: Retrospective Analysis.JMIRx Med. 2024 Jun 12;5:e45973. doi: 10.2196/45973. JMIRx Med. 2024. PMID: 38889069 Free PMC article.
-
Enhancing Cardiovascular Risk Prediction: Development of an Advanced Xgboost Model with Hospital-Level Random Effects.Bioengineering (Basel). 2024 Oct 18;11(10):1039. doi: 10.3390/bioengineering11101039. Bioengineering (Basel). 2024. PMID: 39451414 Free PMC article.
-
Triglyceride index as a predictor of mortality after cardiac surgery.iScience. 2024 Oct 5;27(11):111107. doi: 10.1016/j.isci.2024.111107. eCollection 2024 Nov 15. iScience. 2024. PMID: 39620137 Free PMC article.
References
-
- Nashef SAM, Roques F, Michel P, et al.European system for cardiac operative risk evaluation (EuroSCORE). Eur J Cardiothorac Surg 1999; 16: 9–13. - PubMed
-
- Ad N, Holmes SD, Patel J, et al.Comparison of EuroSCORE II, original EuroSCORE, and the society of thoracic surgeons risk score in cardiac surgery patients. Ann Thorac Surg 2016; 102: 573–579. - PubMed
-
- Roques F, Nashef SAM, Michel P, et al.Risk factors and outcome in European cardiac surgery: analysis of the EuroSCORE multinational database of 19030 patients. Eur J Cardiothorac Surg 1999; 15: 816–823. - PubMed
-
- Gummert JF, Funkat A, Osswald B, et al.EuroSCORE overestimates the risk of cardiac surgery: results from the national registry of the German society of thoracic and cardiovascular surgery. Clin Res Cardiol 2009; 98: 363–369. - PubMed
-
- Nashef SAM, Roques F, Sharples LD, et al.EuroSCORE II. Eur J Cardiothorac Surg 2012; 41: 734–745. - PubMed
Grants and funding
LinkOut - more resources
Full Text Sources

