

Periprostatic adipose tissue (PPAT) supernatant from obese mice releases anticontractile substances and increases human prostate epithelial cell proliferation: the role of nitric oxide and adenosine
- PMID: 37492091
- PMCID: PMC10364323
- DOI: 10.3389/fphar.2023.1145860
Periprostatic adipose tissue (PPAT) supernatant from obese mice releases anticontractile substances and increases human prostate epithelial cell proliferation: the role of nitric oxide and adenosine
Abstract
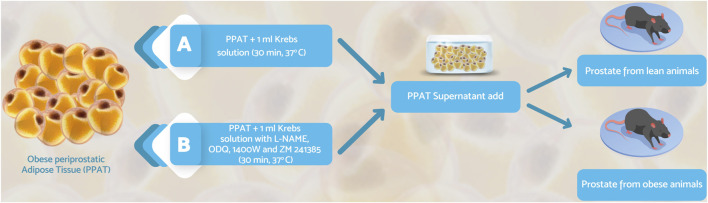
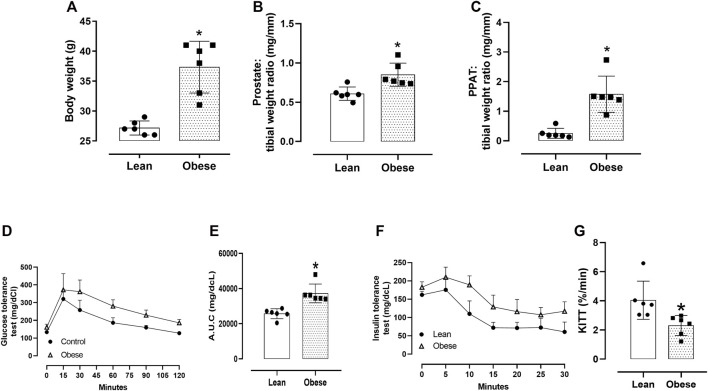
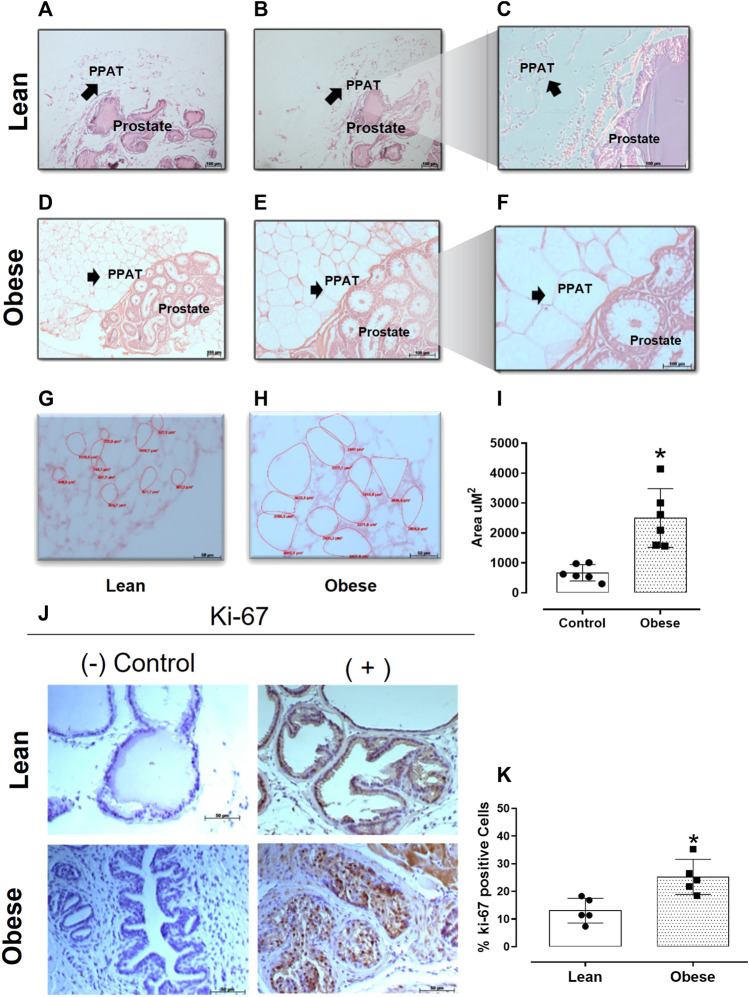
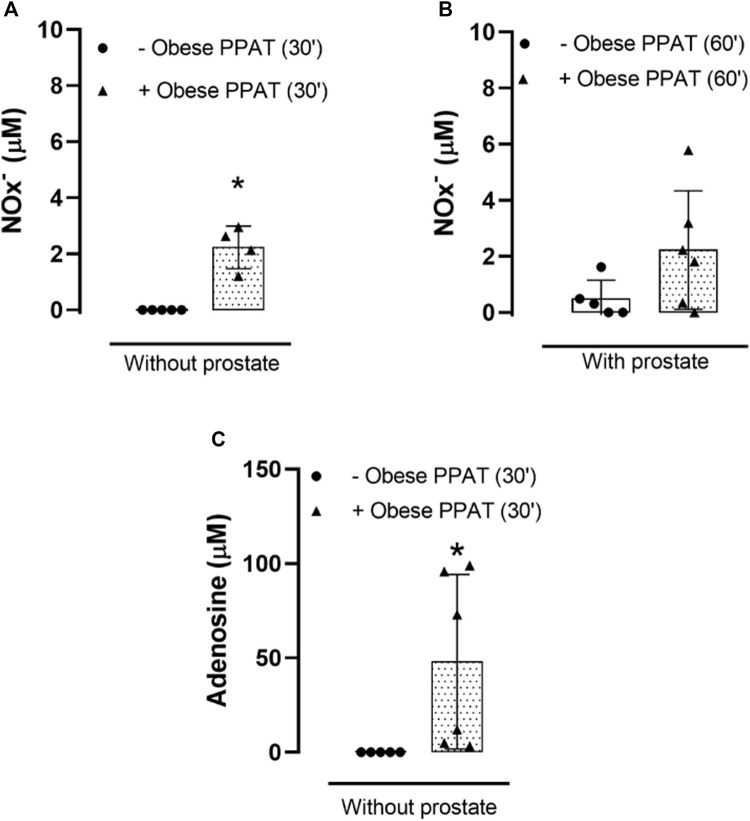
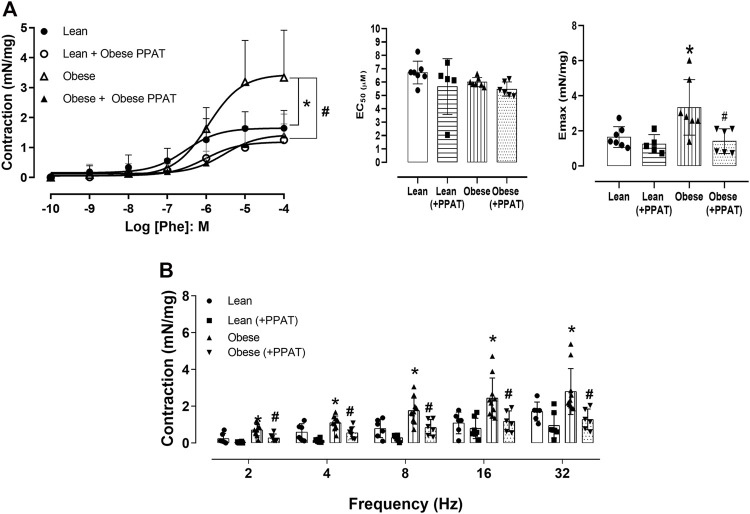
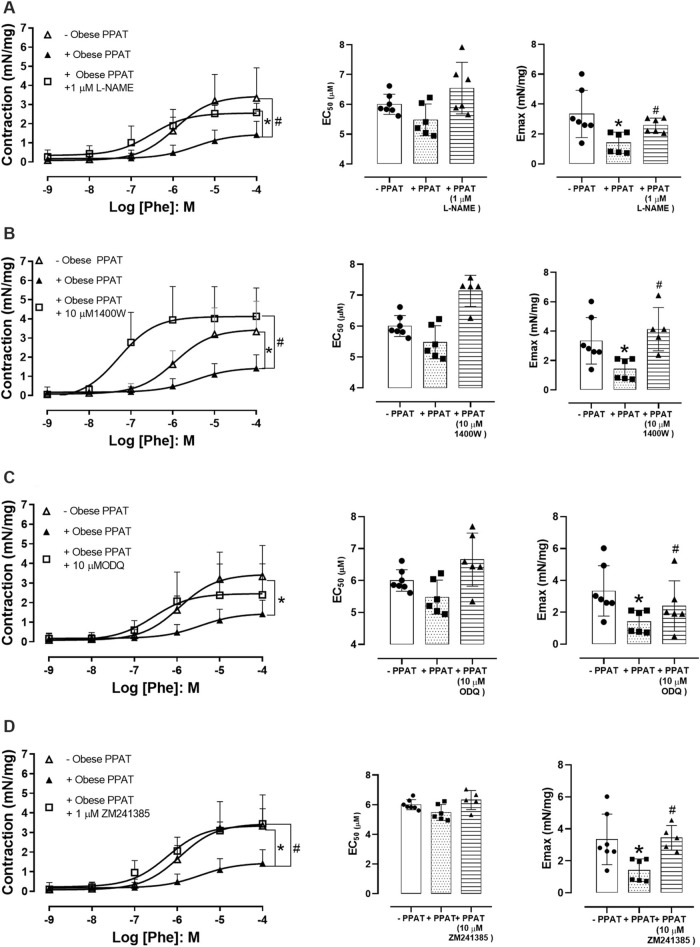
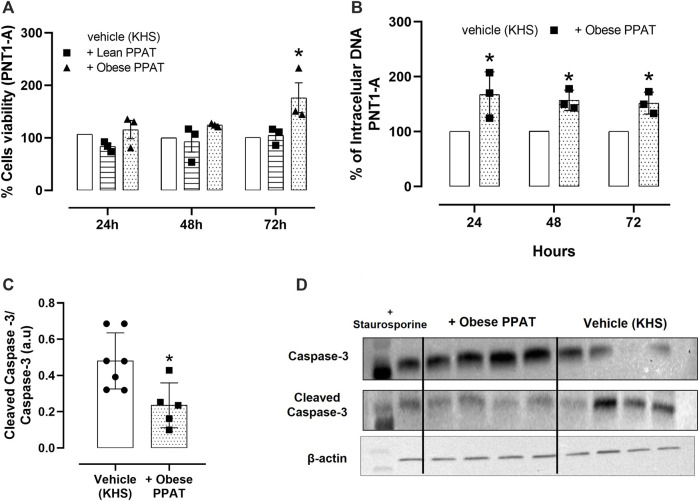
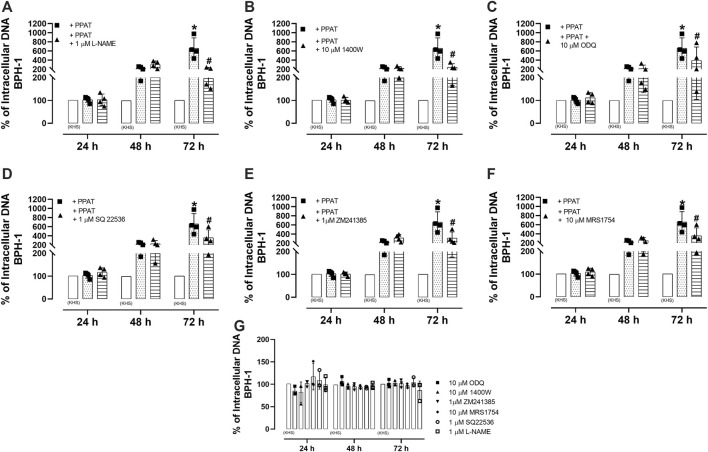
Background: The prostate gland is surrounded by periprostatic adipose tissue (PPAT) that can release mediators that interfere in prostate function. In this study, we examined the effect of periprostatic adipose tissue supernatant obtained from obese mice on prostate reactivity in vitro and on the viability of human prostatic epithelial cell lines. Methods: Male C57BL/6 mice were fed a standard or high-fat diet after which PPAT was isolated, incubated in Krebs-Henseleit solution for 30 min (without prostate) or 60 min (with prostate), and the supernatant was then collected and screened for biological activity. Total nitrate and nitrite (NOx-) and adenosine were quantified, and the supernatant was then collected and screened for biological activity. NOx- and adenosine were quantified. Concentration-response curves to phenylephrine (PE) were obtained in prostatic tissue from lean and obese mice incubated with or without periprostatic adipose tissue. In some experiments, periprostatic adipose tissue was co-incubated with inhibitors of the nitric oxide (NO)-cyclic guanosine monophosphate pathway (L-NAME, 1400W, ODQ), adenylate cyclase (SQ22536) or with adenosine A2A (ZM241385), and A2B (MRS1754) receptor antagonists. PNT1-A (normal) and BPH-1 (hyperplasic) human epithelial cells were cultured and incubated with supernatant from periprostatic adipose tissue for 24, 48, or 72 h in the absence or presence of these inhibitors/antagonists, after which cell viability and proliferation were assessed. Results: The levels of NOx- and adenosine were significantly higher in the periprostatic adipose tissue supernatant (30 min, without prostate) when compared to the vehicle. A trend toward an increase in the levels of NOX was observed after 60 min. PPAT supernatant from obese mice significantly reduced the PE-induced contractions only in prostate from obese mice. The co-incubation of periprostatic adipose tissue with L-NAME, 1400W, ODQ, or ZM241385 attenuated the anticontractile activity of the periprostatic adipose tissue supernatant. Incubation with the supernatant of periprostatic adipose tissue from obese mice significantly increased the viability of PNT1-A cells and attenuated expression of the apoptosis marker protein caspase-3 when compared to cells incubated with periprostatic adipose tissue from lean mice. Hyperplastic cells (BPH-1) incubated with periprostatic adipose tissue from obese mice showed greater proliferation after 24 h, 48 h, and 72 h compared to cells incubated with culture medium alone. BPH-1 cell proliferation in the presence of PPAT supernatant was attenuated by NO-signaling pathway inhibitors and by adenosine receptor antagonists after 72 h. Conclusion: NO and adenosine are involved in the anticontractile and pro-proliferative activities of periprostatic adipose tissue supernatant from obese mice. More studies are needed to determine whether the blockade of NO and/or adenosine derived from periprostatic adipose tissue can improve prostate function.
Keywords: PPAT; adenosine; benign prostatic hyperplasia; cell proliferation; nitric oxide; obesity; prostate.
Copyright © 2023 Passos, de Oliveira, Ghezzi, Mello, Levi D’Ancona, Teixeira, Muscará, Grespan Bottoli, Vilela de Melo, de Oliveira, Antunes and Mónica.
Conflict of interest statement
The authors declare that the research was conducted in the absence of any commercial or financial relationships that could be construed as a potential conflict of interest.
Figures
Similar articles
-
The Role of Periprostatic Adipose Tissue on Prostate Function in Vascular-Related Disorders.Front Pharmacol. 2021 Feb 12;12:626155. doi: 10.3389/fphar.2021.626155. eCollection 2021. Front Pharmacol. 2021. PMID: 33643052 Free PMC article. Review.
-
Influence of the periprostatic adipose tissue in obesity-associated mouse urethral dysfunction and oxidative stress: Effect of resveratrol treatment.Eur J Pharmacol. 2018 Oct 5;836:25-33. doi: 10.1016/j.ejphar.2018.08.010. Epub 2018 Aug 11. Eur J Pharmacol. 2018. PMID: 30102890
-
Obesity does not promote tumorigenesis of localized patient-derived prostate cancer xenografts.Oncotarget. 2016 Jul 26;7(30):47650-47662. doi: 10.18632/oncotarget.10258. Oncotarget. 2016. PMID: 27351281 Free PMC article.
-
Tumoral periprostatic adipose tissue exovesicles-derived miR-20a-5p regulates prostate cancer cell proliferation and inflammation through the RORA gene.J Transl Med. 2024 Jul 15;22(1):661. doi: 10.1186/s12967-024-05458-3. J Transl Med. 2024. PMID: 39010137 Free PMC article.
-
Periprostatic Adipose Tissue Microenvironment: Metabolic and Hormonal Pathways During Prostate Cancer Progression.Front Endocrinol (Lausanne). 2022 Apr 13;13:863027. doi: 10.3389/fendo.2022.863027. eCollection 2022. Front Endocrinol (Lausanne). 2022. PMID: 35498409 Free PMC article. Review.
Cited by
-
Examining the safety of mirabegron: an analysis of real-world pharmacovigilance data from the US FDA adverse event reporting system (FAERS) database.Front Pharmacol. 2024 Mar 18;15:1376535. doi: 10.3389/fphar.2024.1376535. eCollection 2024. Front Pharmacol. 2024. PMID: 38562462 Free PMC article.
-
Adenosine signaling: a potential therapeutic target for psychogenic erectile dysfunction.Am J Transl Res. 2024 Dec 15;16(12):7248-7261. doi: 10.62347/YZDZ1428. eCollection 2024. Am J Transl Res. 2024. PMID: 39822506 Free PMC article. Review.
-
Identifying genes associated with Sorafenib resistance in hepatocellular carcinoma to develop risk model.Discov Oncol. 2025 Aug 20;16(1):1587. doi: 10.1007/s12672-025-03442-x. Discov Oncol. 2025. PMID: 40835789
References
-
- Abrams P., Chapple C., Khoury S., Roehrborn C., de la Rosette J. International Consultation on New Developments in Prostate Cancer and Prostate Diseases (2013). Evaluation and treatment of lower urinary tract symptoms in older men. J. Urol. 189 (1), S93–S101. 10.1016/j.juro.2012.11.021 - DOI - PubMed
-
- Alexandre E. C., Calmasini F. B., Sponton A. C. D. S., de Oliveira M. G., André D. M., Silva F. H., et al. (2018). Influence of the periprostatic adipose tissue in obesity-associated mouse urethral dysfunction and oxidative stress: Effect of resveratrol treatment. Eur. J. Pharmacol. 5 (836), 25–33. 10.1016/j.ejphar.2018.08.010 - DOI - PubMed
LinkOut - more resources
Full Text Sources
Research Materials