. 2023 May 11;3(7):100321.
doi: 10.1016/j.xgen.2023.100321. eCollection 2023 Jul 12.

Impact of supraphysiologic MDM2 expression on chromatin networks and therapeutic responses in sarcoma

Affiliations

Impact of supraphysiologic MDM2 expression on chromatin networks and therapeutic responses in sarcoma

Samantha M Bevill et al. Cell Genom. .

Abstract

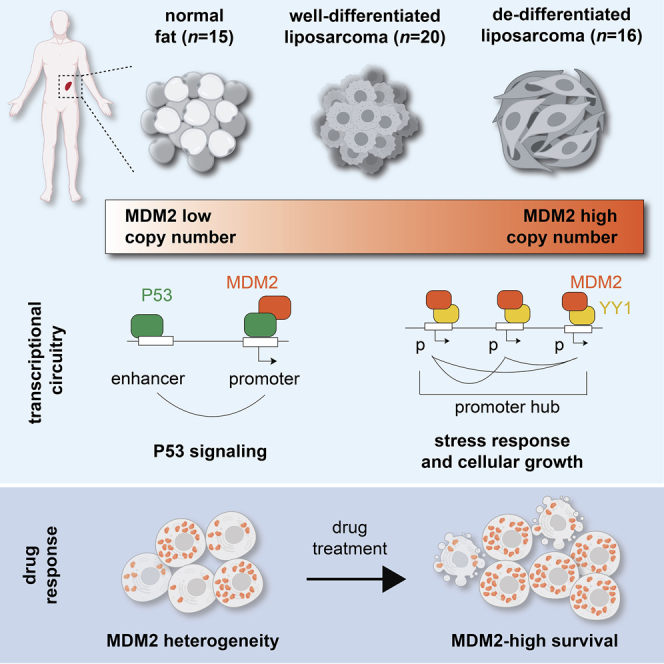
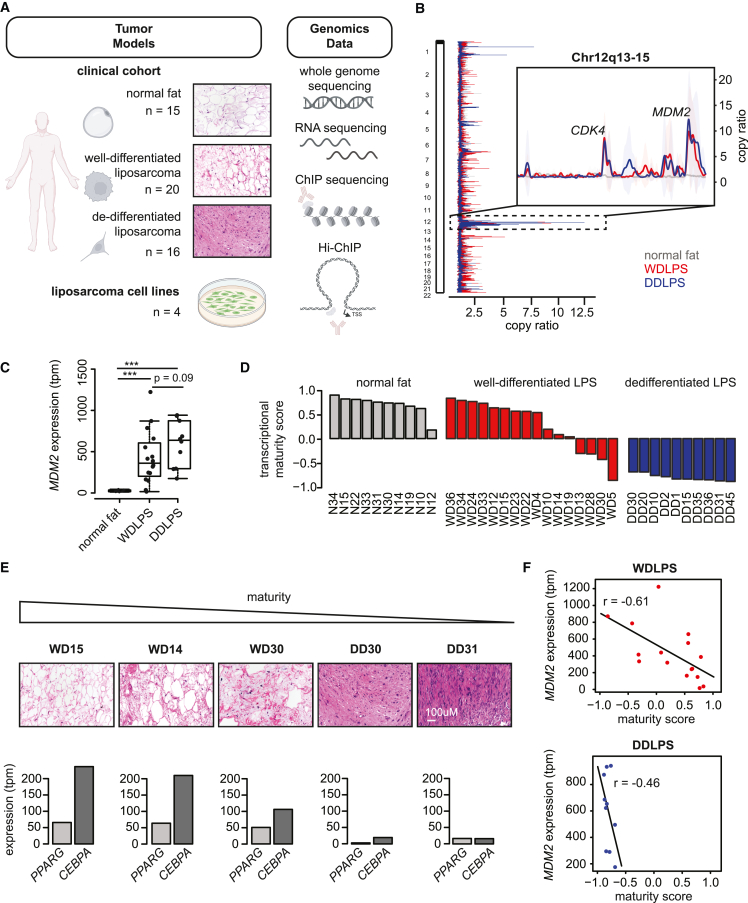
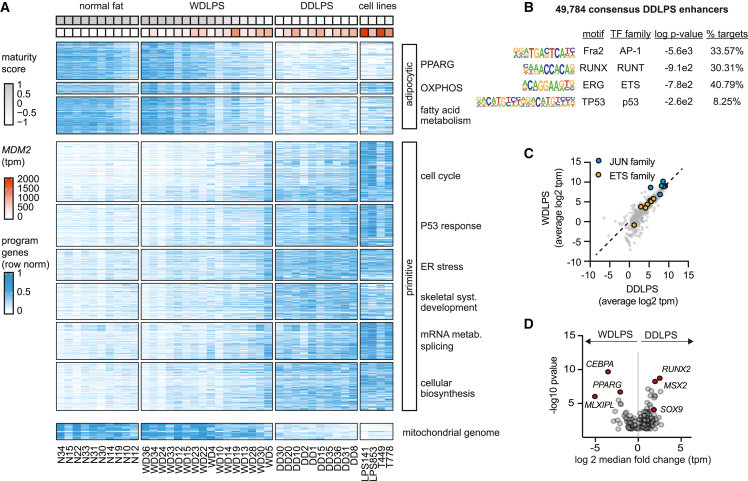
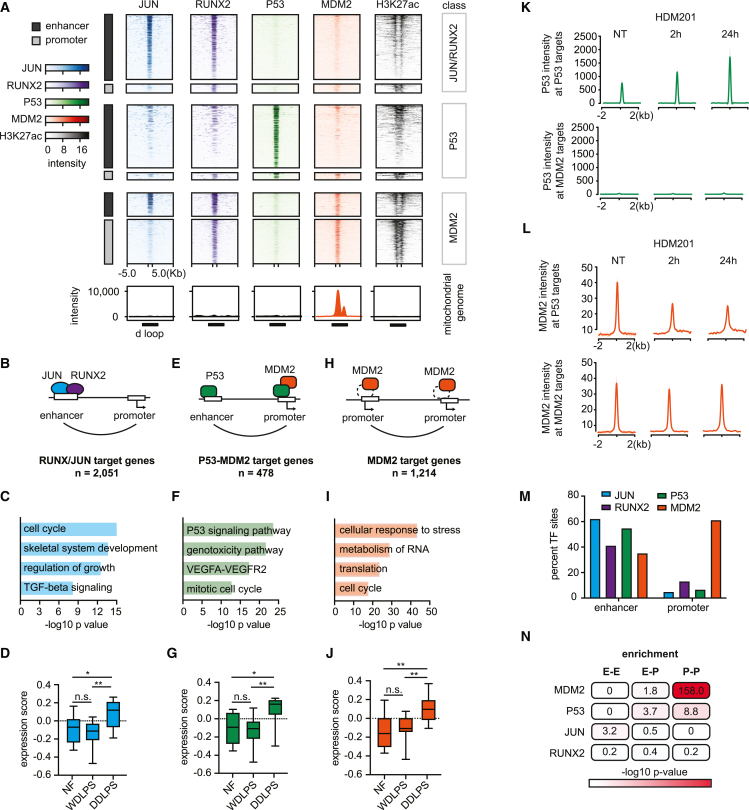
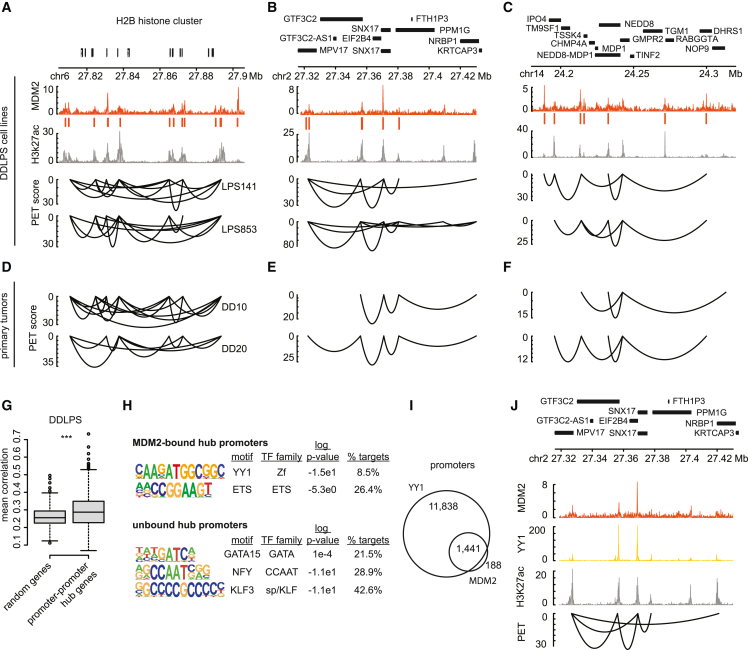
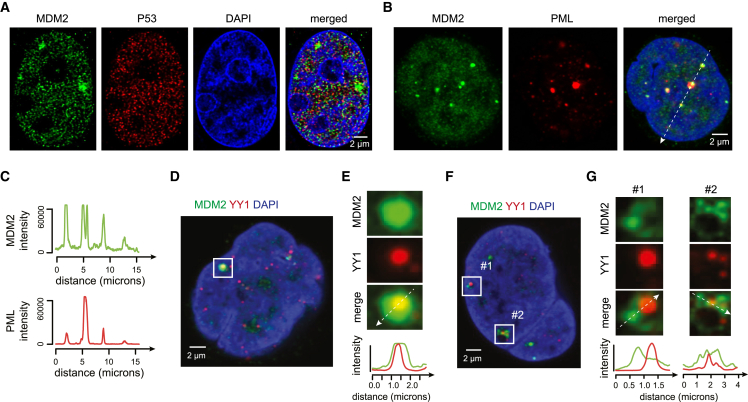
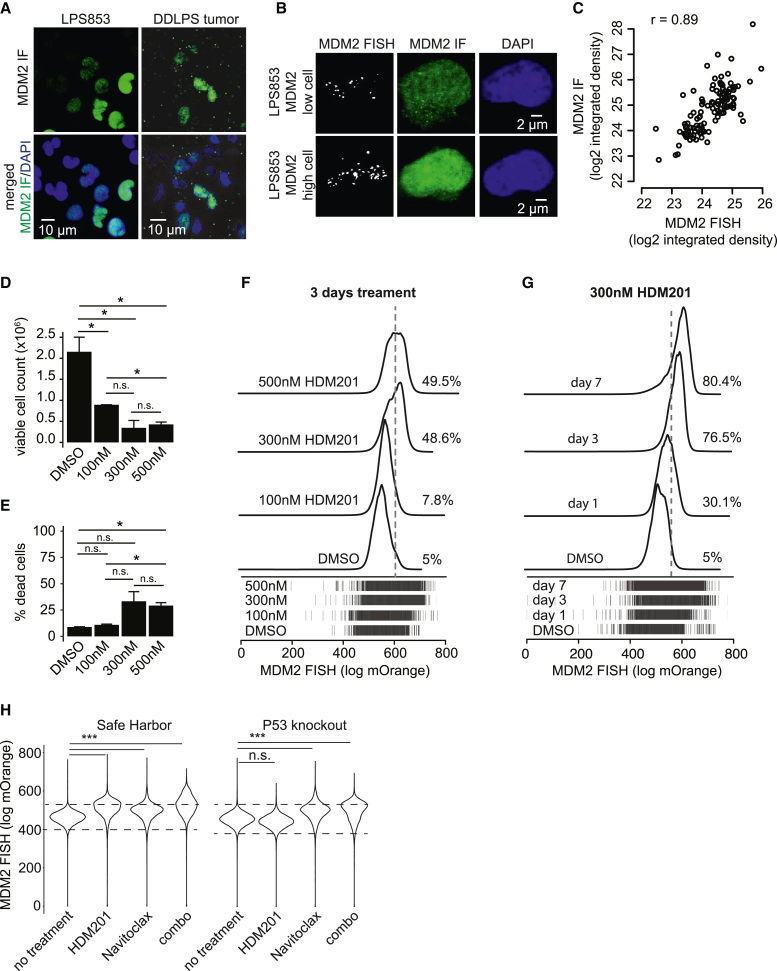
Amplification of MDM2 on supernumerary chromosomes is a common mechanism of P53 inactivation across tumors. Here, we investigated the impact of MDM2 overexpression on chromatin, gene expression, and cellular phenotypes in liposarcoma. Three independent regulatory circuits predominate in aggressive, dedifferentiated tumors. RUNX and AP-1 family transcription factors bind mesenchymal gene enhancers. P53 and MDM2 co-occupy enhancers and promoters associated with P53 signaling. When highly expressed, MDM2 also binds thousands of P53-independent growth and stress response genes, whose promoters engage in multi-way topological interactions. Overexpressed MDM2 concentrates within nuclear foci that co-localize with PML and YY1 and could also contribute to P53-independent phenotypes associated with supraphysiologic MDM2. Importantly, we observe striking cell-to-cell variability in MDM2 copy number and expression in tumors and models. Whereas liposarcoma cells are generally sensitive to MDM2 inhibitors and their combination with pro-apoptotic drugs, MDM2-high cells tolerate them and may underlie the poor clinical efficacy of these agents.

Keywords: MDM2; P53 independent; epigenetics; genome topology; liposarcoma; sarcoma; therapeutic resistance.


Conflict of interest statement

B.E.B. declares outside interests in Fulcrum Therapeutics, Arsenal Biosciences, HiFiBio, Cell Signaling Technologies, Design Pharmaceuticals, and Chroma Medicine. G.D.D. reports leadership as co-founder of IDRX; stocks/options/shares in IDRX, Blueprint Medicines, G1 Therapeutics, Caris Life Sciences, Erasca Pharmaceuticals, RELAY Therapeutics, Bessor Pharmaceuticals, CellCarta, IKENA Oncology, and Kojin Therapeutics; paid consulting fees from Bayer, Pfizer, Novartis, Roche/Genentech, GSK, PharmaMar, Daiichi Sankyo, EMD-Serono/Merck KGaA, Mirati, WCG/Arsenal Capital, G1 Therapeutics, Caris Life Sciences, RELAY Therapeutics, CellCarta, IKENA Oncology, Kojin Therapeutics, RAIN Therapeutics, Jazz Pharmaceuticals, Aadi Biosciences, and IDRX; royalties, patents, or licenses from Novartis to Dana-Farber Cancer Institute for “use patent” of imatinib in GIST; and non-financial interests in AACR Science Policy and Government Affairs Committee and Alexandria Real Estate Equities summit conference series.

Figures

None
Graphical abstract
Figure 1
Figure 1
Liposarcoma maturity score anticorrelates with MDM2 levels (A) Schematic of study design with indication of primary tumors and cell line models (left) and genome-wide assays (right). (B) Plot depicts copy number alterations in normal fat (gray), WDLPS (red), and DDLPS (blue) samples from our clinical cohort. Vertical plot at left depicts the average copy number across the genome, while the horizontal view expands the Chr12q locus that contains MDM2. (C) Box plot shows distribution of MDM2 expression in normal fat and WDLPS and DDLPS. One-tailed t test p values: DDLPS vs. WDLPS = 0.09, NF vs. WDLPS = 8.8e−5, NF vs. DDLPS = 5.5e−5. (D) Waterfall plots show maturity scores for samples in the clinical cohort. (E) Hematoxylin and eosin staining for representative well-differentiated (WD) and dedifferentiated (DD) tumors, ranked by maturity score (top) and showing expression of master adipocytic regulators PPARG and CEBPA (bottom). (F) Scatterplots show correlation between MDM2 expression (y axis) and maturity score (x axis) for WDLPS and DDLPS tumors.
Figure 2
Figure 2
Transcriptional programs and regulators in dedifferentiated sarcoma (A) Heatmap depicts expression (blue heat) of differentially expressed genes (rows) across the clinical specimens and cell lines (columns). Genes are grouped into coherent programs (black outlines) ordered by their correlation or anticorrelation with maturity scores. Mitochondrial genome encoded genes are grouped below. Maturity score (gray heat) and MDM2 expression (red heat) are shown above for each sample. (B) TF binding motifs that are over-represented in DDLPS enhancers marked by H3K27ac. (C) Scatterplot depicts expression of TFs (points) in WDLPS (y axis) and DDLPS (x axis) tumors. Points along the diagonal represent factors shared between histologies and include multiple AP1-JUN and ETS family members. (D) Volcano plot depicts fold change and significance (p value ≤ 0.05) of differential expression of TFs (points) between WDLPS and DDLPS. TFs referenced in the text are highlighted.
Figure 3
Figure 3
TF circuits that govern dedifferentiated liposarcoma programs (A) Heatmap depicts TF binding (color heat) and H3K27ac (grayscale) over candidate enhancers and promoters (rows) of the LPS141 liposarcoma line. Peaks are binned into groups based on combinatorial TF binding, including JUN/RUNX peaks (n = 36,151), P53 peaks (n = 857), and MDM2 peaks without P53 (n = 1,544). Bottom boxes show TF binding on a linearized track of the circular mitochondrial genome centered on the regulatory d loop (black box). (B, E, and H) Schematics summarize characteristic binding and looping patterns for JUN (blue), RUNX2 (purple), P53 (green), and MDM2 (orange). (C, F, and I) Bars highlight gene sets enriched among JUN/RUNX2 (blue), P53 (green), and MDM2 (orange) targets, as defined by combination of ChIP-seq and HiChIP. (D, G, and J) Box plots show expression of TF target genes (defined as in B, E, and H) in normal fat, WDLPS, and DDLPS samples. Two-tailed t test p values: (D) NF vs. DDLPS = 0.017, WDLPS vs. DDLPS = 0.0016; (G) NF vs. DDLPS = 0.012, WDLPS vs. DDLPS = 0.002; (J) NF vs. DDLPS = 0.007, WDLPS vs. DDLPS = 0.002. (K) Aggregate plots show a P53 binding signal at P53 (top) or MDM2 (bottom) target sites in LPS853 cells with no treatment (NT) or after 2 h or 24 h of HDM201 treatment. (L) Aggregate plots show MDM2 binding signal at P53 (top) or MDM2 (bottom) target sites in LPS853 cells with no treatment (NT) or after 2 h or 24 h of HDM201 treatment. (M) Bar plot shows the proportion of TF binding sites that coincide with putative enhancers or promoters. (N) Table depicts the degree of overlap between TF binding, per ChIP-seq, and sites engaged in enhancer-enhancer (E-E), enhancer-promoter (E-P), or promoter-promoter (P-P) loops, per HiChIP. Red heat represents the significance of overlap between indicated TF and loop pattern calculated with Fisher’s exact test using genome-wide loop patterns as background.
Figure 4
Figure 4
Supraphysiologic MDM2 associates with promoter hubs (A–C) Genomic tracks for three genomic regions with representative multi-way promoter hubs. Top tracks represent MDM2 binding intensity and called peaks (orange), and H3K27ac intensity (gray) in LPS141 cells. Bottom tracks depict HiChIP promoter-promoter loops in LPS141 and LPS853 cells. Loop height is proportional to the paired-end tag (PET) score. Genes are shown above. (D–F) HiChIP promoter-promoter loops in two dedifferentiated tumors (DD10 and DD20) shown for the same loci. (G) Box plots depict the correlation of the expression of promoter hub genes, compared with random gene sets in DDLPS tumors (n = 60) in the TCGA; two-tailed t test p value = 4.173e−5. (H) Transcription factor binding motifs that are over-represented in MDM2-bound hub promoters (top) or unbound hub promoters (bottom). (I) Venn diagram depicting overlap between YY1- and MDM2-bound promoters. (J) Genomic track for representative promoter hub in the LPS853 cell line. Tracks represent, from top to bottom, MDM2 binding intensity (orange), YY1 binding intensity (yellow), and H3K27ac intensity (gray), and paired-end tag (PET) scores for promoter-promoter loops in H3K27ac HiChIP.
Figure 5
Figure 5
Supraphysiologic MDM2 localizes to nuclear foci (A) IF images (Airyscan confocal, 63×) for representative LPS853 cell show MDM2 (green), P53 (red), and DAPI (blue). (B) IF images (confocal, 63×) for representative LPS853 cell show MDM2 (green), PML (red), and DAPI (blue). (C) Quantification of MDM2 and PML intensity profiles across white dashed line in (B) shows co-localization of MDM2 and PML. (D and F) IF images (confocal, 63×) for LPS853 cells show MDM2 (green), YY1 (red), and DAPI (blue). (E and G) High-magnification images shown for white boxed regions in (D) and (F). Bottom plots show quantifications of MDM2 (green) and YY1 (red) intensities across white dashed lines.
Figure 6
Figure 6
Heterogeneous distribution of MDM2 copy number and expression confound efficacy of targeted therapies (A) Representative 25× confocal IF images show MDM2 (green) and DAPI (blue) in LPS853 cells and a DDLPS tumor. (B) Representative maximum-projection 63× confocal z stacks show FISH for the MDM2 locus (gray), IF for MDM2 protein (green), and DAPI (blue). (C) Scatterplot compares MDM2 FISH and MDM2 IF intensity across 115 single cells. (D and E) Bar plots comparing counts of viable (D) and dead (E) LPS853 cells following 3 days of HDM201 treatment. (F) Histograms of MDM2 FISH intensity in LPS853 cells following 3 days of HDM201 treatment (n = 30,000 cells per condition). Dashed line represents the top 5% of the DMSO control. All drug-treated comparisons with the DMSO control displayed two-tailed t test p values < 2.2e−16. (G) Histograms of MDM2 FISH intensity in LPS853 cells following a time course of 300 nM HDM201 treatment (n = 35,000 cells per condition). Dashed line represents the top 5% of the DMSO control. All drug-treated comparisons with the DMSO control displayed two-tailed t test p values < 2.2e−16. (H) Violin plots show distribution of MDM2 FISH for safe harbor and P53 knockout LPS853 cells following 3 days treatment with DMSO (control), 100 nM Navitoclax or 300 nM HDM201 as single agents or in combination (n = 30,000 cells per condition). Dashed lines represent the top 5% and bottom 5% of the DMSO control. All comparisons marked as significant displayed two-tailed t test p values < 2.2e−16.

Similar articles

Cited by

  • Machine learning identifies activation of RUNX/AP-1 as drivers of mesenchymal and fibrotic regulatory programs in gastric cancer.
    Razavi-Mohseni M, Huang W, Guo YA, Shigaki D, Ho SWT, Tan P, Skanderup AJ, Beer MA. Razavi-Mohseni M, et al. Genome Res. 2024 Jun 25;34(5):680-695. doi: 10.1101/gr.278565.123. Genome Res. 2024. PMID: 38777607 Free PMC article.
  • Towards a consensus atlas of human and mouse adipose tissue at single-cell resolution.
    Loft A, Emont MP, Weinstock A, Divoux A, Ghosh A, Wagner A, Hertzel AV, Maniyadath B, Deplancke B, Liu B, Scheele C, Lumeng C, Ding C, Ma C, Wolfrum C, Strieder-Barboza C, Li C, Truong DD, Bernlohr DA, Stener-Victorin E, Kershaw EE, Yeger-Lotem E, Shamsi F, Hui HX, Camara H, Zhong J, Kalucka J, Ludwig JA, Semon JA, Jalkanen J, Whytock KL, Dumont KD, Sparks LM, Muir LA, Fang L, Massier L, Saraiva LR, Beyer MD, Jeschke MG, Mori MA, Boroni M, Walsh MJ, Patti ME, Lynes MD, Blüher M, Rydén M, Hamda N, Solimini NL, Mejhert N, Gao P, Gupta RK, Murphy R, Pirouzpanah S, Corvera S, Tang S, Das SK, Schmidt SF, Zhang T, Nelson TM, O'Sullivan TE, Efthymiou V, Wang W, Tong Y, Tseng YH, Mandrup S, Rosen ED. Loft A, et al. Nat Metab. 2025 May;7(5):875-894. doi: 10.1038/s42255-025-01296-9. Epub 2025 May 13. Nat Metab. 2025. PMID: 40360756 Review.
  • New strategies in soft tissue sarcoma treatment.
    Spalato-Ceruso M, Ghazzi NE, Italiano A. Spalato-Ceruso M, et al. J Hematol Oncol. 2024 Sep 2;17(1):76. doi: 10.1186/s13045-024-01580-3. J Hematol Oncol. 2024. PMID: 39218932 Free PMC article. Review.
  • Epigenetic dysregulation of metabolic programs mediates liposarcoma cell plasticity.
    Pimenta EM, Garza AE, Camp SY, Park J, Hoffman SE, Valderrábano L, Fu J, Bi K, Karam J, Titchen BM, Khandekar MJ, Shannon E, Kang YJ, Nag A, Thorner AR, Raut CP, Hornick JL, Merriam P, Solimini NL, George S, Demetri GD, Van Allen EM. Pimenta EM, et al. bioRxiv [Preprint]. 2025 Jan 24:2025.01.20.633920. doi: 10.1101/2025.01.20.633920. bioRxiv. 2025. PMID: 39896505 Free PMC article. Preprint.

References

    1. ICGC/TCGA Pan-Cancer Analysis of Whole Genomes Consortium Pan-cancer analysis of whole genomes. Nature. 2020;578:82–93. doi: 10.1038/s41586-020-1969-6. - DOI - PMC - PubMed
    1. Beroukhim R., Mermel C.H., Porter D., Wei G., Raychaudhuri S., Donovan J., Barretina J., Boehm J.S., Dobson J., Urashima M., et al. The landscape of somatic copy-number alteration across human cancers. Nature. 2010;463:899–905. doi: 10.1038/nature08822. - DOI - PMC - PubMed
    1. Haupt Y., Maya R., Kazaz A., Oren M. Mdm2 promotes the rapid degradation of p53. Nature. 1997;387:296–299. doi: 10.1038/387296a0. - DOI - PubMed
    1. Kim H., Nguyen N.-P., Turner K., Wu S., Gujar A.D., Luebeck J., Liu J., Deshpande V., Rajkumar U., Namburi S., et al. Extrachromosomal DNA is associated with oncogene amplification and poor outcome across multiple cancers. Nat. Genet. 2020;52:891–897. doi: 10.1038/s41588-020-0678-2. - DOI - PMC - PubMed
    1. Pedeutour F., Forus A., Coindre J.M., Berner J.M., Nicolo G., Michiels J.F., Terrier P., Ranchere-Vince D., Collin F., Myklebost O., Turc-Carel C. Structure of the supernumerary ring and giant rod chromosomes in adipose tissue tumors. Genes Chromosomes Cancer. 1999;24:30–41. - PubMed