. 2023 May 17;3(7):100327.
doi: 10.1016/j.xgen.2023.100327. eCollection 2023 Jul 12.

Blood cell traits' GWAS loci colocalization with variation in PU.1 genomic occupancy prioritizes causal noncoding regulatory variants

Affiliations

Blood cell traits' GWAS loci colocalization with variation in PU.1 genomic occupancy prioritizes causal noncoding regulatory variants

Raehoon Jeong et al. Cell Genom. .

Abstract

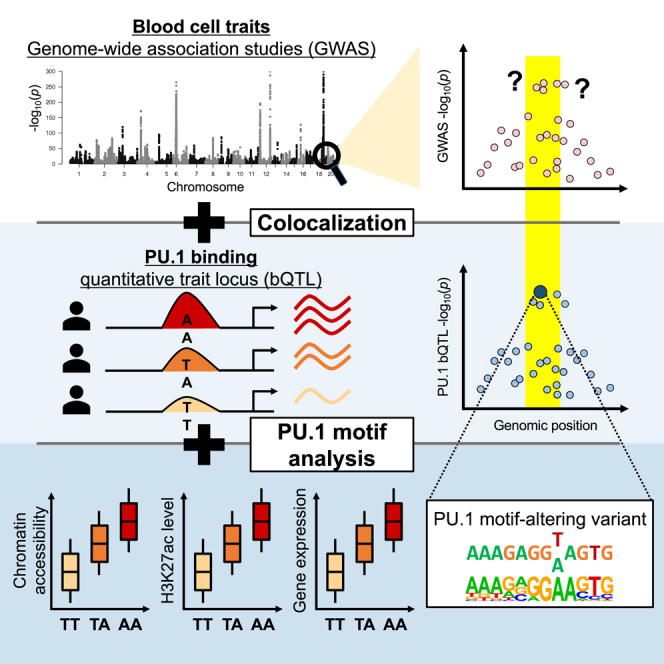
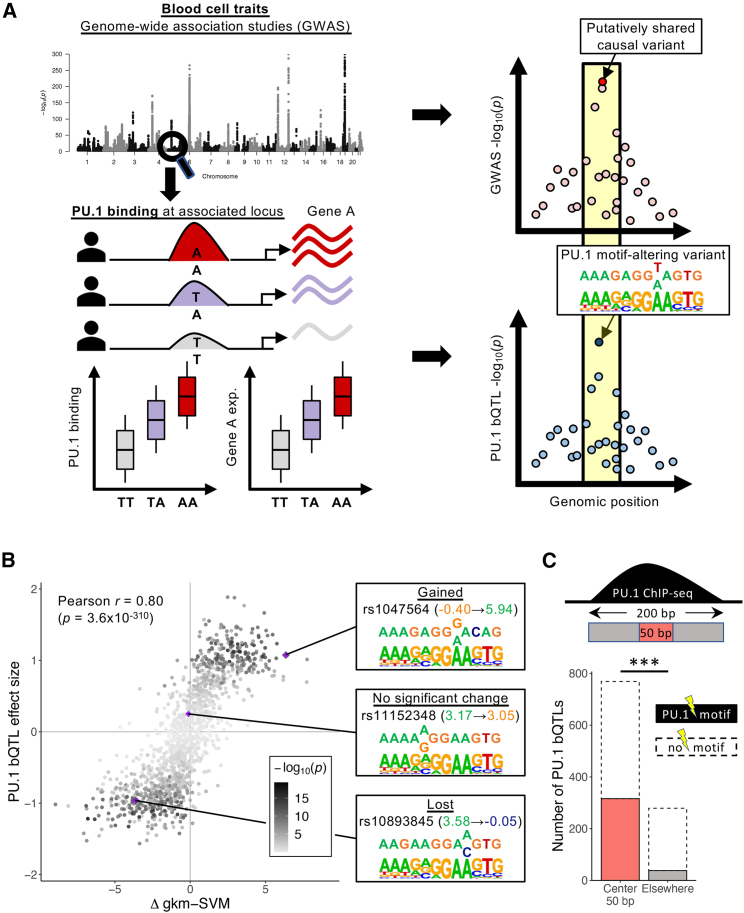
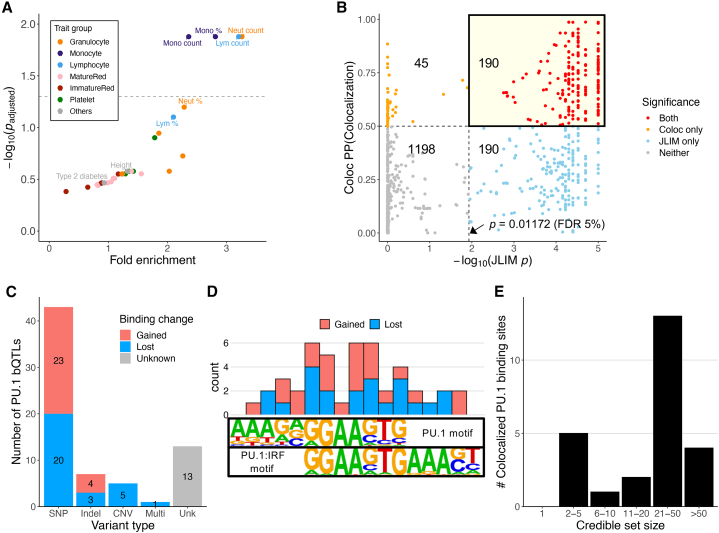
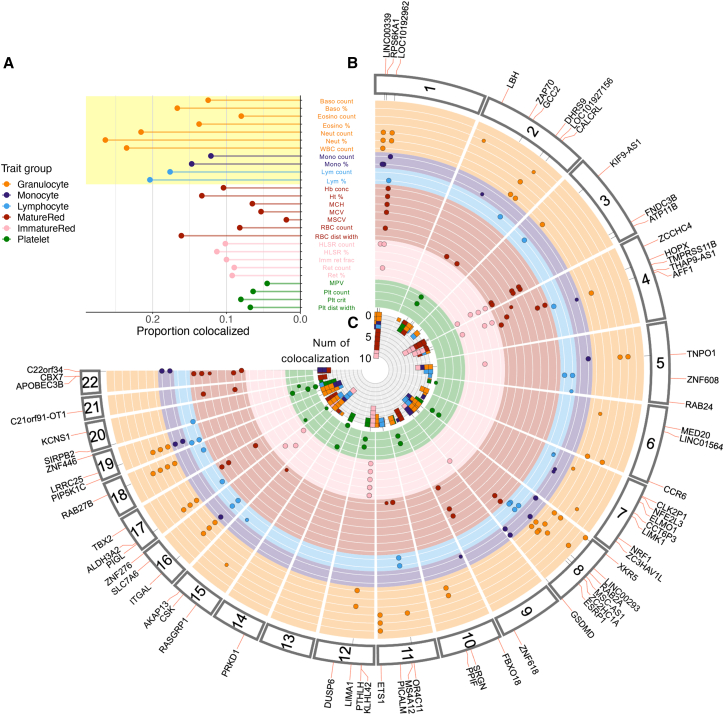
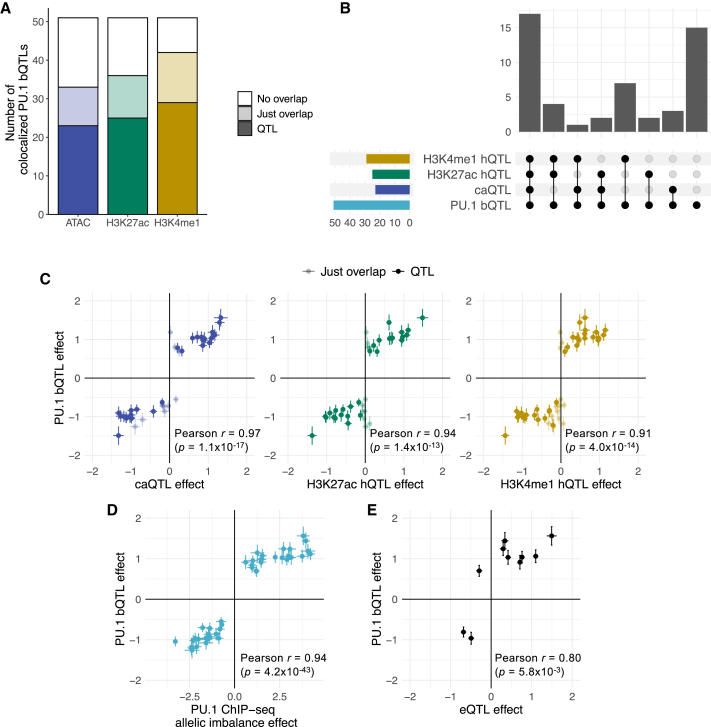
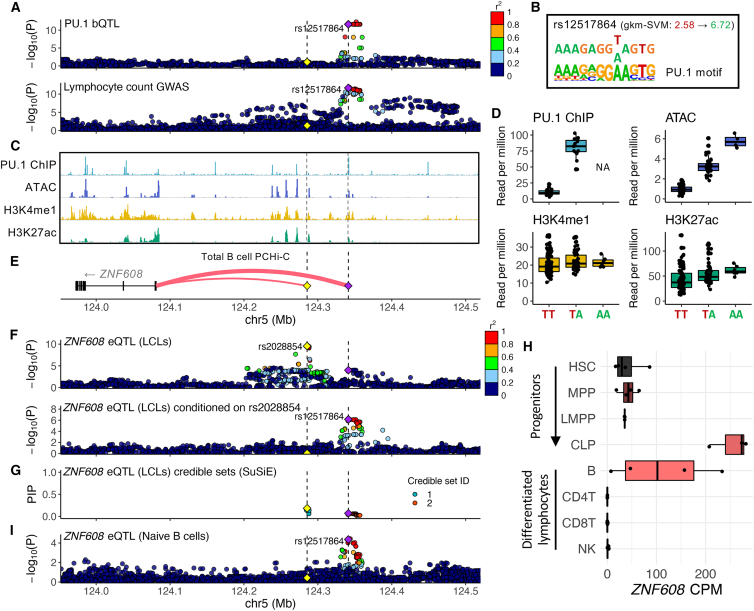
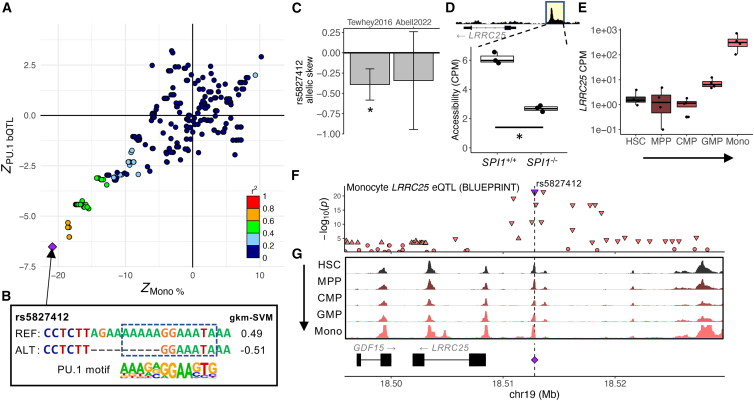
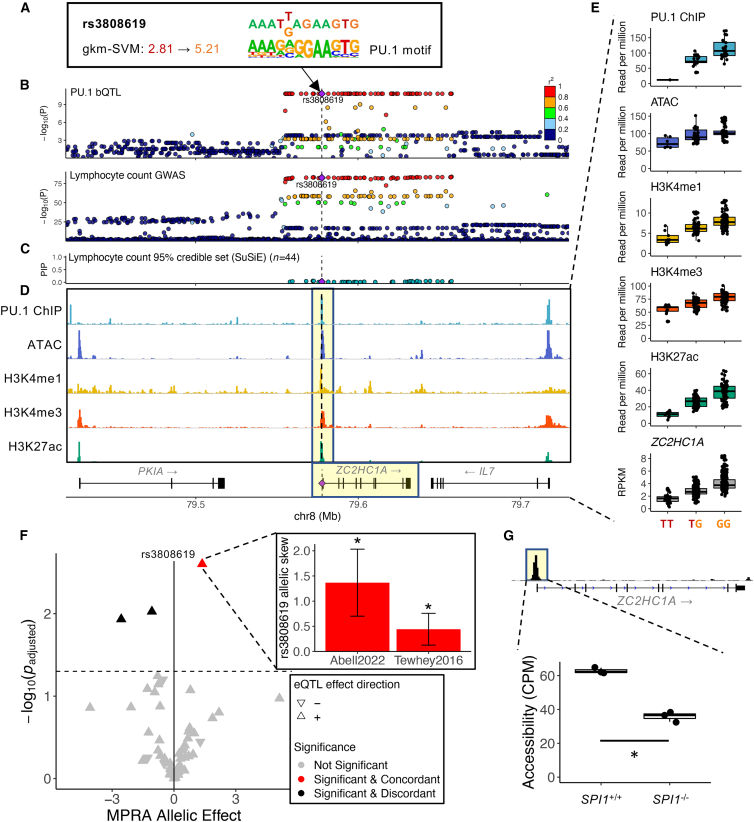
Genome-wide association studies (GWASs) have uncovered numerous trait-associated loci across the human genome, most of which are located in noncoding regions, making interpretation difficult. Moreover, causal variants are hard to statistically fine-map at many loci because of widespread linkage disequilibrium. To address this challenge, we present a strategy utilizing transcription factor (TF) binding quantitative trait loci (bQTLs) for colocalization analysis to identify trait associations likely mediated by TF occupancy variation and to pinpoint likely causal variants using motif scores. We applied this approach to PU.1 bQTLs in lymphoblastoid cell lines and blood cell trait GWAS data. Colocalization analysis revealed 69 blood cell trait GWAS loci putatively driven by PU.1 occupancy variation. We nominate PU.1 motif-altering variants as the likely shared causal variants at 51 loci. Such integration of TF bQTL data with other GWAS data may reveal transcriptional regulatory mechanisms and causal noncoding variants underlying additional complex traits.

Keywords: ChIP-seq; PU.1; TF bQTL; blood cell traits; colocalization; fine-mapping; genome-wide association study; noncoding variants; transcription factor binding quantitative trait locus; transcription factors; variant-to-function.


Conflict of interest statement

The authors declare no competing interests.

Figures

None
Graphical abstract
Figure 1
Figure 1
Relevance of PU.1 bQTLs in LCLs to blood cell trait associations (A) Left: blood cell trait-associated loci may have overlapping PU.1 bQTLs and, potentially, expression QTL (eQTL) associations. Right: significant colocalization suggests that the causal variants are shared. If there is a PU.1 motif-altering variant at a colocalized PU.1 bQTL, then the variant is likely to be the shared causal variant. exp, expression. (B) Comparison of changes in motif score (Δ gkm-SVM) and estimated bQTL effect sizes at PU.1 motif-altering variants within the 200-bp PU.1 ChIP-seq peaks. The color represents the –log10(p) of PU.1 bQTL association (linear regression). The insets show examples of variants’ effects on PU.1 gkm-SVM score and their nucleotide change within a PU.1 motif. At the variant position, the top and bottom bases are reference and variant alleles, respectively. (C) Number of significant PU.1 bQTLs with PU.1 motif-altering variants at each region within the 200-bp PU.1 ChIP-seq peaks. ∗∗∗: p < 2.2 × 10−16 (Fisher’s exact test). See also Figures S1 and S2 and Tables S1 and S2.
Figure 2
Figure 2
Colocalization of blood cell trait GWAS and PU.1 bQTLs (A) Enrichment of PU.1 bQTLs for associations with specific blood cell traits and control traits (i.e., height and type 2 diabetes). Traits with empirical adjusted p < 0.05 (above the dashed line) and control traits are labeled. Lym, lymphocyte; Neut, neutrophil; Mono, monocyte. Abbreviations of blood cell traits are further described in Table S3. (B) Colocalization results from JLIM and Coloc. Each point is a PU.1 bQTL-trait pair. The number shown in each quadrant is the number of points within the significance category. Dashed lines indicate the respective significance thresholds (JLIM, p < 0.01172 [FDR 5%]; Coloc, PP[colocalized] > 0.5). (C) The types of putative causal variants at colocalized PU.1 bQTLs that alter PU.1 motifs or the copy number of the PU.1 occupancy site. SNPs, indels, and multivariants alter PU.1 motifs. CNV, copy number variation altering the copy number of PU.1 binding sites; Multi, multiple variants in perfect LD (r2 = 1) within a PU.1 motif sequence; Unk (unknown), No variant-altering PU.1 motif sequence or its copy number. (D) Number of PU.1 motif-altering SNPs at each nucleotide position at colocalized PU.1 binding sites. Motif logos are from the Homer database. (E) Blood cell trait GWAS credible set size at loci with colocalized PU.1 bQTLs and a PU.1 motif-altering variant. Only 25 loci with fine-mapping result in Vuckovic et al. are represented. See also Figures S3 and S4; Tables S3, S4, S5, S6, S7, S8, and S9; and Note S1.
Figure 3
Figure 3
Distribution of colocalized loci across the genome (A) Proportion of tested loci with significant colocalization. The colors represent the trait groups. The blood cell traits highlighted in yellow correspond to white blood cell traits. Baso, basophil; Eosino, eosinophil; WBC, white blood cell; Hb conc, hemoglobin concentration; Ht, hematocrit; MCH, mean corpuscular hemoglobin; MCV, mean corpuscular volume; MSCV, mean sphered corpuscular volume; RBC, red blood cell; dist, distribution; HLSR, high-light-scatter reticulocyte; Imm ret frac, immature reticulocyte fraction; Ret, reticulocyte; MPV, mean platelet volume; Plt, platelet. Abbreviations of blood cell traits are further described in Table S3. (B) Fuji plot depicting the genomic distribution of blood cell trait-associated loci that show high-confidence colocalization with PU.1 bQTLs. Tracks are colored by trait group as in (A). (C) Number of traits with which each PU.1 bQTL colocalizes. The panel is at the center. Bars representing each trait are stacked at each locus.
Figure 4
Figure 4
Regulatory effects of the colocalized PU.1 motif-altering variants (A) Number of colocalized PU.1 motif-altering variants that overlap ATAC-seq or histone mark (H3K27ac or H3K4me1) ChIP-seq peaks and that are in LD (r2 > 0.8) with those regulatory QTLs. (B) Upset plot showing the number of colocalized PU.1 motif-altering variants that are in LD (r2 > 0.8) with different sets of regulatory QTLs. caQTL, chromatin accessibility QTL; hQTL, histone QTL. (C) Comparison of PU.1 bQTL effects (i.e., regression effect size) with other regulatory QTL effects. Each point corresponds to a PU.1 motif-altering variant. The colors match those in (A). The error bars represent standard errors. Pearson correlation coefficient is calculated only for those points showing significant regulatory QTLs. (D) Comparison of PU.1 bQTL effects and PU.1 ChIP-seq allelic imbalance effect (i.e., log2[allelic fold change] estimated from weighted linear regression). The effect is with respect to the alternate alleles. The error bars represent standard errors. (E) Comparison of PU.1 bQTL effects with eQTL effects. Each point corresponds to a PU.1 motif-altering variant. For rs3808619, which had multiple eQTL signals, only the value for the closest gene, ZC2HC1A, is shown. The error bars represent standard errors. See also Tables S10, S11, S12, S13, and S14.
Figure 5
Figure 5
PU.1 motif alteration pinpoints a lymphocyte-count-associated variant that is a secondary ZNF608 eQTL variant (A) PU.1 bQTL and lymphocyte count association signals. The PU.1 motif-altering variant rs12517864 is shown as a purple diamond, and the ZNF608 eQTL lead variant rs2028854 is shown as a yellow diamond. Vertical dashed lines mark the position of these two variants. Points are colored by LD r2 with respect to rs12517864. (B) The effect of rs2028854 on the sequence with respect to the PU.1 binding motif. (C) ZNF608 locus genome tracks of PU.1 ChIP-seq, ATAC-seq, and H3K4me1 and H3K27ac ChIP-seq assayed in GM12878. (D) Boxplots of the effect of rs12517864 dosage on various molecular phenotypes shown in (C), using the same colors. For PU.1 ChIP-seq data, there were no individuals with a homozygous alternate allele (AA). All data points are superimposed over the boxplots. (E) Gene track showing ZNF608 and the two variants. The weights of the red curves indicate the capture Hi-C analysis of genomic organization (CHiCAGO) scores calculated by Javierre et al., representing physical interaction. (F) Top: primary ZNF608 eQTL signals in LCLs. LD r2 is calculated with respect to rs2028854, the lead variant. Bottom: ZNF608 eQTL signals in LCLs conditioned on the rs2028854 dosage. Points are colored as in (A). (G) Fine-mapping result of ZNF608 eQTL signals in LCLs, using SuSiE. Points are colored by the credible set to which they belong. PIP, posterior inclusion probability. (H) Boxplots of ZNF608 expression levels (count per million [CPM]) through lymphocyte differentiation and across various lymphocyte types. All data points are superimposed over the boxplot. HSC, hematopoietic stem cell; MPP, multipotent progenitor; LMPP, lymphoid-primed multipotent progenitor; CLP, common lymphoid progenitor; B, B cell; CD4T, CD4+ T cell; CD8T, CD8+ T cell; NK, natural killer. (I) ZNF608 eQTL association signals in naive B cells (Database of Immune Cell Expression, Expression Quantitative Trait Loci and Epigenomics [DICE]55). Points are colored as in (A). See also Figure S5.
Figure 6
Figure 6
PU.1 motif-altering deletion rs5827412 at the LRRC25 locus associated with lower monocyte counts (A) Association Z scores of variants in the locus with PU.1 binding and monocyte percentage. The sign of the Z score is the effect direction of the AA of each variant. The points are colored by LD r2 with respect to rs5827412 (purple diamond). (B) The effect of rs5827412 on the PU.1 motif. Dashes indicate gaps in the alignment, reflecting the short deletion. (C) Negative allelic skew (i.e., reduced reporter activity) by rs5827412 in log2 fold change. Error bars indicate 95% confidence intervals. ∗: adjusted p < 0.05. (D) A boxplot showing PU.1-dependent reduction in chromatin accessibility levels (CPM) at the regulatory element surrounding rs5827412 in control pro-B cell lines (SPI1+/+) and counterparts with SPI1 knocked out (SPI1−/−). Regions highlighted in yellow marks the accessible region corresponding to the boxplot. All data points are superimposed over the boxplot. n = 3 for each condition. ∗: DESeq2-adjusted p < 0.05. (E) A boxplot showing LRRC25 expression levels (CPM) through monocyte differentiation. All data points are superimposed over the boxplot. CMP, common myeloid progenitor; GMP, granulocyte-macrophage progenitor. (F) Mono LRRC25 eQTL association. Downward and upward triangles indicate the direction of effect (down- and upregulation, respectively) for variants with p < 1 × 10−3. A purple triangle and dashed line mark rs5827412. (G) LRRC25 locus ATAC-seq tracks as fold enrichment over average (range, 0–40) for various blood cell types through monocyte differentiation. A purple diamond and dashed line mark rs5827412. See also Figure S6 and Note S2.
Figure 7
Figure 7
ZC2HC1A locus: PU.1 motif alteration highlights a regulatory variant among those in high LD (A) The effect of rs3808619 on the PU.1 composite motif. (B) PU.1 bQTL and lymphocyte count association signal at the ZC2HC1A locus. PU.1 motif-altering variant rs3808619 is marked with a purple diamond and a dashed line. (C) PIP of variants in the 95% credible set of lymphocyte count association at the ZC2HC1A locus. rs3808619 is marked as in (B). (D) ZC2HC1A locus genome tracks of PU.1 ChIP-seq, ATAC-seq, and H3K4me1, histone H3 lysine 4 trimethylation (H3K4me3), and H3K27ac ChIP-seq assayed in GM12878. rs3808619 is marked as in (B). The highlighted regions correspond to molecular phenotypes with QTL associations in (E). (E) The effect of rs3808619 dosage on various molecular phenotypes shown in (D). All data points are superimposed over the boxplot. (F) Regulatory effects of rs3808619 and 58 tagging variants in a reporter assay. MPRA allelic effect corresponds to log2 fold change of regulatory activity of the oligo sequence with the AA over that with the reference allele. The inset shows the allelic skew estimates with error bars depicting the 95% confidence intervals from Abell et al. and Tewhey et al. ∗: adjusted p < 0.05. (G) PU.1-dependent reduction in chromatin accessibility levels (CPM) at the regulatory element surrounding rs3808619 in control pro-B cell lines (SPI1+/+) and counterparts with SPI1 knocked out (SPI1−/−). n = 3 for each condition. ∗: DESeq2 adjusted p < 0.05. The panel is formatted as in Figure 6D. See also Figure S7 and Note S3.

Update of

References

    1. Claussnitzer M., Cho J.H., Collins R., Cox N.J., Dermitzakis E.T., Hurles M.E., Kathiresan S., Kenny E.E., Lindgren C.M., MacArthur D.G., et al. A brief history of human disease genetics. Nature. 2020;577:179–189. doi: 10.1038/s41586-019-1879-7. - DOI - PMC - PubMed
    1. Claussnitzer M., Dankel S.N., Kim K.-H., Quon G., Meuleman W., Haugen C., Glunk V., Sousa I.S., Beaudry J.L., Puviindran V., et al. FTO obesity variant circuitry and adipocyte browning in humans. N. Engl. J. Med. 2015;373:895–907. doi: 10.3389/fgene.2015.00318. - DOI - PMC - PubMed
    1. Nasser J., Bergman D.T., Fulco C.P., Guckelberger P., Doughty B.R., Patwardhan T.A., Jones T.R., Nguyen T.H., Ulirsch J.C., Lekschas F., et al. Genome-wide enhancer maps link risk variants to disease genes. Nature. 2021;593:238–243. doi: 10.1038/s41586-021-03446-x. - DOI - PMC - PubMed
    1. International Common Disease Alliance International common disease alliance white paper v1.0. 2020. https://www.icda.bio
    1. Visscher P.M., Wray N.R., Zhang Q., Sklar P., McCarthy M.I., Brown M.A., Yang J. 10 Years of GWAS discovery: biology, function, and translation. Am. J. Hum. Genet. 2017;101:5–22. doi: 10.1016/j.ajhg.2017.06.005. - DOI - PMC - PubMed

LinkOut - more resources