. 2023 Jun 20;3(7):100346.
doi: 10.1016/j.xgen.2023.100346. eCollection 2023 Jul 12.

Discovering cellular programs of intrinsic and extrinsic drivers of metabolic traits using LipocyteProfiler

Affiliations

Discovering cellular programs of intrinsic and extrinsic drivers of metabolic traits using LipocyteProfiler

Samantha Laber et al. Cell Genom. .

Abstract

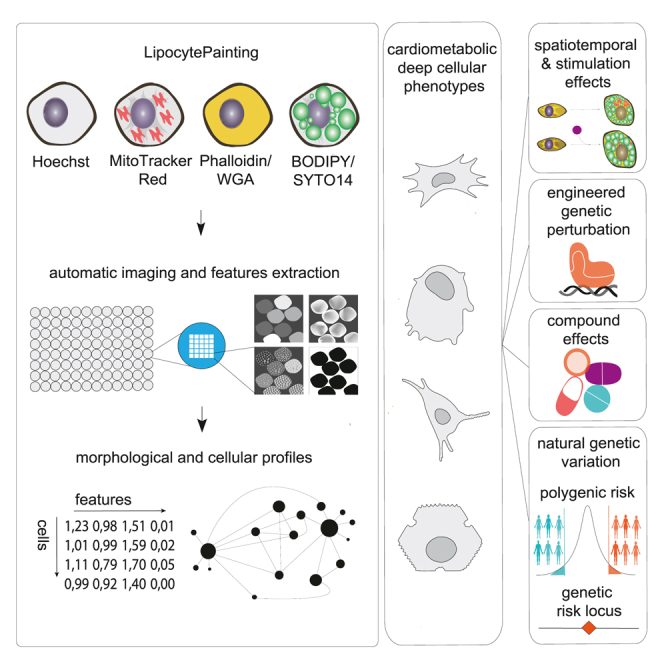
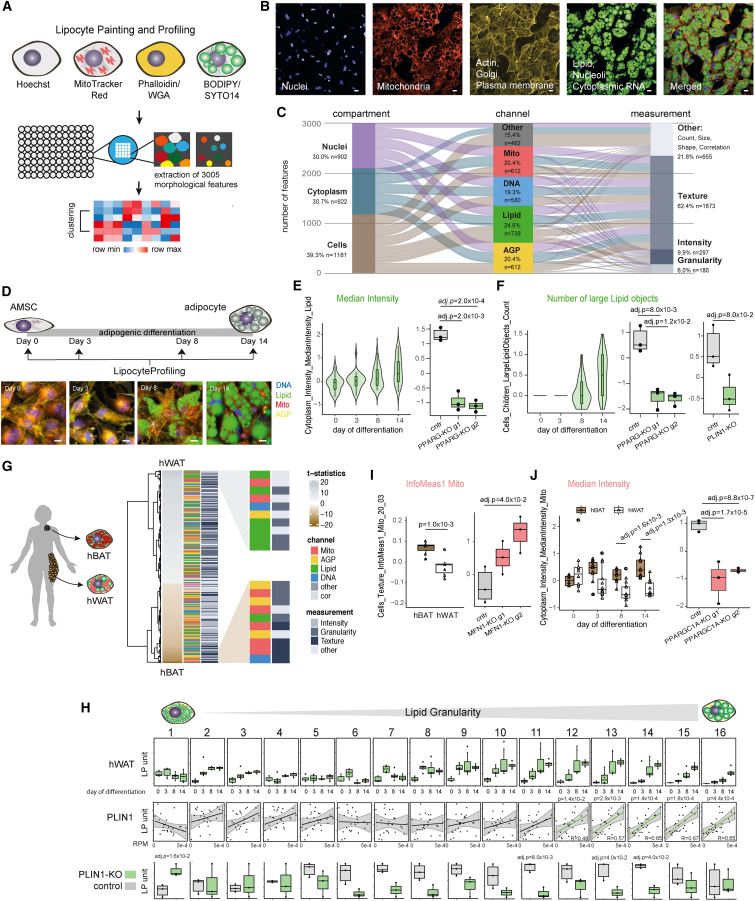
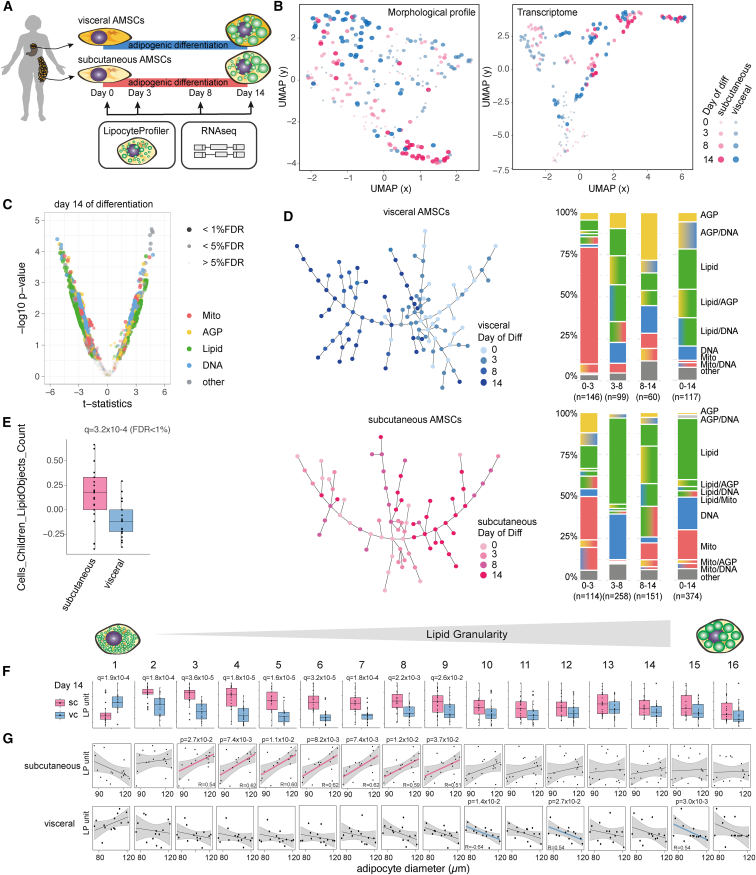
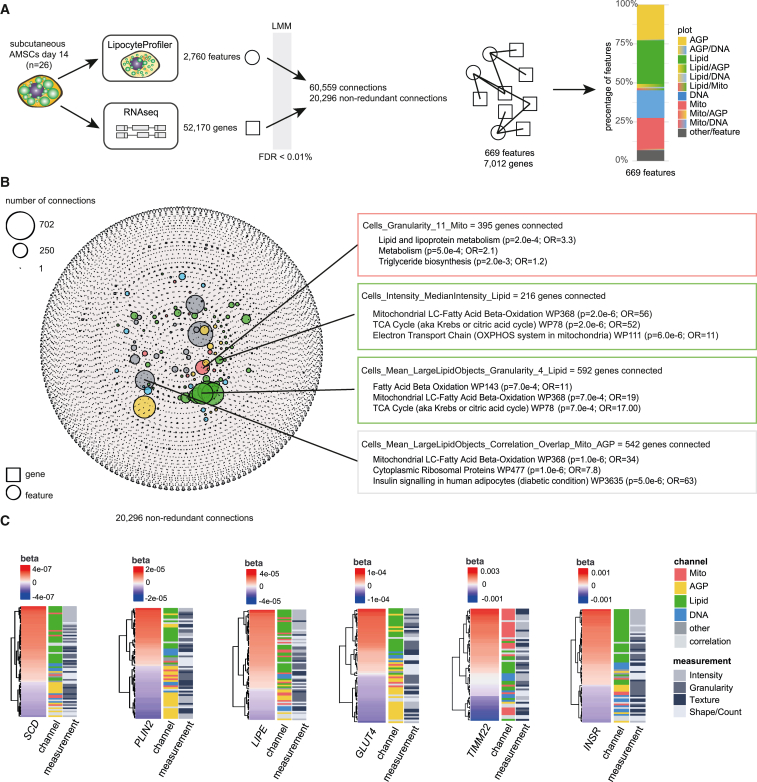
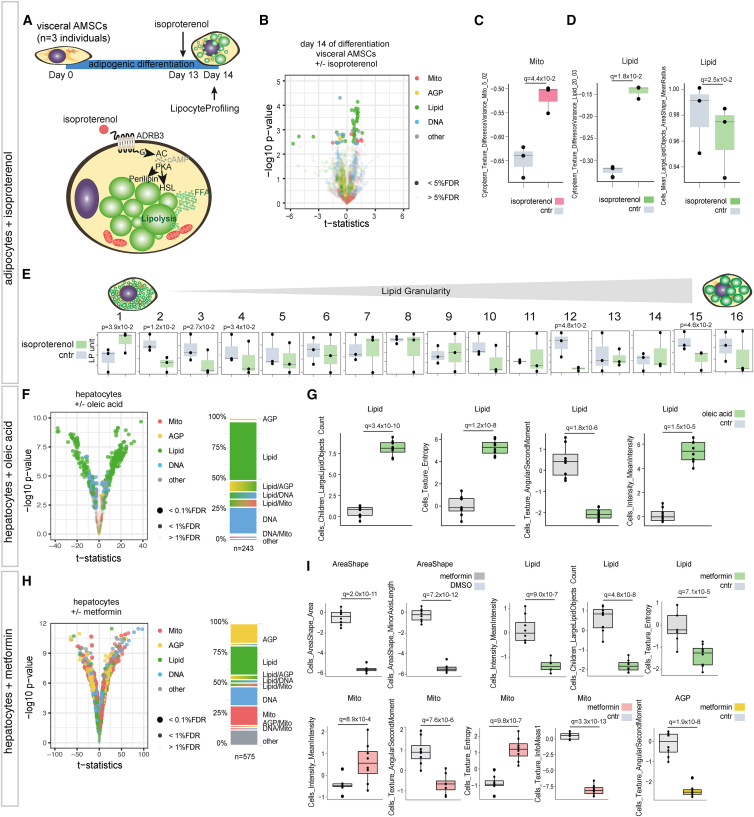
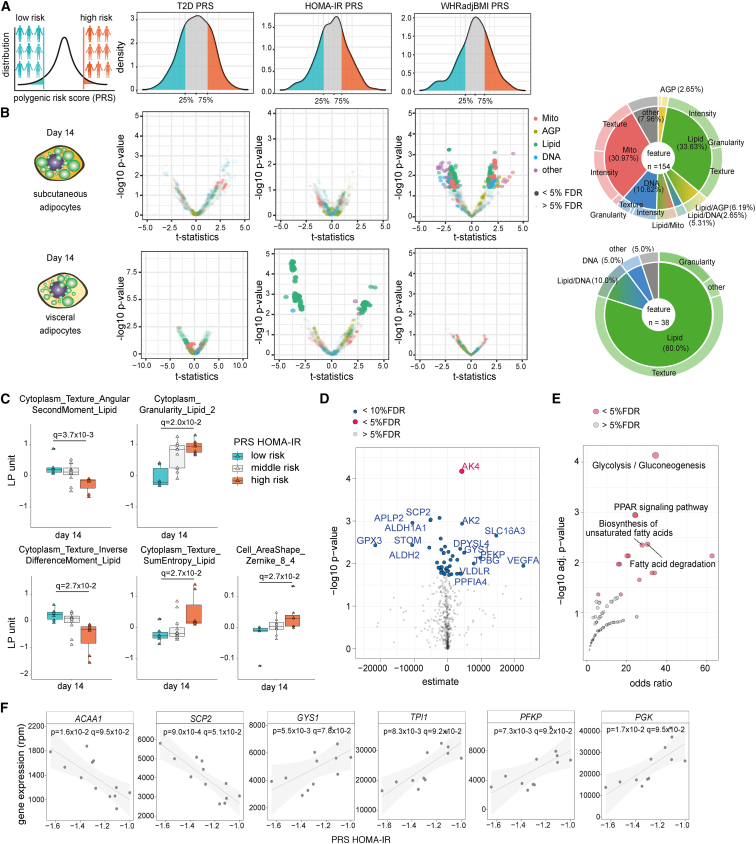
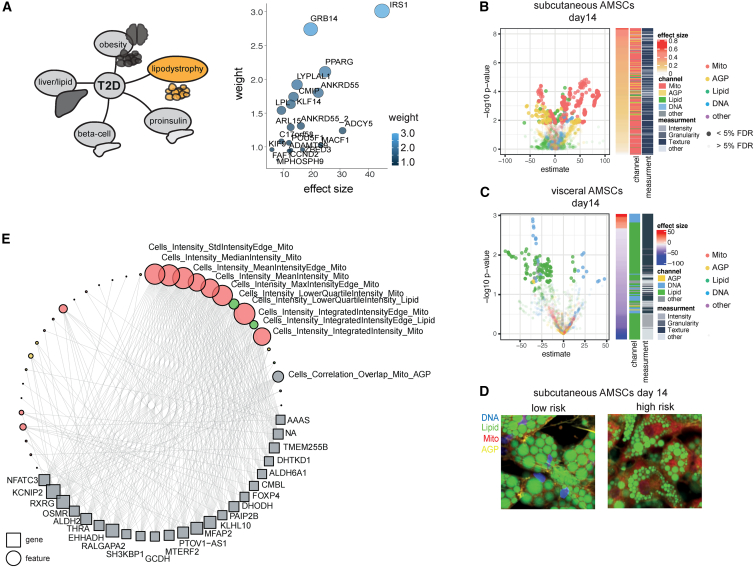
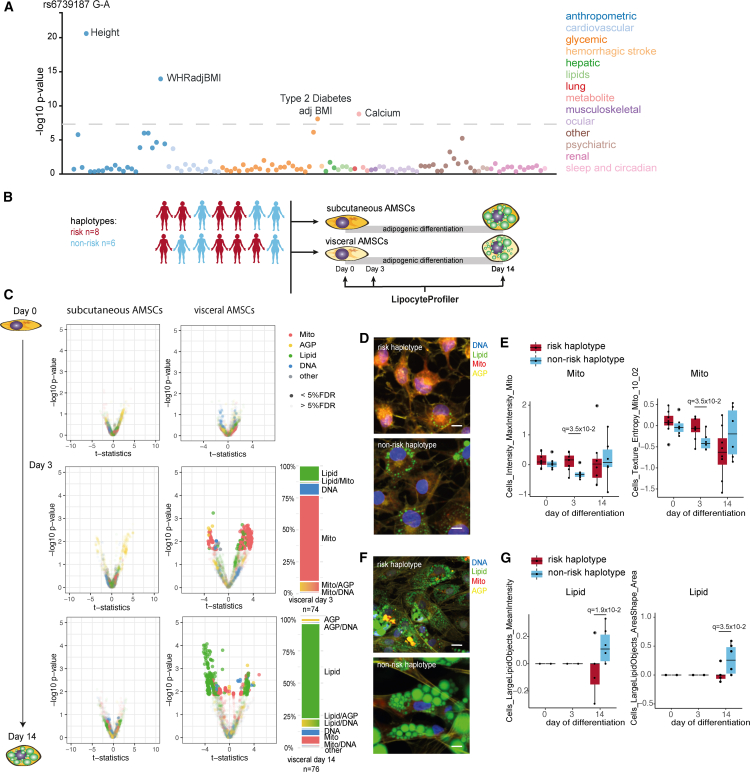
A primary obstacle in translating genetic associations with disease into therapeutic strategies is elucidating the cellular programs affected by genetic risk variants and effector genes. Here, we introduce LipocyteProfiler, a cardiometabolic-disease-oriented high-content image-based profiling tool that enables evaluation of thousands of morphological and cellular profiles that can be systematically linked to genes and genetic variants relevant to cardiometabolic disease. We show that LipocyteProfiler allows surveillance of diverse cellular programs by generating rich context- and process-specific cellular profiles across hepatocyte and adipocyte cell-state transitions. We use LipocyteProfiler to identify known and novel cellular mechanisms altered by polygenic risk of metabolic disease, including insulin resistance, fat distribution, and the polygenic contribution to lipodystrophy. LipocyteProfiler paves the way for large-scale forward and reverse deep phenotypic profiling in lipocytes and provides a framework for the unbiased identification of causal relationships between genetic variants and cellular programs relevant to human disease.

Keywords: cardio-metabolic disease-oriented image-based profiling; high-dimensional mapping of cellular phenotypes; variant-to-function studies.


Conflict of interest statement

J.C.F. has received consulting honoraria from Goldfinch Bio and Astra Zeneca and speaking honoraria from Novo Nordisk, Astra Zeneca, and Merck for research presentations over which he had full control of content. M.C. holds equity in Waypoint Bio, serves as a consultant for Pfizer, and is a member of the Nestle Scientific Advisory Board. The authors have filed a provisional patent application (63/218,656).

Figures

None
Graphical abstract
Figure 1
Figure 1
LipocyteProfiler creates rich morphological and cellular profiles in adipocytes that are informative for known cellular functions (A) Schematic of LipocyteProfiler, which is a high-content imaging assay that multiplexes six fluorescent stains imaged in four channels in conjunction with an automated image-analysis pipeline to generate rich morphological and cellular profiles in lipid-storing cell types (lipocytes), such as adipocytes during differentiation. (B) Representative microscopy image of fully differentiated adipocytes for four individual channels and a merged representation across channels. Scale bars, 10 μm. (C) LipocyteProfiler extracts 3,005 morphological and cellular features that map to three cellular compartments and across four channels using four measurement classes. (D) Schematic of LipocyteProfiling in differentiating hWAT at four time points of adipocyte differentiation (days 0, 3, 8, 14). Representative images of AMSCs stained using LipocytePainting at four time points of differentiation (days 0, 3, 8, 14). Scale bars, 10 μm. (E) Cytoplasm MedianIntensity Lipid, a measurement of lipid content within a cell, significantly increases with adipogenic differentiation and decreases following CRISPR-Cas9-mediated knockdown of PPARG in differentiated white adipocytes. Data are shown for two guides used (g1 and g2), and y axis shows LP units (normalized LipocyteProfiling [LP] values across three batches, see STAR Methods). (F) Number of large Lipid objects informative for large lipid droplets are absent in the progenitor state (day 0) and in early differentiation (day 3) and progressively increase in later stages of differentiation (days 8 and 14). Number of large Lipid objects is reduced following CRISPR-Cas9-mediated knockout (KO) of PPARG (data are shown for two guides used [g1 and g2]) and PLIN1, at day 14 of differentiation. y axis shows LP units (normalized LP values across three batches, see STAR Methods). (G) Morphological profiles of white (hWAT) and brown (hBAT) adipocytes at day 14 of differentiation differ significantly across all feature classes (FDR < 0.1%). Features are clustered based on effect size. Features with the highest effect size in hWAT and hBAT adipocytes are lipid- and mitochondria-related, respectively. Graph shows zoom-in for top ten features with largest effect sizes in hWAT (top panel) and hBAT (bottom panel). (H) Lipid Granularity measures, as spectra of 16 lipid-droplet size measures, show size-specific changes in hWAT and hBAT during differentiation. See also Figure S1H. Granularity features informative for larger lipid droplets (Lipid Granularity 10–16) correlate positively with PLIN1 gene expression and are reduced in PLIN1-KO adipocytes. See also Figures S1I and S1J (PLIN2, FASN-KO). y axis shows autoscaled LP units (normalized LP values across three batches, seeSTAR Methods). (I) Brown adipocytes (hBAT) show higher Mito_Texture_InfoMeas1, a measure of spatial relationship between specific intensity values, compared with white adipocytes (hWAT). CRISPR-Cas9-mediated knockout of MFN1, a mitochondrial fusion gene, changes Mito_Texture_InfoMeas1 (data shown for two guides used [g1 and g2]). y axis shows LP units (normalized LP values across three batches [hBAT/hWAT] or normalized across CRISPR-KO data, see STAR Methods). (J) Mito_MedianIntensity is higher in brown (hBAT) compared with white (hWAT) adipocytes throughout differentiation and decreased after CRISPR-Cas9-mediated knockout of PPARGC1A in hWAT. y axis shows LP units (normalized LP values across three batches, see STAR Methods).
Figure 2
Figure 2
LipocyteProfiler identifies distinct depot-specific morphological and cellular signatures associated with differentiation trajectories in both visceral and subcutaneous AMSCs (A) Human AMSCs isolated from subcutaneous and visceral adipose depots were differentiated for 14 days, and LipocyteProfiler and RNA-seq profiling were performed throughout adipocyte differentiation (days 0, 3, 8, and 14). (B) LipocyteProfiler and transcriptome profiles show time-course-specific signatures revealing a differentiation trajectory, but only LipocyteProfiler additionally resolves adipose-depot-specific signatures. (C) Subcutaneous and visceral AMSCs at terminal differentiation (day 14) have distinct morphological and cellular profiles with differences that are spread across all channels. See also Figure S2C (volcano plot reporting the −log10 p value and the effect comparing subcutaneous and visceral adipocytes, t test). (D) Sample progression discovery analysis (SPD). Proportions of subgroups of features characterizing differentiation differ between subcutaneous and visceral adipocytes and dynamically change over the course of differentiation. In both depots, Mito features drive differentiation predominantly in the early phase of differentiation (days 0–3) whereas Lipid features predominate in the terminal phases (days 8–14). See also Figure S2D for SPD of hWAT and SGBS. (E) The number of lipid droplets is higher in subcutaneous AMSCs than in visceral AMSCs at terminal differentiation. y axis shows LP units (normalized LP values across eight batches, see STAR Methods). (F) Mature subcutaneous AMSCs have larger intracellular lipid droplets compared with visceral AMSCs at day 14 of differentiation (Lipid Granularity). y axis shows autoscaled LP units (normalized LP values across eight batches, see STAR Methods). (G) Lipid Granularity from subcutaneous AMSCs at day 14 of differentiation correlates positively with floating mature adipocyte diameter but shows an inverse relationship for visceral adipose tissue, suggesting distinct cellular mechanisms that lead to adipose tissue hypertrophy in these two depots. y axis shows autoscaled LP units (normalized LP values across eight batches; x axis, histology adipocytes diameter [μm], see STAR Methods).
Figure 3
Figure 3
Correlations between morphological and transcriptional profiles (A) Linear mixed model (LMM) was applied to correlate 2,760 morphological features derived from LipocyteProfiler with 52,170 transcripts derived from RNA-seq in matched samples of subcutaneous AMSCs at terminal differentiation (day 14). With FDR < 0.01%, we discover 20,296 non-redundant connections that map to 669 morphological features and 7,012 genes. (B) Network of transcript-LipocyteProfiler feature correlations (significant connections FDR < 0.01%). Genes correlated with individual LipocyteProfiler features are enriched for relevant pathways (FDR < 5%). Node size is determined by number of connections. See also Figure S3A for a network with a significance level threshold of FDR < 0.1%. (C) LipocyteProfiler signatures of adipocyte marker genes SCD, PLIN2, LIPE, GLUT4, TIMM22, and INSR recapitulate their known cellular function. Features are clustered based on beta of linear regression.
Figure 4
Figure 4
LipocyteProfiler identifies molecular mechanisms of drug stimulations in adipocytes and hepatocytes (A) LipocyteProfiler was performed in visceral AMSCs (n = 3) treated with the β-adrenergic receptor agonist isoproterenol for 24 h. (B) Isoproterenol treatment results in changes of lipid-related and mitochondrial traits in visceral AMSCs at day 14 of differentiation. See also Figure S3B (volcano plot reporting the −log10 p value and the effect comparing isoproterenol-treated cells and DMSO-treated cells, t test). (C and D) Isoproterenol treatment of visceral AMSCs increase Mito and Lipid TextureDifferenceVariance while decreasing the respective LargeLipidObject mean radius features. y axis shows LP units (normalized LP values across eight batches, see STAR Methods). (E) Isoproterenol treatment reduces lipid-droplet sizes measured via lipid granularity. y axis shows autoscaled LP units (normalized LP values across eight batches, see STAR Methods). (F) Oleic acid treatment in PHH results in changes of lipid-related features. (G) Oleic acid treatment in PHH affects lipid-related morphological features suggestive of increased lipid-droplet size and number. y axis shows LP units (normalized LP values across PHH data, see STAR Methods). (H) Metformin treatment in PHH results in global changes affecting features across all channels. (I) Metformin effect in hepatocytes is suggestive of increased mitochondrial activity, while lipid-droplet size and number are reduced. Metformin-treated hepatocytes are also smaller and show reduced cytoskeletal randomness. y axis shows LP units (normalized LP values across PHH data, see STAR Methods).
Figure 5
Figure 5
Polygenic risk effects for insulin resistance affect lipid degradation in differentiated visceral adipocytes (A) Donors from the bottom and top 25 percentiles of genome-wide PRS for three T2D-related traits (HOMA-IR, T2D, WHRadjBMI) were selected to compare LipocyteProfiles across the time course of visceral and subcutaneous adipocyte differentiation. (B) LipocyteProfiler applied to visceral and subcutaneous differentiating adipocytes reveals trait-specific polygenic effects on image-based cellular signatures for HOMA-IR in differentiated visceral AMSCs (day 14; largely Lipid features) and WHRadjBMI in subcutaneous adipocytes (day 14, largely Mito and Lipid features), but no effect for T2D. See also Figures S5A and S5D (days 0, 3, and 8). (C) HOMA-IR polygenic risk in visceral AMSCs manifested in altered lipid texture, lipid granularity, and cell shape features, resembling an inhibition of lipolysis. y axis shows LP units (normalized LP values across eight batches, see STAR Methods). See also Figure 4B (isoproterenol stimulation). (D) Linear regression of gene expression levels of 512 genes known to be involved in adipocyte function with HOMA-IR PRS. (E) Pathway enrichment analysis of genes that correlate with HOMA-IR PRSs (FDR < 10%) in visceral adipocytes highlight biological processes related to glucose metabolism, fatty acid transport, degradation, and lipolysis (KEGG pathways 2019). (F) Representative genes that associate with HOMA-IR PRS in visceral adipocytes.
Figure 6
Figure 6
Polygenic risk for lipodystrophy-like phenotype manifests in cellular programs that indicate increased mitochondrial activity, reduced actin cytoskeleton remodeling, and reduced lipid accumulation capacity in subcutaneous adipocytes (A) Schematic of T2D process-specific PRS (left panel). Lipodystrophy-specific PRS consists of 20 T2D-associated loci contributing to polygenic risk for a lipodystrophy-like phenotype. y axis: weights of individual loci; x axis: effect size of individual loci contributing to polygenic risk for a lipodystrophy-like phenotype. (B–D) Depot-specific effects on LipocyteProfiles in AMSCs at day 14 are under the polygenic control of the lipodystrophy cluster with a mitochondrial and AGP-driven profile in subcutaneous AMSCs (B), whereas in visceral AMSCs mostly Lipid features were associated with increased polygenic risk (C). See also Figure S6A (days 0, 3, and 8). Computationally averaged images of subcutaneous AMSCs from low- and high-risk allele carriers for lipodystrophy PRS show higher mitochondrial intensity, reduced cortical actin, and reduced lipid-droplet size in high-risk carriers (D). (E) Gene-feature connections for lipodystrophy PRS-mediated differential features are enriched for Mitochondrial Intensity features informative for mitochondrial membrane potential in subcutaneous AMSCs at day 14 (FDR < 0.1%). See also Figure S6D.
Figure 7
Figure 7
2p23.3 lipodystrophy-like locus effect on mitochondrial fragmentation and lipid accumulation in visceral adipocytes (A) PheWAS at the 2q23.3 risk locus shows associations with height, WHRadjBMI, T2D, and Calcium. (B) LipocyteProfiler was performed in subcutaneous and visceral AMSCs of eight risk and six non-risk haplotype carriers across adipocyte differentiation (days 0, 3, and 14). (C) In visceral AMSCs, 74 and 76 features were different between haplotypes at day 3 and day 14 of differentiation, respectively, with 70% of differential features at day 3 being mitochondrial and 80% lipid-related at day 14. (D) Representative images of visceral AMSCs from risk (top) and non-risk (bottom) haplotype at day 3 of differentiation stained using LipocytePainting. Scale bars, 10 μm. (E) Mito MaxIntensity and Mito Texture Entropy were higher at day 3 of differentiation in visceral AMSCs from six risk haplotype carriers, suggesting more fragmented and higher mitochondrial membrane potential. y axis shows LP units (normalized LP values across eight batches, see STAR Methods). (F) Representative images of visceral AMSCs from risk (top) and non-risk (bottom) haplotype at day 14 of differentiation stained using LipocytePainting. Scale bars, 10 μm. (G) LargeLipidObject MedianIntensity was lower and Lipid Texture AngularSecondMoment was higher at day 14 of differentiation in visceral AMSCs from six risk haplotype carriers, suggesting a perturbed lipid phenotype characterized by reduced lipid-droplet stabilization and/or formation. y axis shows LP units (normalized LP values across eight batches, see STAR Methods).

References

    1. Feng Y., Mitchison T.J., Bender A., Young D.W., Tallarico J.A. Multi-parameter phenotypic profiling: using cellular effects to characterize small-molecule compounds. Nat. Rev. Drug Discov. 2009;8:567–578. doi: 10.1038/nrd2876. - DOI - PubMed
    1. Green R.A., Kao H.-L., Audhya A., Arur S., Mayers J.R., Fridolfsson H.N., Schulman M., Schloissnig S., Niessen S., Laband K., et al. A high-resolution C. elegans essential gene network based on phenotypic profiling of a complex tissue. Cell. 2011;145:470–482. doi: 10.1016/j.cell.2011.03.037. - DOI - PMC - PubMed
    1. Hughes R.E., Elliott R.J.R., Dawson J.C., Carragher N.O. High-content phenotypic and pathway profiling to advance drug discovery in diseases of unmet need. Cell Chem. Biol. 2021;28:338–355. doi: 10.1016/j.chembiol.2021.02.015. - DOI - PubMed
    1. Neumann B., Walter T., Hériché J.K., Bulkescher J., Erfle H., Conrad C., Rogers P., Poser I., Held M., Liebel U., et al. Phenotypic profiling of the human genome by time-lapse microscopy reveals cell division genes. Nature. 2010;464:721–727. doi: 10.1038/nature08869. - DOI - PMC - PubMed
    1. Bray M.-A., Singh S., Han H., Davis C.T., Borgeson B., Hartland C., Kost-Alimova M., Gustafsdottir S.M., Gibson C.C., Carpenter A.E. Cell Painting, a high-content image-based assay for morphological profiling using multiplexed fluorescent dyes. Nat. Protoc. 2016;11:1757–1774. doi: 10.1038/nprot.2016.105. - DOI - PMC - PubMed

LinkOut - more resources