. 2023 May 31;3(7):100340.
doi: 10.1016/j.xgen.2023.100340. eCollection 2023 Jul 12.

OpenPBTA: The Open Pediatric Brain Tumor Atlas

Joshua A Shapiro  1 Krutika S Gaonkar  2   3   4 Stephanie J Spielman  1   5 Candace L Savonen  1 Chante J Bethell  1 Run Jin  2   3 Komal S Rathi  2   4 Yuankun Zhu  2   3 Laura E Egolf  6   7 Bailey K Farrow  2   3 Daniel P Miller  2   3 Yang Yang  8 Tejaswi Koganti  2   3 Nighat Noureen  9 Mateusz P Koptyra  2   3 Nhat Duong  4 Mariarita Santi  10   11 Jung Kim  12 Shannon Robins  2   3 Phillip B Storm  2   3 Stephen C Mack  13 Jena V Lilly  2   3 Hongbo M Xie  4 Payal Jain  2   3 Pichai Raman  2   4 Brian R Rood  14   15 Rishi R Lulla  16   17 Javad Nazarian  14   15   18 Adam A Kraya  2   3 Zalman Vaksman  7 Allison P Heath  2   3 Cassie Kline  7 Laura Scolaro  7 Angela N Viaene  10   11 Xiaoyan Huang  2   3 Gregory P Way  19 Steven M Foltz  1   20 Bo Zhang  2   3 Anna R Poetsch  21   22 Sabine Mueller  23 Brian M Ennis  2   3 Michael Prados  24 Sharon J Diskin  7   25 Siyuan Zheng  9 Yiran Guo  2 Shrivats Kannan  2   3 Angela J Waanders  26   27 Ashley S Margol  28   29 Meen Chul Kim  2   3 Derek Hanson  30   31 Nicholas Van Kuren  2   3 Jessica Wong  2   3 Rebecca S Kaufman  4   7 Noel Coleman  2   3 Christopher Blackden  2   3 Kristina A Cole  7   25   32 Jennifer L Mason  2   3 Peter J Madsen  2   3 Carl J Koschmann  33   34 Douglas R Stewart  12 Eric Wafula  4 Miguel A Brown  2   3 Adam C Resnick  2   3 Casey S Greene  1   19   35 Jo Lynne Rokita  2   3   4 Jaclyn N Taroni  1 Children’s Brain Tumor NetworkPacific Pediatric Neuro-Oncology Consortium
Affiliations

OpenPBTA: The Open Pediatric Brain Tumor Atlas

Joshua A Shapiro et al. Cell Genom. .

Abstract

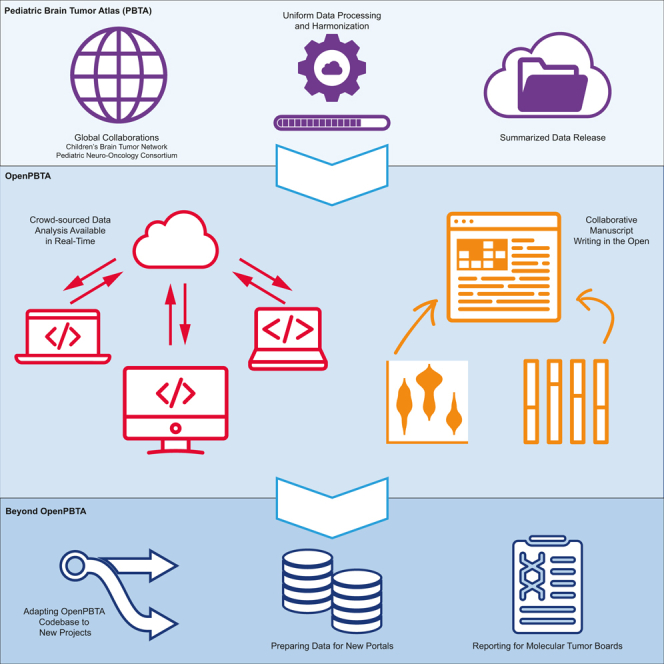
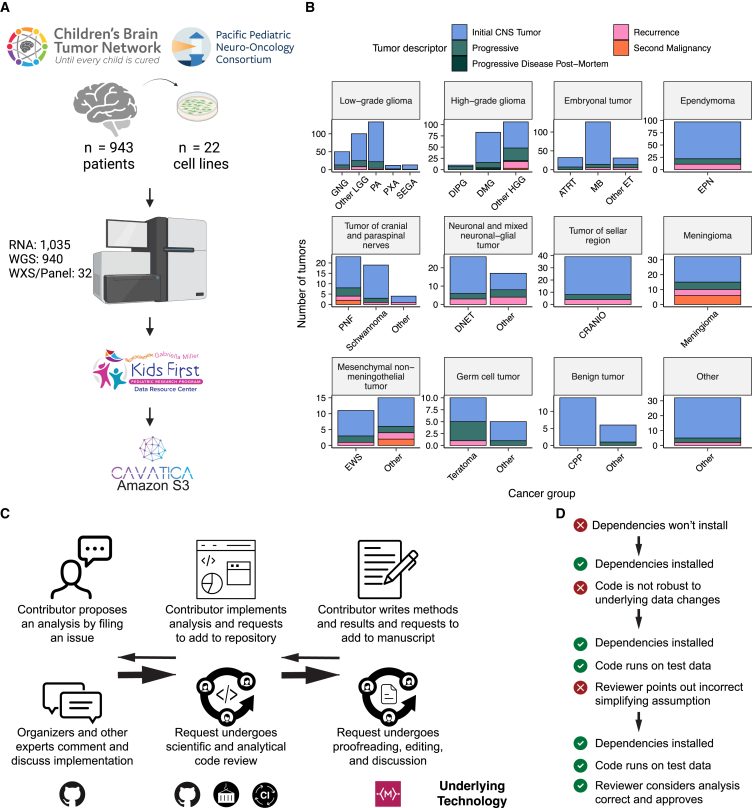
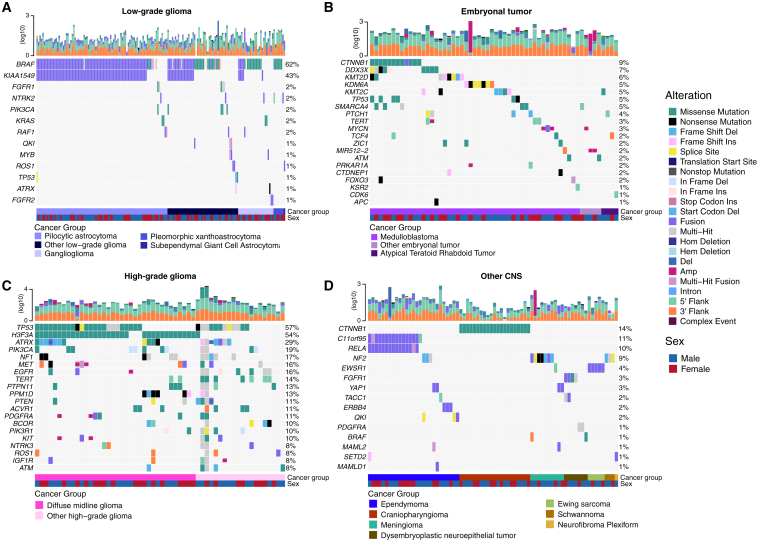
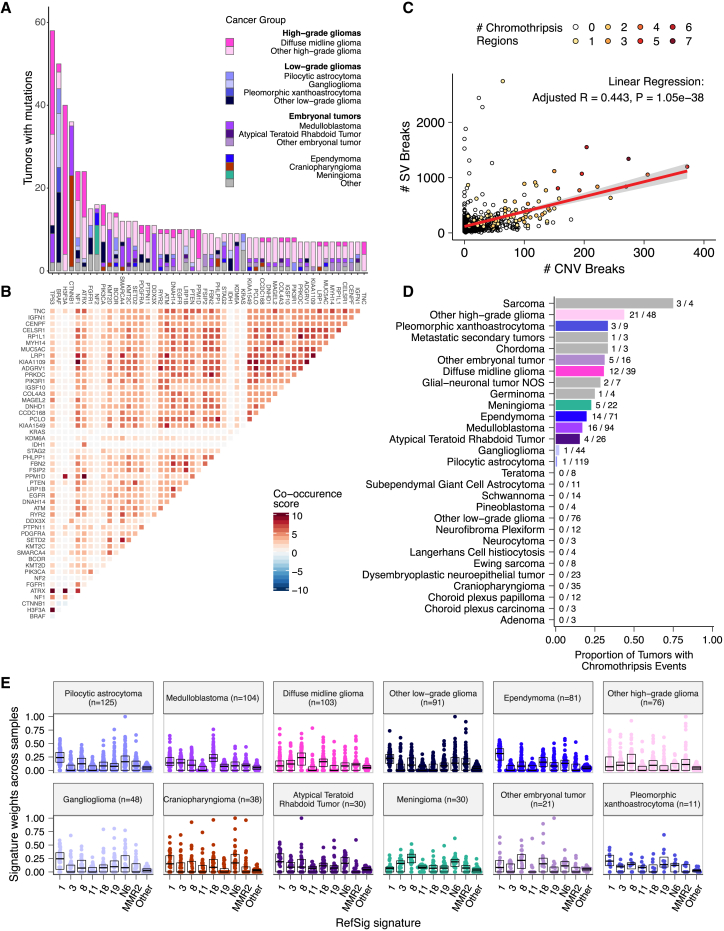
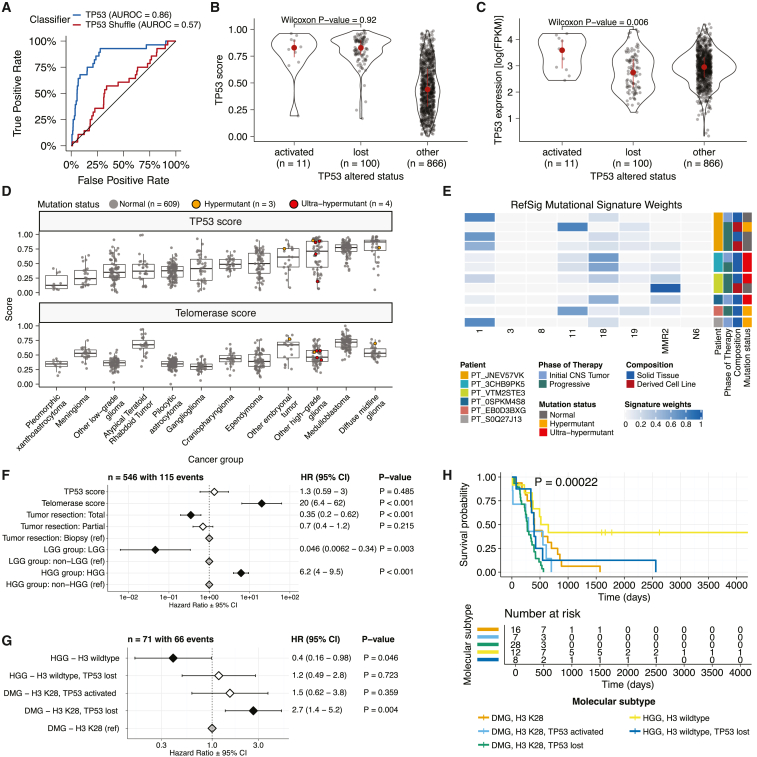
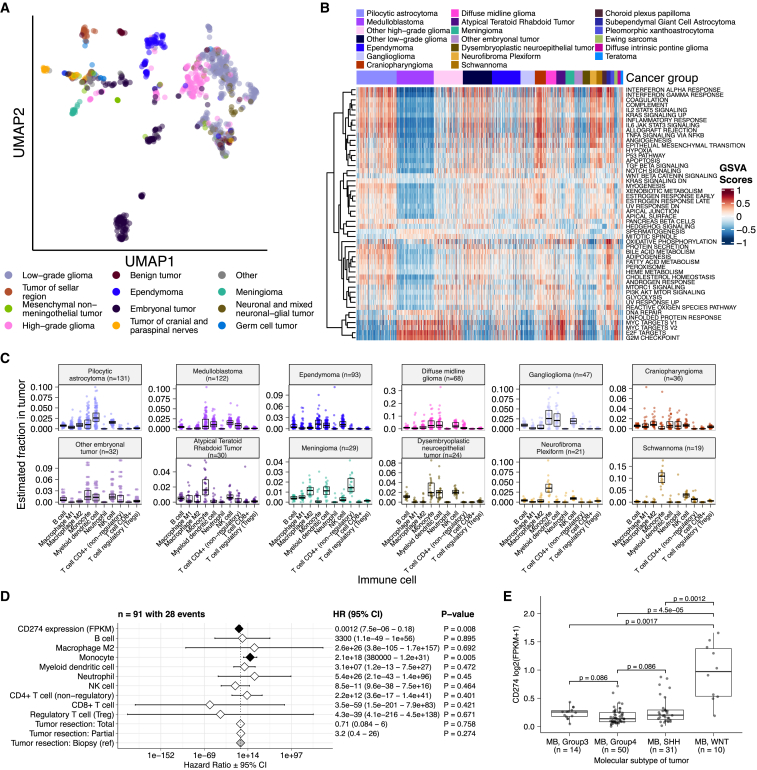
Pediatric brain and spinal cancers are collectively the leading disease-related cause of death in children; thus, we urgently need curative therapeutic strategies for these tumors. To accelerate such discoveries, the Children's Brain Tumor Network (CBTN) and Pacific Pediatric Neuro-Oncology Consortium (PNOC) created a systematic process for tumor biobanking, model generation, and sequencing with immediate access to harmonized data. We leverage these data to establish OpenPBTA, an open collaborative project with over 40 scalable analysis modules that genomically characterize 1,074 pediatric brain tumors. Transcriptomic classification reveals universal TP53 dysregulation in mismatch repair-deficient hypermutant high-grade gliomas and TP53 loss as a significant marker for poor overall survival in ependymomas and H3 K28-mutant diffuse midline gliomas. Already being actively applied to other pediatric cancers and PNOC molecular tumor board decision-making, OpenPBTA is an invaluable resource to the pediatric oncology community.

Keywords: brain tumors; classification; open science; pediatric cancer; reproducibility; somatic variation; tumor atlas.


Conflict of interest statement

C.S.G.’s spouse was an employee of Alex’s Lemonade Stand Foundation, which was a sponsor of this research. J.A.S., C.L.S., C.J.B., S.J.S., and J.N.T. are or were employees of Alex’s Lemonade Stand Foundation, a sponsor of this research. A.J.W. is a member of the Scientific Advisory boards for Alexion and DayOne Biopharmaceuticals.

Figures

None
Graphical abstract
Figure 1
Figure 1
Overview of the OpenPBTA project (A) CBTN and PNOC collected tumors from 943 patients. 22 tumor cell lines were created, and over 2,000 specimens were sequenced (n = 1035 RNA-seq, n = 940 WGS, and n = 32 WXS or targeted panel). The Kids First Data Resource Center Data harmonized the data using Amazon S3 through CAVATICA. Panel created with BioRender.com. (B) Number of biospecimens across phases of therapy, with one broad histology per panel. Each bar denotes a cancer group (abbreviations: GNG, ganglioglioma; other LGG, other low-grade glioma; PA, pilocytic astrocytoma; PXA, pleomorphic xanthoastrocytoma; SEGA, subependymal giant cell astrocytoma; DIPG, diffuse intrinsic pontine glioma; DMG, diffuse midline glioma; other HGG, other high-grade glioma; ATRT, atypical teratoid rhabdoid tumor; MB, medulloblastoma; other ET, other embryonal tumor; EPN, ependymoma; PNF, plexiform neurofibroma; DNET, dysembryoplastic neuroepithelial tumor; CRANIO, craniopharyngioma; EWS, Ewing sarcoma; CPP, choroid plexus papilloma). (C) Overview of the open analysis and manuscript contribution models. Contributors proposed analyses, implemented it in their fork, and filed a pull request (PR) with proposed changes. PRs underwent review for scientific rigor and accuracy. Container and continuous integration technologies ensured that all software dependencies were included and that code was not sensitive to underlying data changes. Finally, a contributor filed a PR documenting their methods and results to the Manubot-powered manuscript repository for review. (D) A potential path for an analytical PR. Arrows indicate revisions.
Figure 2
Figure 2
Mutational landscape of PBTA tumors Frequencies of canonical somatic gene mutations, CNVs, fusions, and TMB (top bar plot) for the top mutated genes across primary tumors within the OpenPBTA dataset. (A) LGGs (n = 226): pilocytic astrocytoma (n = 104), other LGG (n = 68), ganglioglioma (n = 35), pleomorphic xanthoastrocytoma (n = 9), and subependymal giant cell astrocytoma (n = 10). (B) Embryonal tumors (n = 129): medulloblastoma (n = 95), atypical teratoid rhabdoid tumor (n = 24), and other embryonal tumor (n = 10). (C) HGGs (n = 63): diffuse midline glioma (n = 36) and other HGG (n = 27). (D) Other CNS tumors (n = 153): ependymoma (n = 60), craniopharyngioma (n = 31), meningioma (n = 17), dysembryoplastic neuroepithelial tumor (n = 19), Ewing sarcoma (n = 7), schwannoma (n = 12), and neurofibroma plexiform (n = 7). Rare CNS tumors are displayed in Figure S3B. Histology (cancer group) and sex annotations are displayed under each plot. Only tumors with mutations in the listed genes are shown. Multiple CNVs are denoted as a complex event. n denotes the number of unique tumors (one tumor per patient).
Figure 3
Figure 3
Mutational co-occurrence and signatures highlight key oncogenic drivers (A) Non-synonymous mutations for 50 most commonly mutated genes across all histologies. “Other” denotes a histology with <10 tumors. (B) Co-occurrence and mutual exclusivity of mutated genes. The co-occurrence score is defined as I(log10(P)) where P is Fisher’s exact test and I is 1 when mutations co-occur more often than expected or −1 when exclusivity is more common. (C) Number of SV and CNV breaks are significantly correlated (adjusted R = 0.443, p = 1.05e−38). (D) Chromothripsis frequency across cancer groups with n ≥3 tumors. (E) Sina plots of RefSig signature weights for signatures 1, 11, 18, 19, 3, 8, N6, MMR2, and other across cancer groups. Boxplot represents 5% (lower whisker), 25% (lower box), 50% (median), 75% (upper box), and 95% (upper whisker) quantiles.
Figure 4
Figure 4
TP53 and telomerase activity (A) Receiver operating characteristic for TP53 classifier run on stranded FPKM RNA-seq. (B) Violin and strip plots of TP53 scores plotted by TP53 alteration type (nactivated = 11, nlost = 100, nother = 866, Wilcoxon p = 0.92). (C) Violin and strip plots of TP53 RNA expression plotted by TP53 activation status (nactivated = 11, nlost = 100, nother = 866, Wilcoxon p = 0.006). (D) Boxplots of TP53 and telomerase (EXTEND) scores across cancer groups. TMB status is highlighted in orange (hypermutant) or red (ultra-hypermutant). Boxplot represents 5% (lower whisker), 25% (lower box), 50% (median), 75% (upper box), and 95% (upper whisker) quantiles. (E) Heatmap of RefSig mutational signatures for patients with at least one hypermutant tumor or cell line. (F) Forest plot depicting prognostic effects of TP53 and telomerase scores on overall survival (OS), controlling for extent of tumor resection, LGG group, and HGG group. (G) Forest plot depicting the effect of molecular subtype on HGG OS. Hazard ratios (HRs) with 95% confidence intervals and p values (multivariate Cox) are given in (F) and (G). Black diamonds denote significant p values, and gray diamonds denote reference groups. (H) Kaplan-Meier curve of HGGs by molecular subtype.
Figure 5
Figure 5
Transcriptomic and immune landscape of pediatric brain tumors (A) First two dimensions of transcriptome data UMAP, with points colored by broad histology. (B) Heatmap of GSVA scores for Hallmark gene sets with tumors ordered by cancer group. (C) Boxplots of quanTIseq estimates of immune cell proportions in cancer groups with n >15 tumors. Note: other HGGs and other LGGs have immune cell proportions similar to DMG and pilocytic astrocytoma, respectively, and are not shown. (D) Forest plot depicting additive effects of CD274 expression, immune cell proportion, and extent of tumor resection on OS of medulloblastoma patients. HRs with 95% confidence intervals and p values (multivariate Cox) are listed. Black diamonds denote significant p values, and gray diamonds denote reference groups. Note: the macrophage M1 HR was 0 (coefficient = −9.90e4) with infinite upper and lower confidence intervals (CIs) and thus was not included in the figure. (E) Boxplot of CD274 expression (log2 FPKM) for medulloblastomas grouped by subtype. Bonferroni-corrected p values from Wilcoxon tests are shown. Boxplot represents 5% (lower whisker), 25% (lower box), 50% (median), 75% (upper box), and 95% (upper whisker) quantiles. Only stranded RNA-seq data are plotted.

References

    1. Ostrom Q.T., Cioffi G., Gittleman H., Patil N., Waite K., Kruchko C., Barnholtz-Sloan J.S. CBTRUS statistical report: primary brain and other central nervous system tumors diagnosed in the United States in 2012–2016. Neuro Oncol. 2019;21:v1–v100. doi: 10.1093/neuonc/noz150. - DOI - PMC - PubMed
    1. Ostrom Q.T., Gittleman H., Xu J., Kromer C., Wolinsky Y., Kruchko C., Barnholtz-Sloan J.S. CBTRUS statistical report: primary brain and other central nervous system tumors diagnosed in the United States in 2009–2013. Neuro Oncol. 2016;18:v1–v75. doi: 10.1093/neuonc/now207. - DOI - PMC - PubMed
    1. de Blank P.M., Ostrom Q.T., Rouse C., Wolinsky Y., Kruchko C., Salcido J., Barnholtz-Sloan J.S. Years of life lived with disease and years of potential life lost in children who die of cancer in the United States, 2009. Cancer Med. 2015;4:608–619. doi: 10.1002/cam4.410. - DOI - PMC - PubMed
    1. Lilly J.V., Rokita J.L., Mason J.L., Patton T., Stefankiewiz S., Higgins D., Trooskin G., Larouci C.A., Arya K., Appert E., et al. The children's brain tumor network (CBTN) - accelerating research in pediatric central nervous system tumors through collaboration and open science. Neoplasia. 2023;35:100846. doi: 10.1016/j.neo.2022.100846. - DOI - PMC - PubMed
    1. Oncology Center of Excellence. U.S. Food and Drug Administration . Food and Drug Administration; 2022. Pediatric Oncology Drug Approvals.