

Evidence of hybridization between genetically distinct Baltic cod stocks during peak population abundance(s)
- PMID: 37492148
- PMCID: PMC10363836
- DOI: 10.1111/eva.13575
Evidence of hybridization between genetically distinct Baltic cod stocks during peak population abundance(s)
Abstract
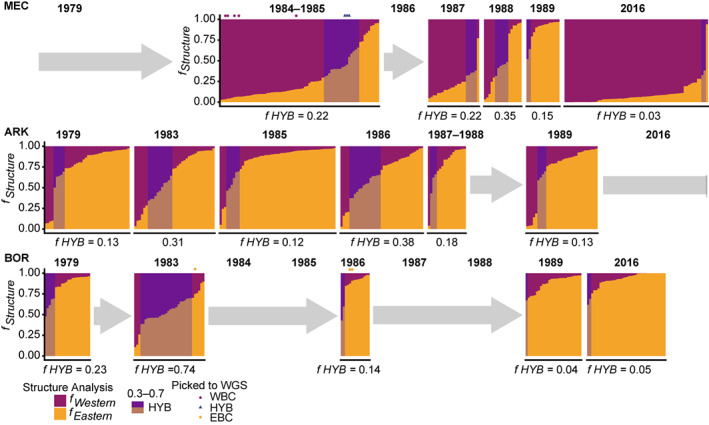
Range expansions can lead to increased contact of divergent populations, thus increasing the potential of hybridization events. Whether viable hybrids are produced will most likely depend on the level of genomic divergence and associated genomic incompatibilities between the different entities as well as environmental conditions. By taking advantage of historical Baltic cod (Gadus morhua) otolith samples combined with genotyping and whole genome sequencing, we here investigate the genetic impact of the increased spawning stock biomass of the eastern Baltic cod stock in the mid 1980s. The eastern Baltic cod is genetically highly differentiated from the adjacent western Baltic cod and locally adapted to the brackish environmental conditions in the deeper Eastern basins of the Baltic Sea unsuitable for its marine counterparts. Our genotyping results show an increased proportion of eastern Baltic cod in western Baltic areas (Mecklenburg Bay and Arkona Basin)-indicative of a range expansion westwards-during the peak population abundance in the 1980s. Additionally, we detect high frequencies of potential hybrids (including F1, F2 and backcrosses), verified by whole genome sequencing data for a subset of individuals. Analysis of mitochondrial genomes further indicates directional gene flow from eastern Baltic cod males to western Baltic cod females. Our findings unravel that increased overlap in distribution can promote hybridization between highly divergent populations and that the hybrids can be viable and survive under specific and favourable environmental conditions. However, the observed hybridization had seemingly no long-lasting impact on the continuous separation and genetic differentiation between the unique Baltic cod stocks.
Keywords: Baltic Sea; Gadus morhua; contact zone; hybridization; inversions; population genetics.
© 2023 The Authors. Evolutionary Applications published by John Wiley & Sons Ltd.
Conflict of interest statement
The authors declare no conflicts of interest.
Figures


References
-
- Arnold, M. L. (1997). 1 natural hybridization: Defenitions and history. In Arnold M. L. (Ed.), Natural hybridization and evolution Oxford Series in Ecology and Evolution (pp. 3–10). Oxford University Press. https://books.google.no/books?id=RXU8DwAAQBAJ
-
- Baranova, T. , Müller‐Karulis, B. , & Plikshs, M. (2011). Changes in the annual life cicle of eastern Baltic cod during 1950–2010. ICES CM 2011/R: 10.
-
- Barth, J. M. I. , Berg, P. R. , Jonsson, P. R. , Bonanomi, S. , Corell, H. , Hemmer‐Hansen, J. , Jakobsen, K. S. , Johannesson, K. , Jorde, P. E. , Knutsen, H. , Moksnes, P. O. , Star, B. , Stenseth, N. C. , Svedäng, H. , Jentoft, S. , & André, C. (2017). Genome architecture enables local adaptation of Atlantic cod despite high connectivity. Molecular Ecology, 26, 4452–4466. 10.1111/mec.14207 - DOI - PubMed
-
- Barth, J. M. I. , Gubili, C. , Matschiner, M. , Tørresen, O. K. , Watanabe, S. , Egger, B. , Han, Y. S. , Feunteun, E. , Sommaruga, R. , Jehle, R. , & Schabetsberger, R. (2020). Stable species boundaries despite ten million years of hybridization in tropical eels. Nature Communications, 11, 1433. 10.1038/s41467-020-15099-x - DOI - PMC - PubMed
-
- Barth, J. M. I. , Villegas‐Ríos, D. , Freitas, C. , Moland, E. , Star, B. , André, C. , Knutsen, H. , Bradbury, I. , Dierking, J. , Petereit, C. , Righton, D. , Metcalfe, J. , Jakobsen, K. S. , Olsen, E. M. , & Jentoft, S. (2019). Disentangling structural genomic and behavioural barriers in a sea of connectivity. Molecular Ecology, 28, 1394–1411. 10.1111/mec.15010 - DOI - PMC - PubMed
Associated data
LinkOut - more resources
Full Text Sources
Miscellaneous
