. 2023 Jul 10:11:1195806.
doi: 10.3389/fcell.2023.1195806. eCollection 2023.

Optogenetic modulation of guanine nucleotide exchange factors of Ras superfamily proteins directly controls cell shape and movement

Affiliations

Optogenetic modulation of guanine nucleotide exchange factors of Ras superfamily proteins directly controls cell shape and movement

Dhiman Sankar Pal et al. Front Cell Dev Biol. .

Abstract

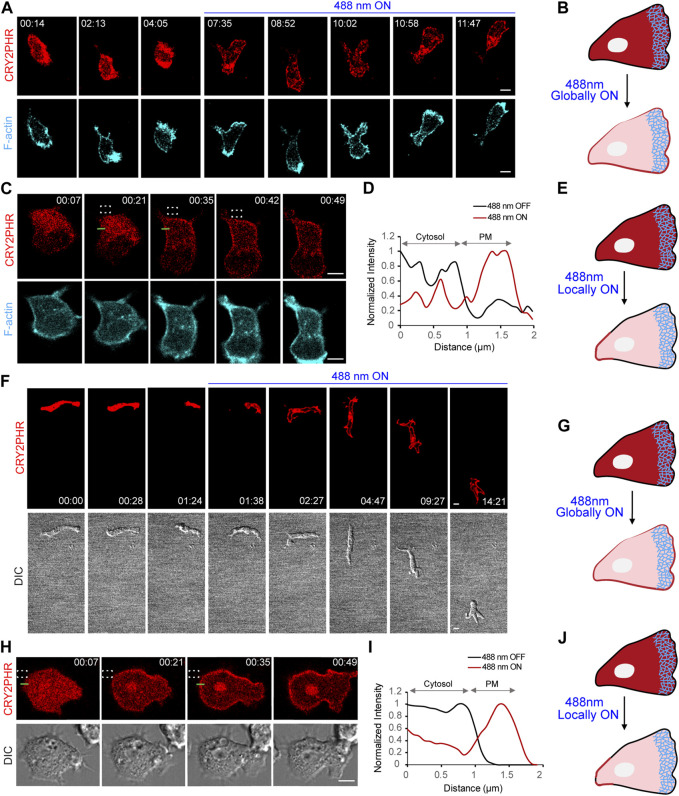
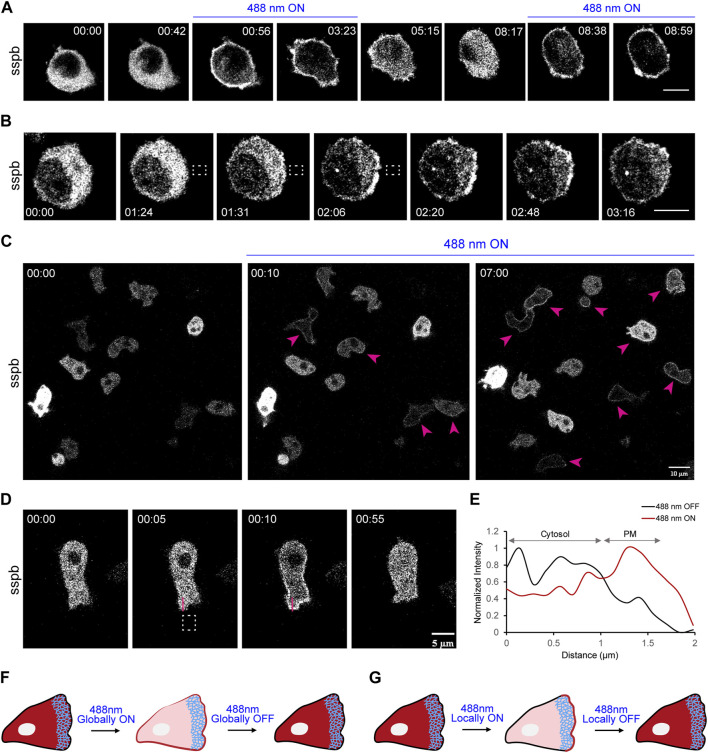
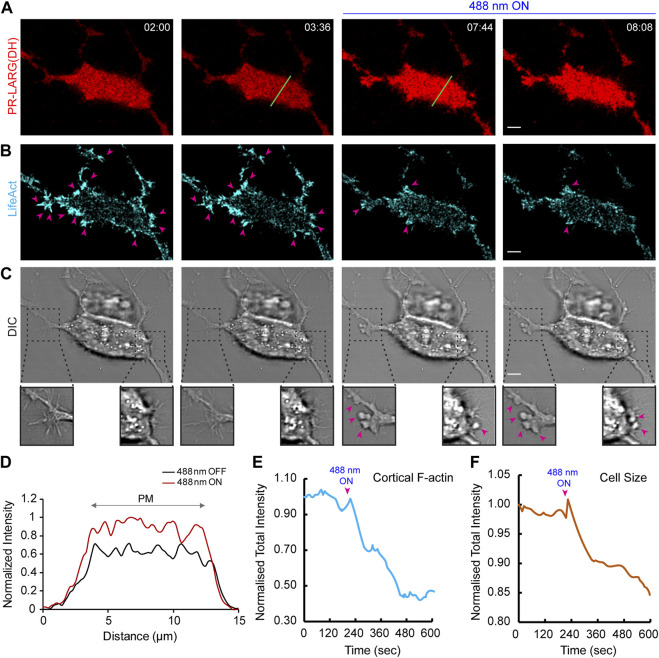
In this article, we provide detailed protocols on using optogenetic dimerizers to acutely perturb activities of guanine nucleotide exchange factors (GEFs) specific to Ras, Rac or Rho small GTPases of the migratory networks in various mammalian and amoeba cell lines. These GEFs are crucial components of signal transduction networks which link upstream G-protein coupled receptors to downstream cytoskeletal components and help cells migrate through their dynamic microenvironment. Conventional approaches to perturb and examine these signaling and cytoskeletal networks, such as gene knockout or overexpression, are protracted which allows networks to readjust through gene expression changes. Moreover, these tools lack spatial resolution to probe the effects of local network activations. To overcome these challenges, blue light-inducible cryptochrome- and LOV domain-based dimerization systems have been recently developed to control signaling or cytoskeletal events in a spatiotemporally precise manner. We illustrate that, within minutes of global membrane recruitment of full-length GEFs or their catalytic domains only, widespread increases or decreases in F-actin rich protrusions and cell size occur, depending on the particular node in the networks targeted. Additionally, we demonstrate localized GEF recruitment as a robust assay system to study local network activation-driven changes in polarity and directed migration. Altogether, these optical tools confirmed GEFs of Ras superfamily GTPases as regulators of cell shape, actin dynamics, and polarity. Furthermore, this optogenetic toolbox may be exploited in perturbing complex signaling interactions in varied physiological contexts including mammalian embryogenesis.

Keywords: actin cytoskeleton; cancer metastasis; development; diabetes; growth factor signaling; immunity; neural networks; optogenetics.


Conflict of interest statement

The authors declare that the research was conducted in the absence of any commercial or financial relationships that could be construed as a potential conflict of interest.

Figures

FIGURE 1
FIGURE 1
Schematic representation of cryptochrome- and improved light-inducible dimer (iLID)-based optogenetics. (A) Schematic illustrating recruitment of cytosolic CRY2PHR-mCherry fused with a protein of interest to the plasma membrane anchor, CIBN-CAAX, by global or local illumination with 488 nm laser. (B) Schematic demonstrating recruitment of cytosolic SspB-RFP fused with a protein of interest to the membrane anchor, iLID-CAAX, by global or local illumination with 488 nm light. (C) Depending on the region of the plasma membrane where 488 nm light was applied, CRY2PHR or SspB was recruited either all over the cell boundary (global recruitment), or specifically to the front or back of the cell (local recruitment).
FIGURE 2
FIGURE 2
Establishment of cryptochrome system in neutrophils and Dictyostelium. (A) Time-lapse confocal images of differentiated HL-60 neutrophil expressing CRY2PHR-mCherry (red; upper panel) and LifeAct-miRFP703 (cyan; lower panel), before or after 488 nm laser was turned on globally. Time in min:sec format. Scale bars represent 5 μm. (B) Cartoon showing global recruitment of CRY2PHR-mCherry from cytosol to plasma membrane of neutrophils after turning on 488 nm laser globally. (C) Time-lapse images of differentiated HL-60 neutrophil expressing CRY2PHR-mCherry (red; upper panel) and LifeAct-miRFP703 (cyan; lower panel). CRY2PHR was recruited exclusively to the back of the neutrophil by applying 488 nm light near it, as denoted by dashed white box. Time in min:sec format. Scale bars represent 5 μm. (D) A linescan across the cytosol-membrane of the cell in (C; shown with green line) denoting increased CRY2PHR intensity on the membrane after laser was switched on near the region. (E) Cartoon showing local recruitment of CRY2PHR-mCherry from cytosol to the back membrane of neutrophils after turning on 488 nm laser locally. (F) Time-lapse confocal images of developed Dictyostelium expressing CRY2PHR-mCherry (red; upper panel) before or after 488 nm laser was switched on globally. Cell morphology and motility were visualized in DIC channel (lower panel). Time in min:sec format. Scale bars represent 5 μm. (G) Cartoon showing global recruitment of CRY2PHR-mCherry from cytosol to plasma membrane of Dictyostelium after turning on 488 nm laser globally. (H) Time-lapse images of developed Dictyostelium expressing CRY2PHR-mCherry (red; upper panel). CRY2PHR was recruited exclusively to the back of the cell by applying 488 nm light near it, as denoted by dashed white box. Cell morphology and protrusive activity were visualized in DIC channel (lower panel). Time in min:sec format. Scale bars represent 5 μm. (I) A linescan across the cytosol-membrane of the cell in (H; shown with green line) denoting increased CRY2PHR intensity on the membrane after laser was switched on near the region. (J) Cartoon showing local recruitment of CRY2PHR-mCherry from cytosol to the back membrane of Dictyostelium after turning on 488 nm laser locally.
FIGURE 3
FIGURE 3
Establishment of LOV domain-based iLID system in macrophages and Dictyostelium. (A) Time-lapse confocal images of RAW 264.7 macrophage expressing tgRFPt-SSPB R73Q (or sspb) before or after 488 nm laser was turned on globally. Time in min:sec format. Scale bars represent 5 μm. (B) Time-lapse images of RAW 264.7 macrophage expressing tgRFPt-SSPB R73Q (or sspb) which was recruited exclusively to one side of the cell by applying 488 nm light near it, as denoted by dashed white box. Both (A, B) highlight the fast reversibility of this system. Time in min:sec format. Scale bars represent 5 μm. (C) Time-lapse confocal images of a field of vegetative Dictyostelium expressing tgRFPt-SSPB R73Q (or sspb) before or after 488 nm laser was switched on globally. Pink arrows denote successful recruitment in cells. Time in min:sec format. Scale bars represent 5 μm. (D) Time-lapse images of vegetative Dictyostelium expressing tgRFPt-SSPB R73Q (or sspb) which was recruited exclusively to one side of the cell by applying 488 nm light near it, as denoted by dashed white box. Time in min:sec format. Scale bars represent 5 μm. (E) A linescan across the cytosol-membrane of the cell in (D) denoting increased sspb intensity on the membrane after laser was switched on near the region. (F) Schematic representation of experimental data shown in (A). (G) Schematic representation of experimental data shown in (B, D). Both (F, G) highlight fast reversibility of iLID system with both global or local recruitment experiments.
FIGURE 4
FIGURE 4
Establishment of an opto-RasGEF system in neutrophils. (A) Time-lapse confocal images of differentiated HL-60 neutrophil expressing CRY2PHR-mCherry-RasGRP4 (red; upper panel) and LifeAct-miRFP703 (cyan; lower panel), before or after 488 nm laser was turned on globally. Time in min:sec format. Scale bars represent 5 μm. (B) Representative membrane kymograph of cortical LifeAct intensity in opto-RasGEF expressing neutrophil before or after 488 nm laser was turned on. The linear color map denotes blue is the lowest LifeAct intensity and yellow is the highest. Duration of the kymograph is 29 min. Box-and-whisker plots of (C) cell area and (D) aspect ratio, before or after RasGEF recruitment. nc = 12 from atleast three independent experiments. Asterisks denote significant difference, ***p ≤ 0.001 (Wilcoxon-Mann-Whitney rank-sum test) (E) Time-lapse confocal images of differentiated HL-60 neutrophil expressing CRY2PHR-mCherry-RasGRP4 (red; upper panel) and LifeAct-miRFP703 (cyan; lower panel). Opto-RasGEF was recruited precisely to the back of the cell as shown with the dashed white box, resulting in new F-actin protrusions (shown by pink arrows in LifeAct panel) at the recruitment site. Time in min:sec format. Scale bars represent 5 μm. (F) Polar histogram of opto-RasGEF (nc = 14 and np = 35) demonstrate greater probability of new protrusion generation near the recruitment region.
FIGURE 5
FIGURE 5
Establishment of an opto-RhoGEF system in epithelial cells. Time-lapse confocal images of MCF-10CA1h cell expressing 2XPDZ-mCherry-LARG (DH) (red; (A) and Lifeact-7-iRFP670 (cyan); (B), before or after 488 nm laser was turned on globally. Confocal slices are focused at the substrate-attached basal surface of the cell. 488 nm light was turned on at 03:44 (min:sec), and images were acquired every 8 s. Pink arrows denote F-actin rich protrusions in the cell, and its subsequent decrease after laser was switched on. Cell morphology and protrusions were visualized in the DIC channel (C). Disappearance of protrusions and appearance of blebbing after recruitment can be visualized in magnified view with pink arrows. Time in min:sec format. Scale bars represent 5 μm. (D) A linescan across the bottom surface of the cell in (A; shown with green line) denoting uniform increase in LARG (DH) intensity on the cell membrane after laser was switched on globally. Quantifications display reduction in cortical F-actin (E) and decrease in cell size (F) upon opto-RhoGEF recruitment to the cell membrane.
FIGURE 6
FIGURE 6
Establishment of an opto-RacGEF system in Dictyostelium. (A) Time-lapse confocal images of vegetative Dictyostelium cell expressing tgRFPt-SspB R73Q-RacGEF1 (catalytic domain) before or after 488 nm laser was turned on globally. Pink arrows denote appearance of protrusions on the cell periphery after opto-RacGEF recruitment. Time in min:sec format. Scale bars represent 5 μm. Box-and-whisker plots of (B) cell area, (C) aspect ratio and (D) average speed, before or after RacGEF recruitment. nc = 25 from atleast three independent experiments. Asterisks denote significant difference, **p ≤ 0.01 and ****p ≤ 0.0001 (Wilcoxon-Mann-Whitney rank-sum test) (E) Time-lapse confocal images of vegetative Dictyostelium expressing opto-RacGEF which was recruited precisely to the back of the cell as shown with the dashed white box. This resulted in new protrusions (shown by pink arrows) at the recruitment site causing the cell to move towards the direction of the light. Time in min:sec format. Scale bars represent 5 μm. (F) Polar histogram of opto-RacGEF (nc = 35 and np = 52) demonstrate greater probability of new protrusion generation near the recruitment region.

References

    1. Artemenko Y., Lampert T. J., Devreotes P. N. (2014). Moving towards a paradigm: Common mechanisms of chemotactic signaling in Dictyostelium and mammalian leukocytes. Cell. Mol. Life Sci. 71, 3711–3747. 10.1007/s00018-014-1638-8 - DOI - PMC - PubMed
    1. Banerjee T., Biswas D., Pal D. S., Miao Y., Iglesias P. A., Devreotes P. N. (2022). Spatiotemporal dynamics of membrane surface charge regulates cell polarity and migration. Nat. Cell. Biol. 24, 1499–1515. 10.1038/s41556-022-00997-7 - DOI - PMC - PubMed
    1. Banerjee T., Matsuoka S., Biswas D., Miao Y., Pal D. S., Kamimura Y., et al. (2023). A dynamic partitioning mechanism polarizes membrane protein distribution. bioRxiv. 10.1101/2023.01.03.522496 - DOI - PMC - PubMed
    1. Bell G. R. R., Rincon E., Akdogan E., Collins S. R. (2021). Optogenetic control of receptors reveals distinct roles for actin- and Cdc42-dependent negative signals in chemotactic signal processing. Nat. Commun. 12, 6148. 10.1038/s41467-021-26371-z - DOI - PMC - PubMed
    1. Bos J. L., Rehmann H., Wittinghofer A. (2007). GEFs and GAPs: Critical elements in the control of small G proteins. Cell. 129, 865–877. 10.1016/j.cell.2007.05.018 - DOI - PubMed