. 2023 Jul 12;5(4):fcad200.
doi: 10.1093/braincomms/fcad200. eCollection 2023.

Associations between sleep health and grey matter volume in the UK Biobank cohort (n = 33 356)

Affiliations

Associations between sleep health and grey matter volume in the UK Biobank cohort (n = 33 356)

Julian E Schiel et al. Brain Commun. .

Abstract

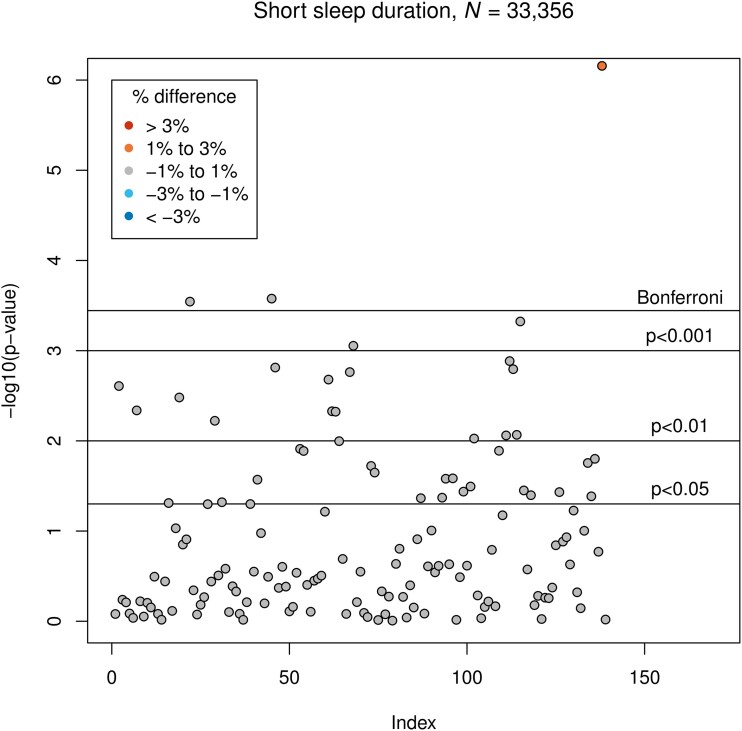
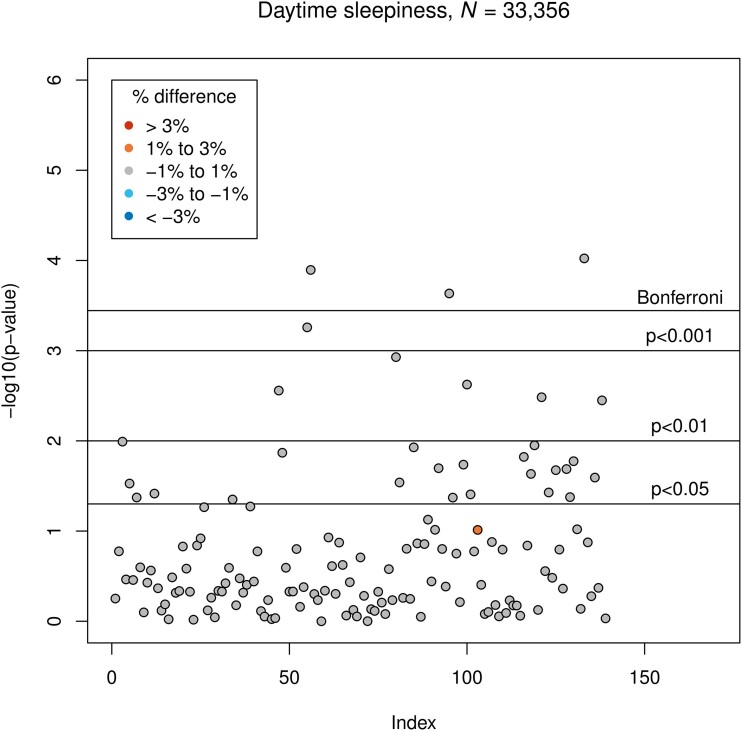
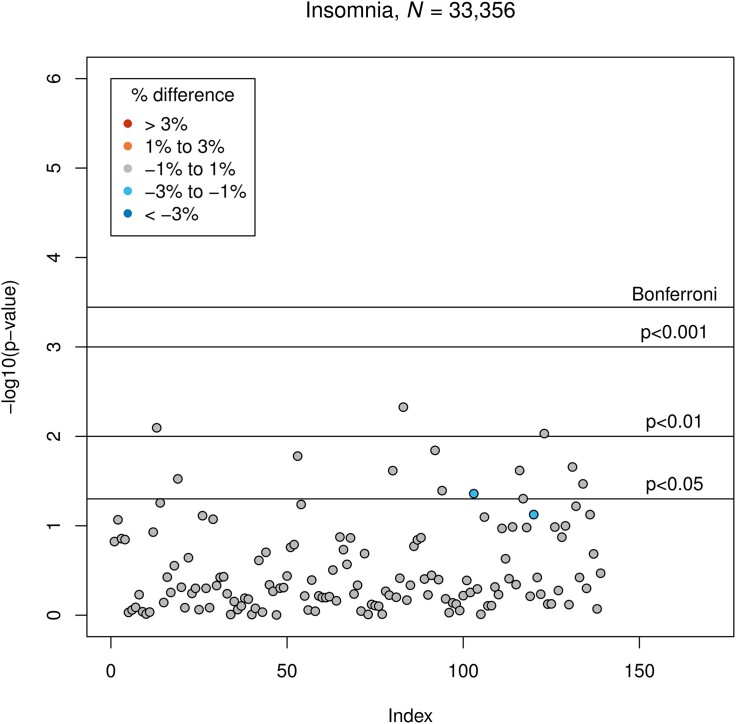
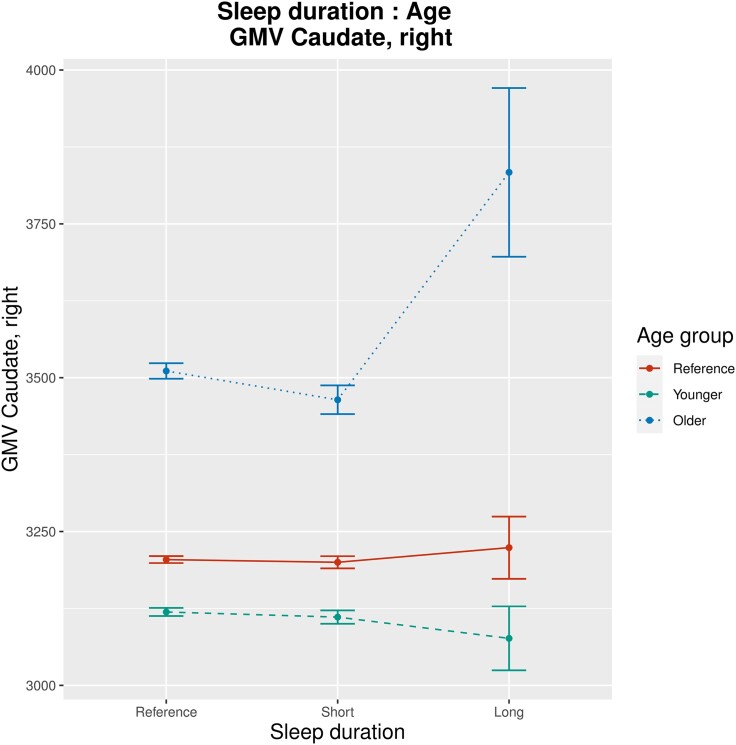
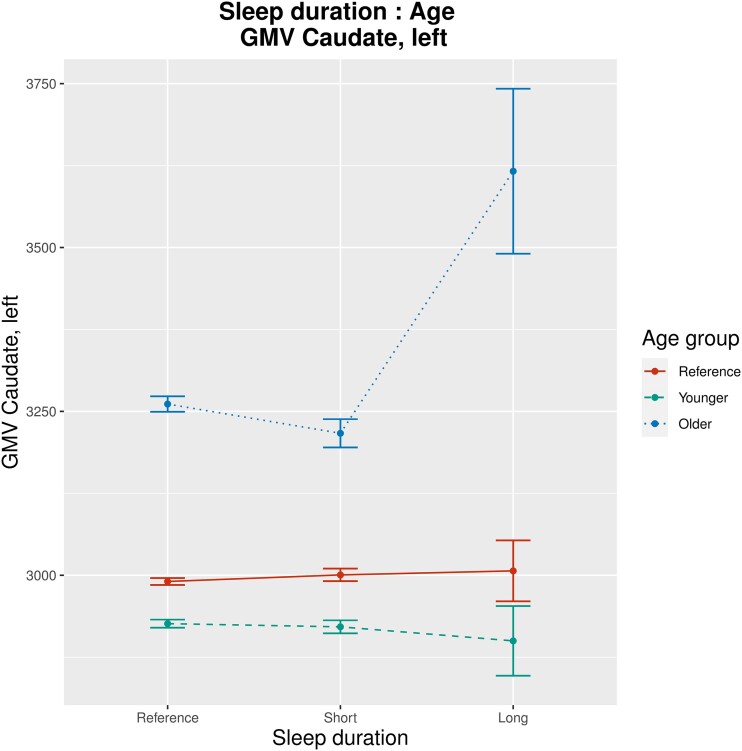
As suggested by previous research, sleep health is assumed to be a key determinant of future morbidity and mortality. In line with this, recent studies have found that poor sleep is associated with impaired cognitive function. However, to date, little is known about brain structural abnormalities underlying this association. Although recent findings link sleep health deficits to specific alterations in grey matter volume, evidence remains inconsistent and reliant on small sample sizes. Addressing this problem, the current preregistered study investigated associations between sleep health and grey matter volume (139 imaging-derived phenotypes) in the UK Biobank cohort (33 356 participants). Drawing on a large sample size and consistent data acquisition, sleep duration, insomnia symptoms, daytime sleepiness, chronotype, sleep medication and sleep apnoea were examined. Our main analyses revealed that long sleep duration was systematically associated with larger grey matter volume of basal ganglia substructures. Insomnia symptoms, sleep medication and sleep apnoea were not associated with any of the 139 imaging-derived phenotypes. Short sleep duration, daytime sleepiness as well as late and early chronotype were associated with solitary imaging-derived phenotypes (no recognizable pattern, small effect sizes). To our knowledge, this is the largest study to test associations between sleep health and grey matter volume. Clinical implications of the association between long sleep duration and larger grey matter volume of basal ganglia are discussed. Insomnia symptoms as operationalized in the UK Biobank do not translate into grey matter volume findings.

Keywords: UK Biobank; basal ganglia; grey matter volume; sleep duration; sleep health.


Conflict of interest statement

The authors report no competing interests.

Figures

Graphical Abstract
Graphical Abstract
Figure 1
Figure 1
Results of LM3 (one-sixth; adjusted linear model): associations between long sleep duration and GMV of all 139 IDPs as indexed in Supplementary Table 3. The vertical axis indicates the P-value, and colours indicate the direction of difference (plus percentage difference). Significant associations after Bonferroni correction: IDPs 60, 99, 100 and 104 (see Supplementary Table 3).
Figure 2
Figure 2
Results of LM3 (two-sixths; adjusted linear model): associations between short sleep duration and GMV. The vertical axis indicates the P-value, and colours indicate the direction of difference (plus percentage difference). Significant associations after Bonferroni correction: IDPs 22, 45 and 138 (see Supplementary Table 3).
Figure 3
Figure 3
Results of LM3 (three-sixths; adjusted linear model): associations between excessive daytime sleepiness and GMV. The vertical axis indicates the P-value, and colours indicate the direction of difference (plus percentage difference). Significant associations after Bonferroni correction: IDPs 56, 95 and 133 (see Supplementary Table 3).
Figure 4
Figure 4
Results of LM3 (four-sixths; adjusted linear model): associations between late chronotype and GMV. The vertical axis indicates the P-value, and colours indicate the direction of difference (plus percentage difference). Significant associations after Bonferroni correction: IDP 73 (see Supplementary Table 3).
Figure 5
Figure 5
Results of LM3 (five-sixths; adjusted linear model): associations between early chronotype and GMV. The vertical axis indicates the P-value, and colours indicate the direction of difference (plus percentage difference). Significant associations after Bonferroni correction: IDP 65 (see Supplementary Table 3).
Figure 6
Figure 6
Results of LM3 (six-sixths; adjusted linear model): associations between insomnia symptoms and GMV. The vertical axis indicates the P-value, and colours indicate the direction of difference (plus percentage difference). Significant associations after Bonferroni correction: None.
Figure 7
Figure 7
Results of sLM7 (one-half; interaction effects between sex/age and all sleep-related variables included): group-wise mean GMV, illustrating interaction effects between sleep duration and age regarding their association with GMV of the left caudate (β = 18.4, P = 3.7 × 10⁻⁵). For visualization purposes, the continuous variable age has been factorized into three categories (‘younger’, ‘reference’ and ‘older’), with a uniform division of the range between minimal and maximal age. Bars indicate group-wise standard error. Units of measurement (GMV) are mm3.
Figure 8
Figure 8
Results of sLM7 (two-twos; interaction effects between sex/age and all sleep-related variables included): group-wise mean GMV, illustrating interaction effects between sleep duration and age regarding their association with GMV of the right caudate (β = 18.3, P = 2.0 × 10⁻⁵). For visualization purposes, the continuous variable age has been factorized into three categories (‘younger’, ‘reference’ and ‘older’), with a uniform division of the range between minimal and maximal age. Bars indicate group-wise standard error. Units of measurement (GMV) are mm3.

References

    1. Saper CB, Fuller PM. Wake–sleep circuitry: An overview. Curr Opin Neurobiol. 2017;44:186–192. - PMC - PubMed
    1. Liu TZ, Xu C, Rota M, et al. . Sleep duration and risk of all-cause mortality: A flexible, non-linear, meta-regression of 40 prospective cohort studies. Sleep Med Rev. 2017;32:28–36. - PubMed
    1. Cappuccio FP, Cooper D, D'Elia L, Strazzullo P, Miller MA. Sleep duration predicts cardiovascular outcomes: A systematic review and meta-analysis of prospective studies. Eur Heart J. 2011;32(12):1484–1492. - PubMed
    1. Li M, Zhang XW, Hou WS, Tang ZY. Insomnia and risk of cardiovascular disease: A meta-analysis of cohort studies. Int J Cardiol. 2014;176(3):1044–1047. - PubMed
    1. Pigeon WR, Pinquart M, Conner K. Meta-analysis of sleep disturbance and suicidal thoughts and behaviors. J Clin Psychiatry. 2012;73(9):e1160–e1167. - PubMed

LinkOut - more resources