

Single-cell transcriptomic landscape of immunometabolism reveals intervention candidates of ascorbate and aldarate metabolism, fatty-acid degradation and PUFA metabolism of T-cell subsets in healthy controls, psoriasis and psoriatic arthritis
- PMID: 37492568
- PMCID: PMC10363747
- DOI: 10.3389/fimmu.2023.1179877
Single-cell transcriptomic landscape of immunometabolism reveals intervention candidates of ascorbate and aldarate metabolism, fatty-acid degradation and PUFA metabolism of T-cell subsets in healthy controls, psoriasis and psoriatic arthritis
Abstract
Introduction: The modulation of immunometabolic pathways is emerging as a promising therapeutic target for immune-mediated diseases. However, the immunometabolic features of psoriatic disease and the potential targets for immunometabolic intervention in the different T-cell subsets involved in its pathogenesis remain unclear.
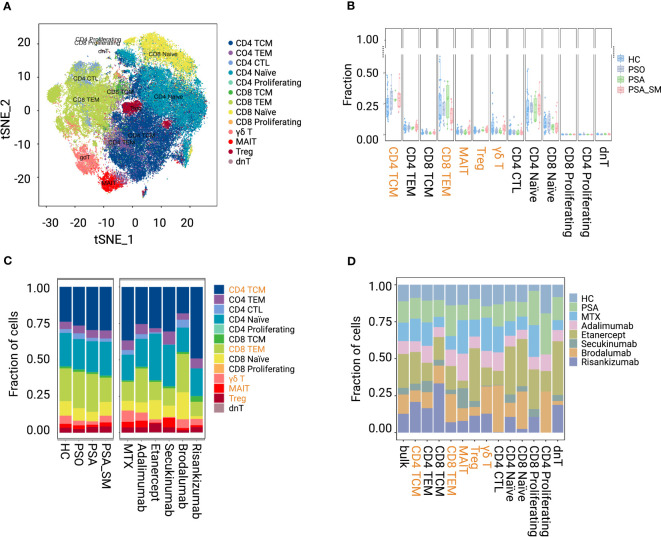
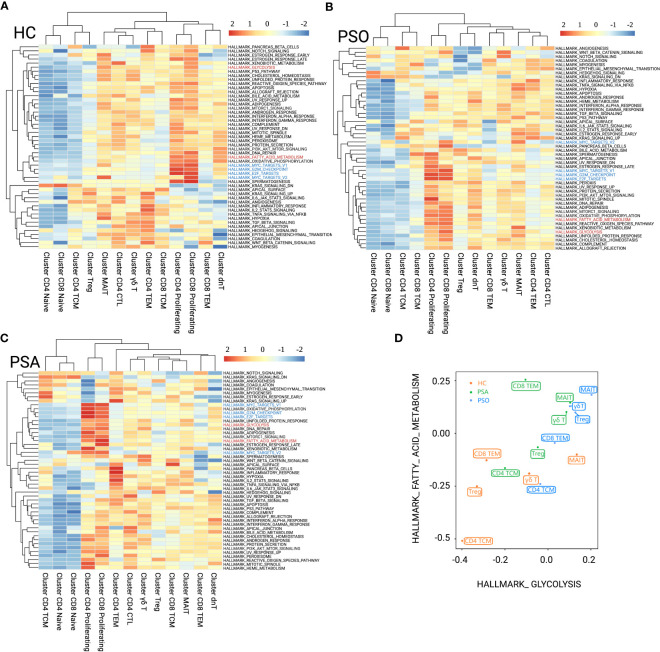
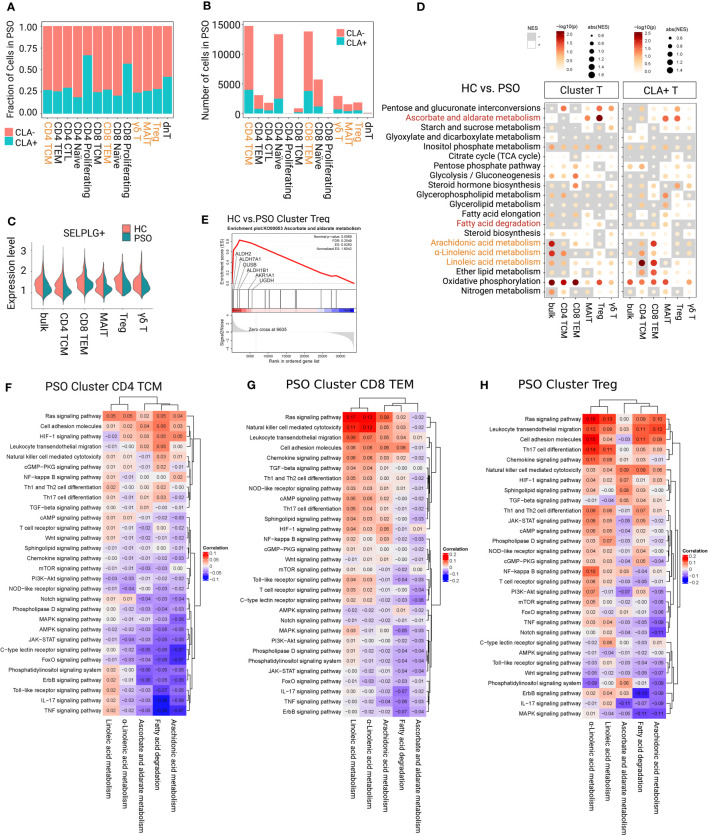
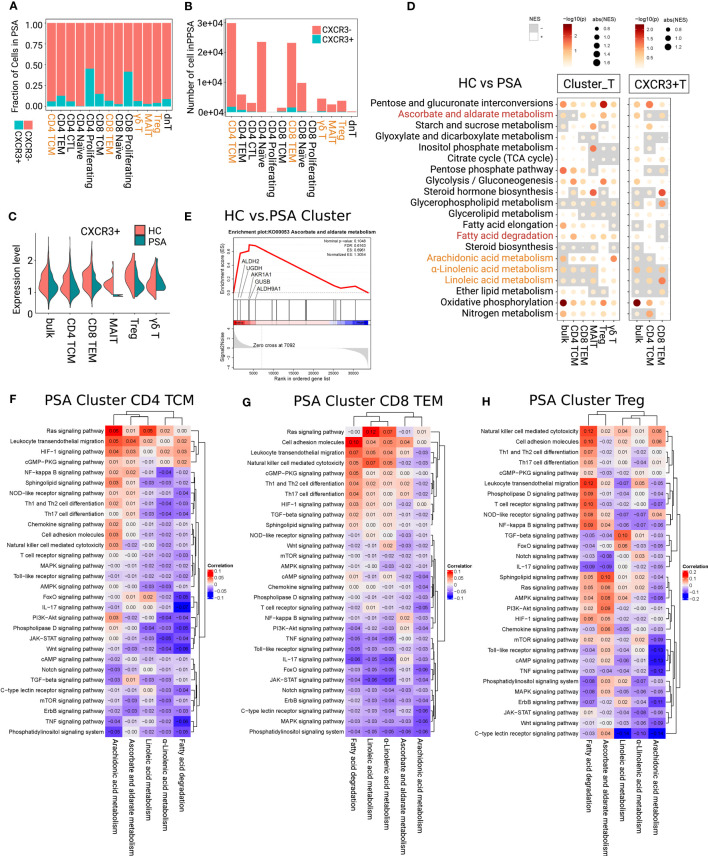
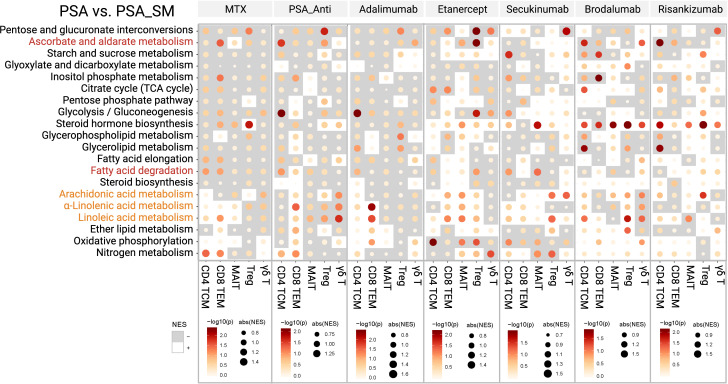
Methods: In this study, we analyzed circulating blood single-cell data from healthy controls (HC), psoriasis (PSO), and psoriatic arthritis (PSA) patients, and revealed their metabolic features of T-cell subsets: CD4+ central memory T cells (TCMs), CD8+ effective memory T cells (TEMs), regulatory T cells (Tregs), mucosal-associated invariant T cells (MAITs ), and γδ T cells. Pearson test was performed to determine the linkages between differential metabolic and inflammatory pathways. Based on these results, we also analyzed the potential impacts of biological antibodies on differential metabolic pathways by comparing the immunometabolism differences between PSA patients without and with biological treatment.
Results: Our results suggest that upregulation of ascorbate and aldarate metabolism, as well as fatty acid degradation, may enhance the immune suppression of Tregs. Enhanced metabolism of alpha-linolenic acid, linoleic acid, and arachidonic acid may inhibit the pro-inflammatory functions of CD4+ TCMs and CD8+ TEMs in PSO and PSA, and protect the immune suppression of Tregs in PSA. We propose that supporting ascorbic acid and fatty acid metabolic pathways may be an adjunctive reprogramming strategy with adalimumab and etanercept therapy.
Discussion: These findings not only provide insights into immunometabolism characteristics of psoriatic disease, but also offer preliminary options for the auxiliary treatment of psoriasis.
Keywords: TCM; TEM; Treg; immunometabolism; psoriasis; psoriatic arthritis; single-cell transcriptomics.
Copyright © 2023 Peng, Chen, Wan, Liu, Lou and Shen.
Conflict of interest statement
The authors declare that the research was conducted in the absence of any commercial or financial relationships that could be construed as a potential conflict of interest.
Figures
Similar articles
-
Blood-Based Immune Profiling Combined with Machine Learning Discriminates Psoriatic Arthritis from Psoriasis Patients.Int J Mol Sci. 2021 Oct 12;22(20):10990. doi: 10.3390/ijms222010990. Int J Mol Sci. 2021. PMID: 34681660 Free PMC article.
-
Tissue-Resident Memory CD8+ T Cells From Skin Differentiate Psoriatic Arthritis From Psoriasis.Arthritis Rheumatol. 2021 Jul;73(7):1220-1232. doi: 10.1002/art.41652. Epub 2021 May 25. Arthritis Rheumatol. 2021. PMID: 33452865 Free PMC article.
-
Comparison and subsets analysis of peripheral CD4+T cells in patients with psoriasis and psoriatic arthritis.Mol Immunol. 2023 Nov;163:174-180. doi: 10.1016/j.molimm.2023.10.002. Epub 2023 Oct 7. Mol Immunol. 2023. PMID: 37812989
-
From PsO to PsA: the role of TRM and Tregs in psoriatic disease, a systematic review of the literature.Front Med (Lausanne). 2024 Feb 9;11:1346757. doi: 10.3389/fmed.2024.1346757. eCollection 2024. Front Med (Lausanne). 2024. PMID: 38405187 Free PMC article. Review.
-
New insights into the role of T cells in pathogenesis of psoriasis and psoriatic arthritis.Autoimmunity. 2016 Nov;49(7):435-450. doi: 10.3109/08916934.2016.1166214. Epub 2016 Apr 6. Autoimmunity. 2016. PMID: 27050731 Review.
Cited by
-
Linoleic acid improves rosacea through repairing mitochondrial damage in keratinocytes.Life Med. 2025 Feb 23;4(2):lnaf005. doi: 10.1093/lifemedi/lnaf005. eCollection 2025 Apr. Life Med. 2025. PMID: 40191007 Free PMC article.
-
Maternal Undernutrition Affects Fetal Thymus DNA Methylation, Gene Expression, and, Thereby, Metabolism and Immunopoiesis in Wagyu (Japanese Black) Cattle.Int J Mol Sci. 2024 Aug 26;25(17):9242. doi: 10.3390/ijms25179242. Int J Mol Sci. 2024. PMID: 39273192 Free PMC article.
-
Lacticaseibacillus rhamnosus GG-driven remodeling of arginine metabolism mitigates gut barrier dysfunction.Am J Physiol Gastrointest Liver Physiol. 2025 Jul 1;329(1):G162-G185. doi: 10.1152/ajpgi.00366.2024. Epub 2025 May 26. Am J Physiol Gastrointest Liver Physiol. 2025. PMID: 40418622 Free PMC article.
-
Metabolic characteristics of ischaemic preconditioning induced performance improvement in Taekwondo athletes using LC‒MS/MS-based plasma metabolomics.Sci Rep. 2024 Oct 19;14(1):24609. doi: 10.1038/s41598-024-76045-1. Sci Rep. 2024. PMID: 39427043 Free PMC article.
-
A Pathologically Friendly Strategy for Determining the Organ-specific Spatial Tumor Microenvironment Topology in Lung Adenocarcinoma Through the Integration of snRandom-seq and Imaging Mass Cytometry.Adv Sci (Weinh). 2024 Jul;11(26):e2308892. doi: 10.1002/advs.202308892. Epub 2024 Apr 29. Adv Sci (Weinh). 2024. PMID: 38682485 Free PMC article.
References
Publication types
MeSH terms
Substances
LinkOut - more resources
Full Text Sources
Medical
Research Materials
Miscellaneous