. 2023 Jul 10:14:1187196.
doi: 10.3389/fimmu.2023.1187196. eCollection 2023.

Glucocorticoid dysfunction in children with severe malaria

Affiliations

Glucocorticoid dysfunction in children with severe malaria

Leen Vandermosten et al. Front Immunol. .

Abstract

Introduction: Malaria remains a widespread health problem with a huge burden. Severe or complicated malaria is highly lethal and encompasses a variety of pathological processes, including immune activation, inflammation, and dysmetabolism. Previously, we showed that adrenal hormones, in particular glucocorticoids (GCs), play critical roles to maintain disease tolerance during Plasmodium infection in mice. Here, GC responses were studied in Cameroon in children with uncomplicated malaria (UM), severe malaria (SM) and asymptomatic controls (AC).

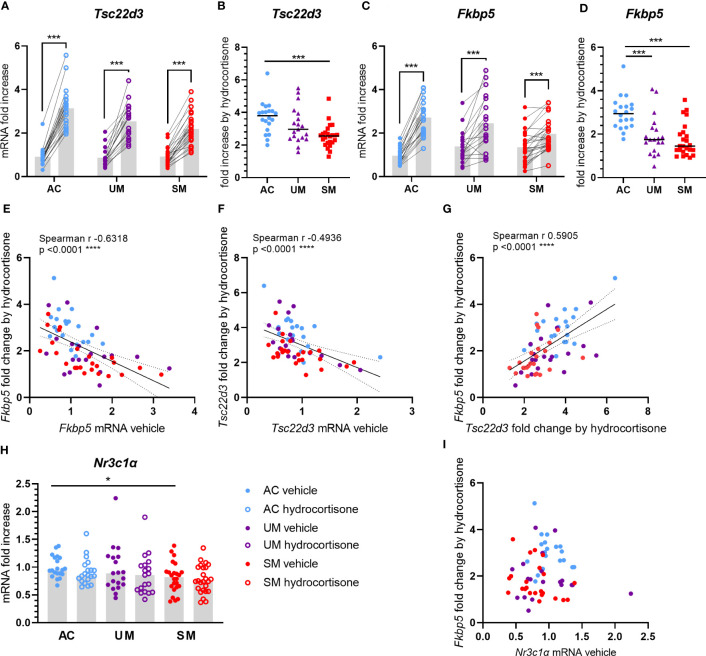
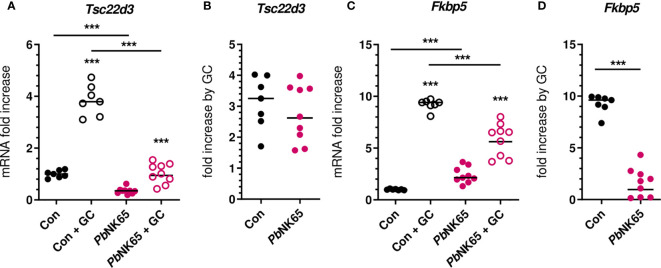
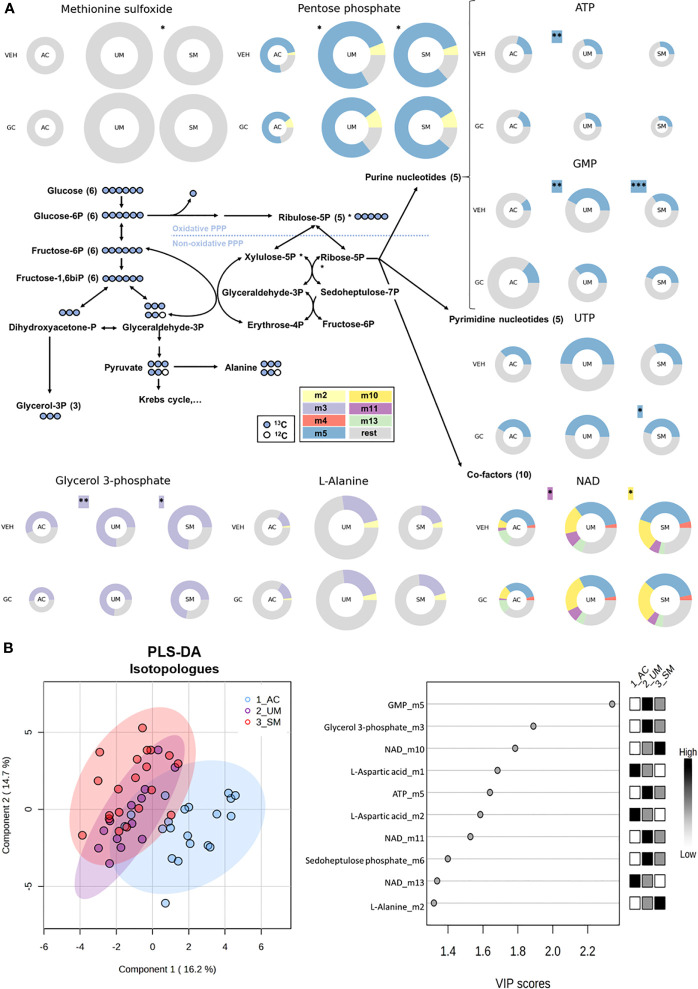
Methods: To determine the sensitivity of leukocytes to GC signaling on a transcriptional level, we measured the ex vivo induction of glucocorticoid induced leucine zipper (GILZ) and FK506-binding protein 5 (FKBP5) by GCs in human and murine leukocytes. Targeted tracer metabolomics on peripheral blood mononuclear cells (PBMCs) was performed to detect metabolic changes induced by GCs.

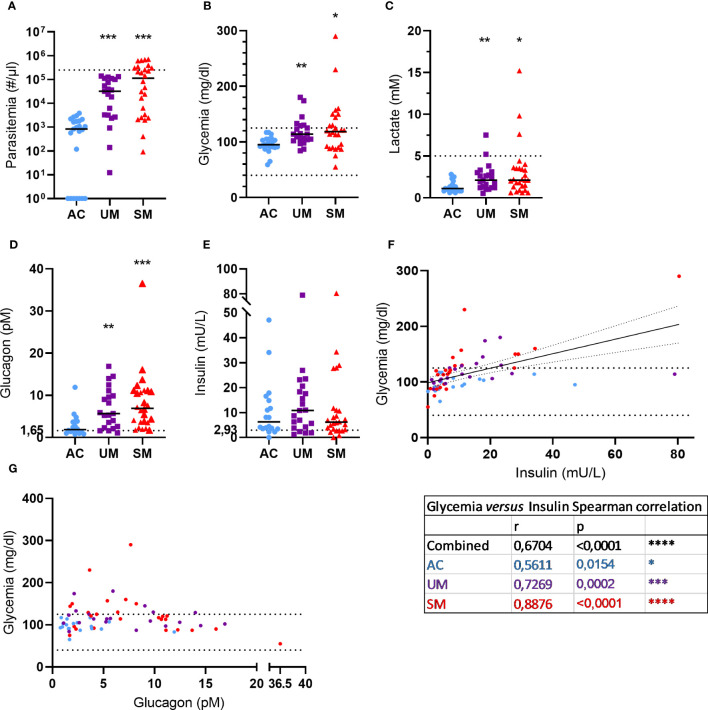
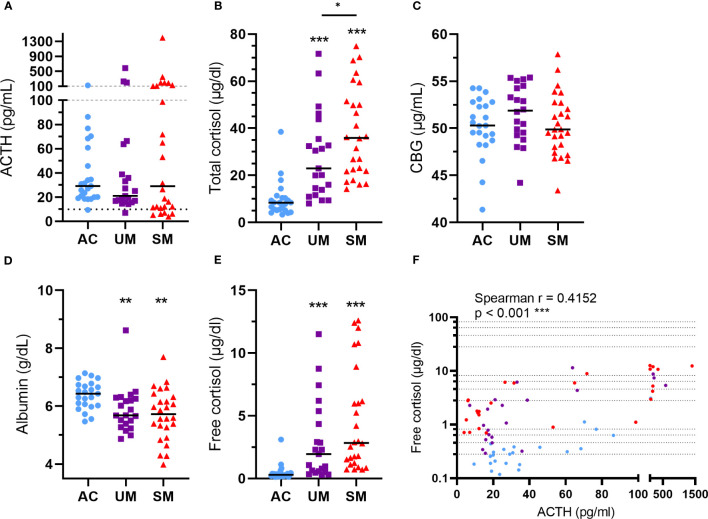
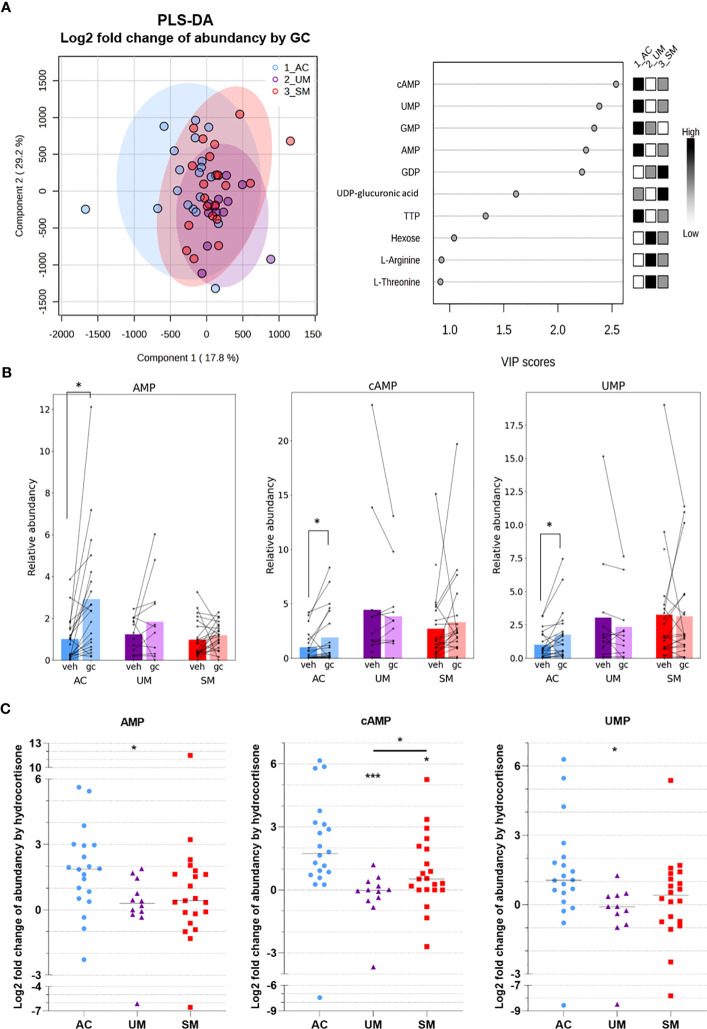
Results: Total cortisol levels increased in patients with clinical malaria compared to AC and were higher in the SM versus UM group, while cortisol binding globulin levels were unchanged and adrenocorticotropic hormone (ACTH) levels were heterogeneous. Induction of both GILZ and FKBP5 by GCs was significantly reduced in patients with clinical malaria compared to AC and in malaria-infected mice compared to uninfected controls. Increased activity in the pentose phosphate pathway was found in the patients, but this was not affected by ex vivo stimulation with physiological levels of hydrocortisone. Interestingly, hydrocortisone induced increased levels of cAMP in AC, but not in clinical malaria patients.

Discussion: Altogether, this study shows that patients with SM have increased cortisol levels, but also a decreased sensitivity to GCs, which may clearly contribute to the severity of disease.

Keywords: cortisol; glucocorticoids; malaria; metabolomics; plasmodium.


Conflict of interest statement

The authors declare that the research was conducted in the absence of any commercial or financial relationships that could be construed as a potential conflict of interest.

Figures

Figure 1
Figure 1
Blood and plasma analytes. (A) Parasite levels were microscopically determined on thick smears and calculated using the concentration of white blood cells in the blood that was determined. The dotted line represents the hyperparasitemia threshold of 250,000 par/µl. (B, C) Glucose and lactate levels were measured in whole blood. The dotted lines show the hypo- and/or hyper- thresholds. (D, E) Plasma glucagon and insulin levels. Dotted lines represent the limits of detection. (F, G) Correlation between insulin or glucagon levels and glycemia. Spearman r- and p-values are shown. (A, G) Each symbol represents data from an individual. (A, E) Horizontal lines in between data points represent group medians and analysis was by Mann-Whitney U-test. Asterisks above individual data sets indicate statistical differences compared to the AC group. Only significant differences are indicated. * p<0.05, ** p<0.01, *** p<0.001, **** p<0.0001. AC n=23 (A-C) n=18 (D-G); UM n=21; SM n=26.
Figure 2
Figure 2
Increased monocytes and activation of PBMC subsets in patients with malaria. PBMCs were isolated and flow cytometry was performed on fresh cells. (A) Percentages of different cell subsets in the AC, UM and SM group. (B-D) Percentage of monocyte subsets relative to the total number of monocytes. (E-I) Median fluorescence intensity (MFI) of CD69 on the respective cell subsets. (B-I) Each symbol represents data from an individual. Horizontal lines in between data points represent group medians and analysis was by Mann-Whitney U-test. Asterisks above individual data sets indicate statistical differences compared to the AC group. * p<0.05, ** p<0.01, *** p<0.001. NK, Natural Killer; CL mono, classical monocyte; Int mono, Intermediate monocyte; NC mono, Non-classical monocyte. Only significant differences are indicated. AC n=13; UM n=16; SM n=14. For CD4+ T cells (A) UM n=15; SM n=13 and for CD8+ T cells (A, G) UM n=15 SM n=11.
Figure 3
Figure 3
Alterations in HPA axis hormones and proteins. Plasma concentrations of ACTH (A), total cortisol (B), CBG (C), albumin (D) and free cortisol (E). (A) The dotted line represents the threshold for low ACTH levels of 10 pg/ml. (A-F) Each symbol represents data from an individual. (A-E) Horizontal lines in between data points represent group medians and analysis was by Mann-Whitney U-test. Asterisks above individual data sets indicate statistical differences compared to the AC group. Horizontal lines with asterisks on top indicate the levels of statistical significance between the indicated groups.* p<0.05, ** p<0.01, *** p<0.001. (F) Correlation between free cortisol and ACTH. Spearman r- and p-values are shown. Only significant differences are indicated. AC n=23; UM n=21; SM n=26.
Figure 4
Figure 4
Induction of GILZ and FKBP5 transcripts by hydrocortisone is reduced in PBMCs from patients. PBMCs were isolated and incubated for 2 hours with vehicle or 150 nM hydrocortisone. mRNA was extracted and levels of Tsc22d3 (GILZ), Fkbp5 and Nr3c1α (GRα) were measured by qRT-PCR. (A, C) The mRNA fold increase was calculated compared to the mean of the AC vehicle group and the paired effect of the hydrocortisone versus vehicle condition was analyzed for the controls and patients. (B, D) Fold increase by hydrocortisone defined by the ratio of the mRNA fold increase of the hydrocortisone condition over the vehicle condition. (E-G, I) Correlation analyses by Spearman test. (H) mRNA fold increase compared to the AC vehicle group. (A-I) Each symbol represents data from an individual. Analysis was by Mann-Whitney U-test or Wilcoxon test for the paired data. Only significant differences are indicated. * p<0.05, *** p<0.001, **** p<0.0001. AC n=20; UM n=19; SM n=24.
Figure 5
Figure 5
Malaria infection in mice causes reduced corticosterone sensitivity of splenocytes. Splenocytes were isolated from spleens of non-infected control (Con) C57Bl/6J mice and Plasmodium berghei NK65 (PbNK65)-infected C57Bl/6J mice (day 9 post-infection) and stimulated for 2 hours without or with 400 nM of corticosterone (GC). mRNA levels of Tsc22d3 (GILZ) and Fkbp5 were measured by qRT-PCR. (A, C) mRNA fold increase compared to the Con group. (B, D) Fold increase by GC defined by the ratio of the mRNA fold increase of the GC condition over the untreated condition. The data originates from two separate experiments. Each symbol represents data from an individual mouse. Horizontal lines in between data points represent group medians. Analysis was by Mann-Whitney U-test. Horizontal lines with asterisks on top indicate the levels of statistical significance between the indicated groups. Asterisks above individual data sets indicate the levels of statistical significance compared to the unstimulated group. Only significant differences are indicated. *** p<0.001. Con n=7; PbNK65 n=9.
Figure 6
Figure 6
The pentose phosphate pathway is enhanced in PBMCs from patients with malaria. PBMCs were isolated and incubated for 24 hours with [U-13C]-glucose tracer and vehicle (VEH) or 150 nM hydrocortisone (GC). Metabolic extracts were analyzed via mass spectrometry. (A) Schematic visualization of the pentose phosphate pathway with donut plots of selected metabolites. The size of the donuts represents the average relative abundancy compared to the AC VEH condition. The average relative contribution of an isotopologue is represented by the different colors as defined in the legend. The rest fraction contains the unlabeled and rare isotopologue (<2%) fractions. Analysis was done by t-test for UM and SM versus AC as indicated with asterisks next to the donuts on the VEH row. A paired t-test for the GC effects in AC, UM and SM is indicated with asterisks next to the donuts on the GC row. Non-highlighted asterisks represent effects in abundancies. Highlighted asterisks correspond with effects in specific isotopologues. Only significant differences are indicated. (B) PLS-DA was performed to separate AC, UM and SM based on 41 corrected isotopologues from VEH-incubated PBMCs. PLS-DA: Partial Least Squares Method-Discriminant Analysis; PPP, pentose phosphate pathway; VIP, Variable Importance in Projection. * p<0.05; ** p<0.01; *** p<0.001. Abundancies: AC n=20; UM n=14 (12 paired); SM n=22 veh (21 paired). Isotopologues: AC n=20; UM n=13 (11 paired); SM n=20 (18 paired).
Figure 7
Figure 7
GC-mediated induction of cAMP and AMP is reduced in PBMCs from patients with malaria. PBMCs were isolated and incubated for 24 hours with [U-13C]-glucose tracer and vehicle (VEH) or 150 nM hydrocortisone (GC). Metabolic extracts were analyzed via mass spectrometry. (A) GC-induced Log2 fold changes in abundancies of 47 metabolites were analyzed by PLS-DA. (B) Analysis of the GC versus VEH condition for the relative abundancy of AMP, cAMP and UMP by paired t-test. (C) Log2 fold increase of abundancy by hydrocortisone. Comparison between groups by Mann-Whitney U-test. Each symbol represents data from an individual. Bars in (B) represent the mean, lines in (C) represent the median. Asterisks above individual data sets indicate statistical differences compared to the AC group. Only significant differences are indicated. PLS-DA, Partial Least Squares Method-Discriminant Analysis; VIP, Variable Importance in Projection. AC n=20; UM n=11-12; SM n=20-21. * p<0.05, *** p<0.001.

Similar articles

Cited by

References

    1. WHO World malaria report 2022 Available at: http://www.who.int/malaria/en/
    1. Deroost K, Pham TT, Opdenakker G, Van den Steen PE. The immunological balance between host and parasite in malaria. FEMS Microbiol Rev (2016) 40(2):208–57. doi: 10.1093/femsre/fuv046 - DOI - PubMed
    1. Possemiers H, Vandermosten L, Van den Steen PE. Etiology of lactic acidosis in malaria. PloS Pathog (2021) 17(1):e1009122. doi: 10.1371/journal.ppat.1009122 - DOI - PMC - PubMed
    1. Davis TM, Li TA, Tran QB, Robertson K, Dyer JR, Phan TD, et al. . The hypothalamic-Pituitary-Adrenocortical axis in severe falciparum malaria: effects of cytokines. J Clin Endocrinol Metab (1997) 82(9):3029–33. doi: 10.1210/jcem.82.9.4196 - DOI - PubMed
    1. Enwonwu CO, Afolabi BM, Salako LA, Idigbe EO, al-Hassan H, Rabiu RA. Hyperphenylalaninaemia in children with falciparum malaria. QJM monthly J Assoc Physicians (1999) 92(9):495–503. doi: 10.1093/qjmed/92.9.495 - DOI - PubMed

Publication types