. 2023 Sep;96(1149):20230110.
doi: 10.1259/bjr.20230110. Epub 2023 Jul 26.

Clinical benefit of range uncertainty reduction in proton treatment planning based on dual-energy CT for neuro-oncological patients

Affiliations

Clinical benefit of range uncertainty reduction in proton treatment planning based on dual-energy CT for neuro-oncological patients

Vicki Trier Taasti et al. Br J Radiol. 2023 Sep.

Abstract

Objective: Several studies have shown that dual-energy CT (DECT) can lead to improved accuracy for proton range estimation. This study investigated the clinical benefit of reduced range uncertainty, enabled by DECT, in robust optimisation for neuro-oncological patients.

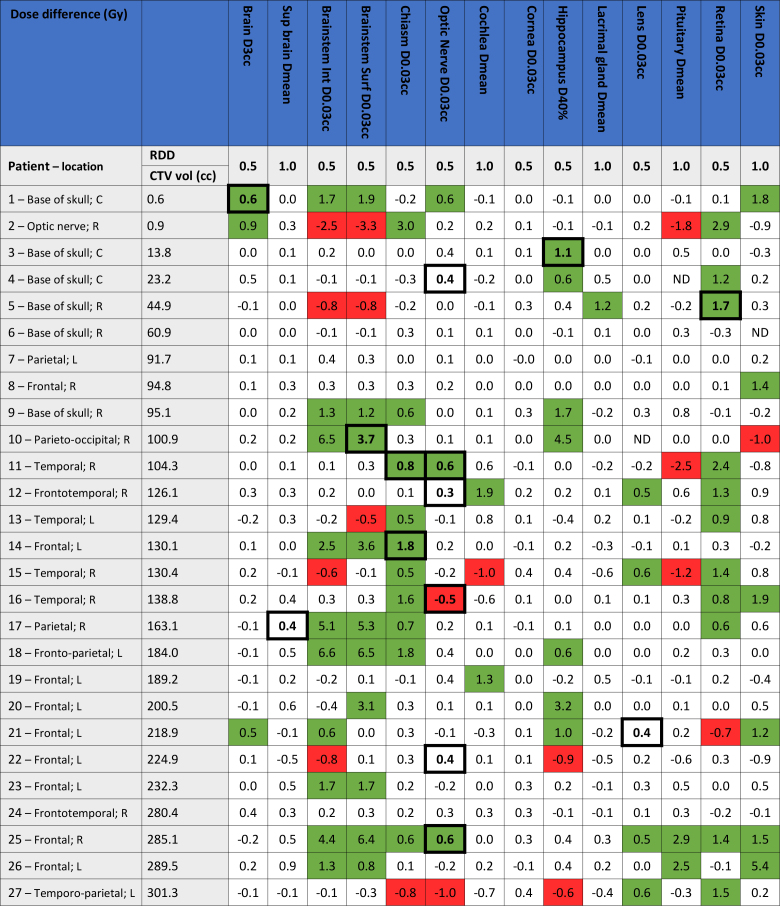
Methods: DECT scans for 27 neuro-oncological patients were included. Commercial software was applied to create stopping-power ratio (SPR) maps based on the DECT scan. Two plans were robustly optimised on the SPR map, keeping the beam and plan settings identical to the clinical plan. One plan was robustly optimised and evaluated with a range uncertainty of 3% (as used clinically; denoted 3%-plan); the second plan applied a range uncertainty of 2% (2%-plan). Both plans were clinical acceptable and optimal. The dose-volume histogram parameters were compared between the two plans. Two experienced neuro-radiation oncologists determined the relevant dose difference for each organ-at-risk (OAR). Moreover, the OAR toxicity levels were assessed.

Results: For 24 patients, a dose reduction >0.5/1 Gy (relevant dose difference depending on the OAR) was seen in one or more OARs for the 2%-plan; e.g. for brainstem D0.03cc in 10 patients, and hippocampus D40% in 6 patients. Furthermore, 12 patients had a reduction in toxicity level for one or two OARs, showing a clear benefit for the patient.

Conclusion: Robust optimisation with reduced range uncertainty allows for reduction of OAR toxicity, providing a rationale for clinical implementation. Based on these results, we have clinically introduced DECT-based proton treatment planning for neuro-oncological patients, accompanied with a reduced range uncertainty of 2%.

Advances in knowledge: This study shows the clinical benefit of range uncertainty reduction from 3% to 2% in robustly optimised proton plans. A dose reduction to one or more OARs was seen for 89% of the patients, and 44% of the patients had an expected toxicity level decrease.


Figures

Figure 1.
Figure 1.
Dose differences in units of Gy, given as the dose-volume histogram (DVH) parameter for the 3%-plan minus the DVH parameter for the 2%-plan, whereby positive values indicate a benefit of the 2%-plan. The tumour location is denoted after the patient number (L: left, R: right, C: central), and the patients are sorted based on the volume of the clinical target volume (CTV). Dose differences larger than the clinically relevant dose difference (RDD; 0.5 Gy or 1.0 Gy) are marked in green (benefit of the 2%-plan) or red (disadvantage of the 2%-plan). The dose differences corresponding to a toxicity level decrease or increase are highlighted in bold and have a thick border (see details in Table 2). Abbreviations: Sup brain – Supratentorial brain minus CTV; Brainstem Int and Surf – Brainstem Interior and Surface (2 mm margin); ND – not delineated.
Figure 2.
Figure 2.
Boxplots for target conformity index (CI) and dose-volume histogram (DVH) parameters extracted from the 3%-plan (blue) and the 2%-plan (green) over all patients. The CI is calculated based on the D98% for the clinical target volume (CTV) extracted from the voxel-wise minimum dose distribution (VWmin). The DVH parameters are extracted from the total dose, with prescription doses ranging from 50.4 to 59.4 Gy. The second subplot shows the target coverage, quantified by the CTV V94% extracted from VWmin; here the horizontal line at 98% denotes the minimum dose constraint. The maximum CTV dose, quantified by D0.03cc, is scaled to the prescription dose and extracted from VWmax. The fourth boxplot shows the V95% for a 5 mm ring structure surrounding the CTV extracted from VWmax. The fifth and sixth subplots show the mean dose to the combined hippocampus structure excluding the CTV, and the D40% for the one hippocampus structure receiving the highest dose in the 3%-plan, both extracted from the nominal dose distribution. For all boxplots, the box covers the 25%- to 75%-percentile, while outliers beyond 1.5 times the interquartile range outside the box are marked with crosses.
Figure 3.
Figure 3.
(Top) Dose distributions for patient 25 for the 3%-plan and the 2%-plan, as well as the dose difference (2%-plan minus 3% plan). The colour bar to the left of the 3%-plan is for both the 3%-plan and the 2%-plan. (Middle) Dose-volume histogram (DVH) curves for Patient 25 for the 2%-plan (full lines) and the 3%-plan (dashed lines) for organs-at-risk with large dose differences as well as for the clinical target volume (CTV). (Bottom) Dose difference for Patient 26 (coronal view) and for Patient 18. For Patient 26, large dose differences are seen all around the CTV (dark blue contour). For Patient 18, a large dose difference is seen in the brainstem (purple contour).

References

    1. Schaub L, Harrabi SB, Debus J. Particle therapy in the future of precision therapy. Br J Radiol 2020; 93(): 20200183. doi: 10.1259/bjr.20200183 - DOI - PMC - PubMed
    1. Schneider U, Pedroni E, Lomax A. The calibration of CT Hounsfield units for radiotherapy treatment planning. Phys Med Biol 1996; 41: 111–24. doi: 10.1088/0031-9155/41/1/009 - DOI - PubMed
    1. Peters N, Trier Taasti V, Ackermann B, Bolsi A, Vallhagen Dahlgren C, Ellerbrock M, et al. . Consensus guide on CT-based prediction of stopping-power ratio using a Hounsfield look-up table for proton therapy. Radiother Oncol 2023; 184: 109675. doi: 10.1016/j.radonc.2023.109675 - DOI - PMC - PubMed
    1. Yang M, Zhu XR, Park PC, Titt U, Mohan R, Virshup G, et al. . Comprehensive analysis of proton range uncertainties related to patient stopping-power-ratio estimation using the stoichiometric calibration. Phys Med Biol 2012; 57: 4095–4115. doi: 10.1088/0031-9155/57/13/4095 - DOI - PMC - PubMed
    1. Lomax AJ. Myths and realities of range uncertainty. Br J Radiol 2020; 93(): 20190582. doi: 10.1259/bjr.20190582 - DOI - PMC - PubMed