. 2023 Sep;10(27):e2301940.
doi: 10.1002/advs.202301940. Epub 2023 Jul 26.

NLRP14 Safeguards Calcium Homeostasis via Regulating the K27 Ubiquitination of Nclx in Oocyte-to-Embryo Transition

Affiliations

NLRP14 Safeguards Calcium Homeostasis via Regulating the K27 Ubiquitination of Nclx in Oocyte-to-Embryo Transition

Tie-Gang Meng et al. Adv Sci (Weinh). 2023 Sep.

Abstract

Sperm-induced Ca2+ rise is critical for driving oocyte activation and subsequent embryonic development, but little is known about how lasting Ca2+ oscillations are regulated. Here it is shown that NLRP14, a maternal effect factor, is essential for keeping Ca2+ oscillations and early embryonic development. Few embryos lacking maternal NLRP14 can develop beyond the 2-cell stage. The impaired developmental potential of Nlrp14-deficient oocytes is mainly caused by disrupted cytoplasmic function and calcium homeostasis due to altered mitochondrial distribution, morphology, and activity since the calcium oscillations and development of Nlrp14-deficient oocytes can be rescued by substitution of whole cytoplasm by spindle transfer. Proteomics analysis reveal that cytoplasmic UHRF1 (ubiquitin-like, containing PHD and RING finger domains 1) is significantly decreased in Nlrp14-deficient oocytes, and Uhrf1-deficient oocytes also show disrupted calcium homeostasis and developmental arrest. Strikingly, it is found that the mitochondrial Na+ /Ca2+ exchanger (NCLX) encoded by Slc8b1 is significantly decreased in the Nlrp14mNull oocyte. Mechanistically, NLRP14 interacts with the NCLX intrinsically disordered regions (IDRs) domain and maintain its stability by regulating the K27-linked ubiquitination. Thus, the study reveals NLRP14 as a crucial player in calcium homeostasis that is important for early embryonic development.

Keywords: NCLX; NLRP14; UHRF1; adenosine triphosphate (ATP); calcium homeostasis; early embryonic development; maternal effect genes; mitochondria.


Conflict of interest statement

The authors declare no conflict of interest.

Figures

Figure 1
Figure 1
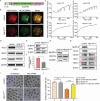
Developmental expression of NLRP14 in mouse. A) Western blot analysis showed that NLRP14 is only expressed in the ovaries rather than other tissues including heart, liver, kidney, thymus, and uterus in female mice. B) Western blot showed that NLRP14 was only expressed in oocytes rather than in granulosa cells (GCs). C) The expression pattern of NLRP14 during oocyte maturation. D) The expression pattern of NLRP14 during early embryonic development. E) Establishment of Nlrp14‐3xflag knock‐in mouse model, the tags including 3xflag were inserted before stop codon of Nlrp14 CDS using Crispr/Cas9. F) Representative images of subcellular localization of NLRP14 during oocyte maturation and early embryonic development. The oocytes and embryos, derived from Nlrp14‐3xflag knock‐in female mice, were immunolabeled with FLAG antibody (pink) and counterstained with DAPI (blue). Scale bar, 20 µm.
Figure 2
Figure 2
Nlrp14 is a maternal effect gene required for early embryonic development in mice. A,B) Establishment of Nlrp14 knockout mouse model carrying frameshift mutations (inserted two nucleotides in exon3). C) Western blot analysis of protein level in Nlrp14+/− and Nlrp14−/− oocytes. Level of β‐actin was used as an internal control. D) Breeding assays showed complete infertility of the Nlrp14−/− female mice. Continuous breeding assessment showed the cumulative number of progeny per female Nlrp14+/− and Nlrp14−/− mouse for 6 months. At least six mice of each genotype were used. Data are the mean ± SEM (n = 6). E) Representative uterus and number of implantation sites at E6.5 in Nlrp14+/− and Nlrp14−/− mice. F) Both Nlrp14+/− and Nlrp14−/− female mice underwent natural ovulation after mating with WT male mice; embryo development was examined in the uterus at day E3.5. G) Representative images of embryos from Nlrp14+/− and Nlrp14−/− females cultured in KSOM medium at Day 2, Day 3, Day 4, and Day 5, respectively. Scale bar, 100 µm.
Figure 3
Figure 3
Maternal NLRP14 and UHRF1 form heteromeric complexes A) Schematic of MII oocytes collection and timTOF Pro MS analysis. MS samples from three independent experiments were used for Mass spectrometry analysis. B) Significantly upregulated (red) and downregulated (blue) proteins in Nlrp14mNull oocytes. C) Immunoblotting analyses of the control and Nlrp14mNull MII oocytes were performed using antibodies against the indicated proteins. D) The signal of UHRF1 in control and Nlrp14mNull oocytes. Scale bar, 20 µm. E) Average expression of Uhrf1 mRNA during oocyte maturation and early embryonic development. Analysis is based on our RNA‐seq data. Data are the mean ± SEM (n = 3). F) Schematic of immunoprecipitation coupled Mass Spectrometry analysis for NLRP14 interacting proteins. IP samples from three independent experiments were used for Mass spectrometry analysis. G) Venn diagram depicting common proteins identified from down‐regulated proteins in Nlrp14mNull oocytes and NLRP14 interacting proteins. H) Interaction between NLRP14 and UHRF1 was confirmed by immunoprecipitation. HA‐tag, HA‐tagged mouse UHRF1 and myc‐tagged mouse NLRP14 were expressed in HEK293T cells as indicated for 48 h, and then Co‐IP (HA‐MYC) and Western blot analysis for UHRF1 and NLRP14. I) Immunoblotting analyses of the control and Nlrp14mNull MII oocytes were performed using antibodies against the indicated proteins. J) The signal of UHRF1 in control, Nlrp14mNull and Nlrp14mNull;StellamNull oocytes, respectively. Scale bar, 20 µm.
Figure 4
Figure 4
Ablation of maternal NLRP14 caused the failure of the [Ca2+]i induced by parthenogenetic activation. A) A schematic illustration of the spindle transfer assay between control and Nlrp14mNull MII oocytes. WT indicates control (Nlrp14+/− ), KO indicates Nlrp14mNull , PA indicates parthenogenetic activation. The hybrid oocytes produced by spindle exchange were parthenogenetically activated in an activation medium for 6 h, then cultured in KSOM. Representative images of parthenogenetically activated embryos with the indicated genotypes at day 2, day 3, and day 5. B) Bar charts showing percentages of parthenogenetic activation with indicated genotypes and treatments. Data are the mean ± SEM (n = 3). ***p <0.001. C) control and Nlrp14mNull MII oocytes were parthenogenetically activated in an activation medium for 6 h, then cultured in KSOM. Representative images of parthenogenetic activated embryos with the indicated genotypes at day 1 and day 2, respectively. Red arrowheads show visible pronuclei. D) Representative images of immunostaining for DNA (blue) and α‐tubulin (green) showing the MII exit and pronuclei formation in the parthenogenetic‐activated embryos. Scale bar, 20 µm. E) Bar charts showing percentages of parthenogenetic activation with indicated genotypes. ***p <0.001. F) Fluo‐4‐AM staining of oocytes showed the intracellular Ca2+ concentration dynamics at different stages of two continuous [Ca2+]i oscillations during PA. The oocytes are indicated with genotypes. Scale bar, 20 µm. G) [Ca2+]i oscillation patterns after parthenogenetic activation of oocytes indicated with genotypes, respectively. H, Western blot analysis of the energy sensor AMPK using the indicated antibodies in control and Nlrp14mNull oocytes. AMPK is composed of three subunits, the α subunit has catalytic activity (including two or three isoforms (α1 and α2)), its Thr172 phosphorylation is the target for regulating the catalytic activity of the enzyme, while the β and γ subunits are regulatory subunits. The experiment was repeated three times independently.
Figure 5
Figure 5
Abnormal mitochondrial morphology and mitochondrial activity in Nlrp14mNull oocytes. A) ERs and mitochondria were labeled with ER‐Tracker (blue) and MitoTracker (red) in control and Nlrp14mNull oocytes. Scale bar, 20 µm. B) Electron micrographs of 6‐week‐old control and Nlrp14mNull oocytes. White arrows indicate the mitochondria in oocytes with the indicated genotypes. Scale bar, 500 nm. C) Distribution of mitochondria with high membrane potential (red) and low membrane potential (green) in oocytes with the indicated genotypes, respectively. Scale bar, 20 µm. D) Representative images of ROS fluorescence of MII oocytes with the indicated genotypes, respectively. Images were analyzed by confocal microscopy with identical fluorescence parameters. Scale bar, 20 µm. E), Relative fluorescence intensity of ratio of red/green fluorescence analysis for each oocyte was conducted using Image J software. Significant difference between control and Nlrp14mNull oocytes was observed. Data are expressed as mean±SEM of at least three independent experiments. **p <0.01. Data are the mean ± SEM (n = 20). F) Quantitative analysis of ROS fluorescence intensity. The fluorescence intensity analysis for each oocyte was conducted using Image J software. Data are expressed as mean±SEM of at least three independent experiments. ***p <0.001. Data are the mean ± SEM (n = 20). G) The adenosine triphosphate (ATP) content of mouse oocytes with the indicated genotypes, respectively. Data are the mean ± SEM (n = 60). ATP was measured using a Berthold Lumat LB 9501 luminometer and a commercial assay kit. Data are expressed as mean±SEM of at least three independent experiments. **p <0.01. H, mtDNA copy numbers of MII oocytes in all three groups were analyzed by RT‐qPCR. Data from more than 20 MII oocytes were analyzed for each group. Data are expressed as mean±SEM of at least three independent experiments (n = 3). n.s. represents the non‐significant difference.
Figure 6
Figure 6
UHRF1 is essential for maintaining calcium homeostasis in oocytes. A) Distribution of mitochondria with high membrane potential (red) and low membrane potential (green) in oocytes with the indicated genotypes, respectively. Scale bar, 20 µm. B) Relative fluorescence intensity of ratio of red/green fluorescence analysis for each oocyte was conducted using Image J software. Significant difference between control and Uhrf1fl/△;SKO oocytes was observed. Data are expressed asmean±SEM of at least three independent experiments (n = 3). **p <0.001. C) The adenosine triphosphate (ATP) content of mouse oocytes with the indicated genotypes, respectively. ATP was measured using a Berthold Lumat LB 9501 luminometer and a commercial assay kit. Data are expressed as mean±SEM of at least three independent experiments(n = 3). **p <0.01. D) [Ca2+]i oscillation patterns after parthenogenetic activation of oocytes with indicated genotypes, respectively. E) control and Uhrf1fl/△;SKO MII oocytes were parthenogenetically activated in an activation medium for 6 h, then cultured in KSOM. Representative images of parthenogenetic activated embryos with the indicated genotypes at day 2, respectively.
Figure 7
Figure 7
Maternal NLRP14 mainly affected Ca2+ homeostasis by regulating the stability of NCLX in mouse oocytes. A) Schematic representation of Mt‐GCaMP6s. Ca2+ sensors GCaMP6s were fused with mitochondrial localization signal peptide under the control of T7 promoter. B) Representative images of control and Nlrp14mNull MII oocytes, which were microinjected with Mt‐GCaMP6s mRNA (green) and labeled with MitoTracker (red). Mt‐GCaMP6s was colocalized with MitoTracker. Scale bar, 20 µm. C) [Ca2+]m oscillation patterns after parthenogenetic activation of MII oocytes with indicated genotypes, respectively. D) Capillary‐based immunoassays for indicated proteins in oocytes with indicated genotypes, respectively. Loading control, GAPDH. E) Immunoblotting analyses of the control and Nlrp14mNull MII oocytes were performed using antibodies against the indicated proteins. F) Bar charts showing level of DRP1 in MII oocytes with indicated genotypes. G) Mitochondrial content was evaluated by COX IV. Western blots showing similar mitochondrial components between control and Nlrp14mNull MII oocytes. H) Immunoblotting analyses of the control and Nlrp14mNull MII oocytes were performed using antibodies against the indicated proteins. I) Both control and Nlrp14mNull MII oocytes were microinjected with Nclx mRNA, respectively. After culturing for 2 h, these oocytes were parthenogenetically activated in an activation medium for 6 h, then cultured in KSOM. Representative images of parthenogenetic activated embryos with indicated genotypes at day 2, respectively. Scale bar, 100 µm. J), Bar charts showing percentages of parthenogenetic‐activated embryonic mortality with indicated genotypes and treatments. Data are the mean ± SEM (n = 3).
Figure 8
Figure 8
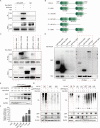
NLRP14 maintained the stability of NCLX by regulating its K27 ubiquitination. A) Interaction between NLRP14 and NCLX was confirmed by immunoprecipitation. myc‐tag, myc‐tagged mouse NCLX, and GFP‐tagged mouse NLRP14 were expressed in HEK293T cells as indicated for 48 h, and then co‐IP (myc‐GFP) and Western blot analysis for NCLX and NLRP14. B) Schematic of mouse NCLX truncation mutants. C) Interaction between NLRP14 and truncated NCLX was confirmed by immunoprecipitation. GFP‐tagged truncated mouse NCLX and myc‐tagged mouse NLRP14 were expressed in HEK293T cells as indicated for 48 h, and then co‐IP and Western blot analysis for NCLX and NLRP14. D. Interaction between NLRP14 and NCLX‐IDR was confirmed by immunoprecipitation. GFP‐tagged mouse NCLX‐IDR and myc‐tagged mouse NLRP14 were expressed in HEK293T cells as indicated for 48 h, and then co‐IP and Western blot analysis for NCLX and NLRP14. E. GFP‐tagged mouse NLRP14 and myc‐tagged mouse NCLX were expressed in HEK293T cells as indicated for 48 h. The amount of GFP‐tagged mouse NLRP14 plasmid is gradient increased as indicated. F. qRT–PCR showing the relative levels of Nclx transcripts in GV oocytes, MII oocytes, and zygotes. G. GFP‐tagged mouse NLRP14, myc‐tagged mouse NCLX and HA‐tagged ubiquitin or ubiquitin mutants were expressed in HEK293T as indicated for 48 h, and then co‐IP and western blot analysis for the ubiquitination of myc‐tagged mouse NCLX.

References

    1. Brower P. T., Gizang E., Boreen S. M., Schultz R. M., Developmental Biology 1981, 86, 373. - PubMed
    1. a) Tong Z.‐B., Gold L., Pfeifer K. E., Dorward H., Lee E., Bondy C. A., Dean J., Nelson L. M., Nat. Genet. 2000, 26, 267; - PubMed
    2. b) Esposito G., Vitale A. M., Leijten F. P., Strik A. M., Koonen‐Reemst A. M., Yurttas P., Robben T. J., Coonrod S., Gossen J. A., Mol. Cell. Endocrinol. 2007, 273, 25; - PubMed
    3. c) Payer B., Saitou M., Barton S. C., Thresher R., Dixon J. P., Zahn D., Colledge W. H., Carlton M. B., Nakano T., Surani M. A., Curr Biol 2003, 13, 2110. - PubMed
    1. a) Hamatani T., Falco G., Carter M. G., Akutsu H., Stagg C. A., Sharov A. A., Dudekula D. B., VanBuren V., Ko M. S. H., Hum. Mol. Genet. 2004, 13, 2263; - PubMed
    2. b) Sharov A. A., Falco G., Piao Y., Poosala S., Becker K. G., Zonderman A. B., Longo D. L., Schlessinger D., Ko M., BMC Biol. 2008, 6, 24. - PMC - PubMed
    1. Tattoli I., Carneiro L. A., Jehanno M., Magalhaes J. G., Shu Y., Philpott D. J., Arnoult D., Girardin S. E., EMBO Rep. 2008, 9, 293. - PMC - PubMed
    1. a) Larman M. G., Saunders C. M., Carroll J., Lai F. A., Swann K., J. Cell Sci. 2004, 117, 2513; - PubMed
    2. b) Halet G., Tunwell R., Parkinson S. J., Carroll J., J. Cell Biol. 2004, 164, 1033. - PMC - PubMed

Publication types