. 2023 Dec;91(12):1571-1599.
doi: 10.1002/prot.26545. Epub 2023 Jul 26.

Protein target highlights in CASP15: Analysis of models by structure providers

Affiliations

Protein target highlights in CASP15: Analysis of models by structure providers

Leila T Alexander et al. Proteins. 2023 Dec.

Abstract

We present an in-depth analysis of selected CASP15 targets, focusing on their biological and functional significance. The authors of the structures identify and discuss key protein features and evaluate how effectively these aspects were captured in the submitted predictions. While the overall ability to predict three-dimensional protein structures continues to impress, reproducing uncommon features not previously observed in experimental structures is still a challenge. Furthermore, instances with conformational flexibility and large multimeric complexes highlight the need for novel scoring strategies to better emphasize biologically relevant structural regions. Looking ahead, closer integration of computational and experimental techniques will play a key role in determining the next challenges to be unraveled in the field of structural molecular biology.

Keywords: CASP; X-ray crystallography; cryo-EM; protein structure prediction.


Figures

FIGURE 1
FIGURE 1
Structure of A. aeolicus TsaB. (A) The overlaid crystal structures of E. coli TsaB (PDB: 4YDU), T. maritima TsaB (PDB: 6N9A), S. typhimurium TsaB (PDB: 3ZET), P. s aeruginosa (PDB: 5BR9) and V. parahaemolyticus (PDB: 3R6M), and AlphaFold model (Entry: A0A7C5Q8I2, colored in blue). (B) Crystal structure of A. aeolicus TsaD–TsaB complex (PDB: 8IEY) with top‐scoring model (T1183TS462_1‐D1, colored in pink) of CASP 15 overlaid onto the TsaB (colored in blue).
FIGURE 2
FIGURE 2
(A) Solution NMR structure of TotA, rainbow‐colored from N‐terminus (blue) to C‐terminus (red) superimposed onto the model ranked best according to GDT‐TS (gray). (B) Surface representation of the core protein colored by residue type (gray for hydrophobic amino acids, green for all others), and the flexible loop containing the Turandot motif shown as cartoons and sticks in magenta.
FIGURE 3
FIGURE 3
(A) View of the MfnG dimer showing the intertwining of the N‐terminal domain in dimerization along with the binding sites for the L‐Tyr and SAH. (B) Polder omits map for the Tyr (mFo‐DFc, in green contoured at +3 RMSD) with the 2mFo‐DFc omit map (in blue contoured at 1.6 RMSD) in the region of the ligands after soaking with l‐Tyr. (C) Superposition of the top quartile (rank 1–29) model 1 prediction color ramped by predicted percentage confidence estimates (with assigned scores below 60 in red and above 90 in blue) with the 7ux8 chain A structure in pink. Two residue ranges (91–103 and 144–156) that have higher B‐factors and more conformational variability across multiple crystal forms are circled. The confidence scores are lower and predictions are more varied in these regions of observed conformational variability. The N‐ (1–8) and C‐termini (364–384) are omitted for clarity. (D) Superposition of the MfnG crystal structure (7ux8, gray with water molecules near the Tyr shown in red) and the predicted structure for group 119, Kiharalab, model 1 (green), Tyr‐004 pose 2 (lilac) and SAH‐001 pose 1 (cyan). The ligand as well as the surrounding side chain atoms are in close agreement (lDDT‐PLI scores of 0.86 and 0.85 and RMSD of 0.75 and 0.89 for Tyr and SAH, respectively).
FIGURE 4
FIGURE 4
(A) Experimental cryo‐EM structure of Mycobacterium smegmatis Mce1 complex. Proteins are shown as cartoon cylinders and are colored by subunits according to the legend. (B) Gallery of the top five predicted structures showing the region containing the portal, needle, and ring: cryo‐EM structure (gray), H1137TS397_1 (light red), H1137TS439_5 (green), H1137TS239_1 (cyan), H1137TS239_5 (slate), and H1137TS035_2 (pink). Field of view indicated by eye‐diagram inset. (C–F) Structural alignment of the top five predicted structures with the cryo‐EM structure based on (C) portal, (D) ring, (E) ABC transporter, and (F) needle (aligned to N‐terminal end). Structures are colored according to the legend in (C). Field of view indicated by eye‐diagram inset.
FIGURE 5
FIGURE 5
Superposition of the crystal structure of the DHQD‐SK fusion enzyme (thick ribbon, DHQD red, SK blue) and the 20 best first models (thin ribbons), which are marked in the GDT plot in the inset. The largest differences between the models and the crystal structure is found in the SK domain, which is not surprising as this domain is known to undergo larger conformational changes upon substrate binding. Nevertheless, the prediction of the inter‐domain interface closely resembles the crystal structure. As can be seen in the plot, the other models deviated often strongly in the relative positioning of the two enzymatic domains. The active site of the DHQD is at the center of the barrel, the one of the SK is marked by a phosphate molecule that co‐crystallized with the protein.
FIGURE 6
FIGURE 6
Crystal structure of Bd1399. (A) Left—Single chain of the Bd1399 elongated β‐sandwich with disulfides shown as spheres. Two orientations are shown 90° rotated. Right—The dimer observed in the asymmetric unit of the crystal. (B) Top—The Bd1399 dimer (light green and light blue) shows the continuous face and broken face with intercalated ethylene glycol (blue). (C) Two other Bdellovibrio bacteriovorus DUF4360 proteins Bd2850 and Bd2851, shown in the same orientation as Bd1399 in (A). Both proteins contain the elongated β‐sandwich and conserved disulfides observed in Bd1399. (D) Top—superimposed Bd1399 crystal structure (light blue) and the T1994TS498 CASP prediction (magenta). The two models show striking similarity. Bottom: Regions of Bd1399 that differ from the CASP prediction, show unpredicted sidechain interactions and P99‐Q100 cis‐peptide.
FIGURE 7
FIGURE 7
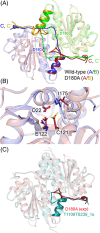
(A) The X‐ray crystal structure of the wild‐type RsICH dimer (protomer A shown in blue, and protomer B shown in green) superimposed with D180A (protomer A shown in red, and protomer B shown orange). The D180A mutation results in a reorganization of the C‐terminal region at the dimer interface (solid colors). (B) The D180A mutant (red) has different conformations of active site residues compared to the wild type (blue). The cysteine thiol of C121 faces E122 in the wild‐type structure but populates a different rotamer that faces I175 in the mutant structure. (C) Predicted model T1109TS239_1o of the D180A mutant structure (teal) reproduces the reorganization of the C‐terminal region observed in the D180A crystal structure (red).
FIGURE 8
FIGURE 8
(A) Overlay on FhuA of the top 43 predictions (based on the global QS scores and the three established categories of structures) of the FhuA‐RBPpb5 complex, colored by prediction confidence (plDDT) and including the signal sequence. (B) Superposition of the predicted FhuA structures with the experimental FhuA structure in a complex with TonB (PDB 2GRX, cyan, TonB is not depicted). The signal peptide has been removed. (C) Periplasmic surface view of FhuA. Top panel: the top 42 predicted structures superimposed on Ferrichrome‐bound FhuA (PDB 1BY5, light green). Bottom panel: prediction 119_1/131_4 superimposed on free‐FhuA (PDB 1QFG, salmon) and FhuA from the target (PDB 8B14, yellow). Red star: first resolved N‐terminus of the different structures (Q18 or E19). The 1–17 residues of the predictions have been removed. (D) Superposition of the predicted structures, colored by plDDT scores, on the target RBPpb5 (PDB 8B14, pink), based on the three established categories of structures. (E) FhuA–RBPpb5 interface of the best prediction form each of the best four groups compared to that of the target. The black arrows point to areas of the interface that have fewer contacts in the predictions than in the target. (F) Superposition of the predictions presented in panel E on FhuA target (same color code as E), zoomed in on the FhuA–RBPpb5 interaction interface, the detergent molecule that is resolved in our structure is shown in red sticks. The residues involved in the interaction with the detergent molecule in the target are shown as sticks.
FIGURE 9
FIGURE 9
Comparison of the experimental structure of Huc with the best‐scored CASP15 model. (A) The cryoEM structure of a HucS2L2 lobe from the Huc complex. One HucS subunit is colored yellow, and one HucL subunit is colored red. [3Fe4S] clusters are shown as yellow and orange spheres, the Ni ion from the NiFe active site is shown as a green sphere, and an Mg ion is shown as a lime sphere. (B) The cryoEM structure of the Huc complex. One HucSL dimer and co‐factors are colored as in panel a. One HucM molecule is colored blue, and the others are colored green. (C) Yang group computational model 1 (H1114TS439_1) of a HucS2L2 lobe, colored as in panel A. (D) The H1114TS439_1 model of the Huc complex, colored as in panel B. (E and G) Zoomed views of the HucS2L2‐HucM interface of the cryoEM structure, and (F and H) the H1114TS439_1 model of Huc.
FIGURE 10
FIGURE 10
(A and B) CtEDEM GH47 domain and CtPDI. Two views (related by a rotation of 90 degrees around the horizontal axis) of the superposition of the 2.7 Å cryo‐EM structure and the closest CASP15 model (RMSD = 2.7 Å over 1122 residues). The CtEDEM GH47 domain and CtPDI are in cartoon representation and colored from blue to red from N‐ to C‐terminus. The two interchain disulfide bridges are in magenta spheres. (C) The CtEDEM IMD:GH47 interface: overlay of the 2.7 Å cryo‐EM structure (cyan C atoms) with the closest CASP15 model (green C atoms, RMSD = 4.4 Å over 33 residues). IMD residues 774–786 (top) and GH47 residues 436–455 (bottom) in cartoon representation. Three pairs of residues interacting across the interface in the experimental structure (but not in the model) are shown in stick representation, with the distances between their side chains marked by dotted lines: E778:E441, E779:R442, and E781:H437.
FIGURE 11
FIGURE 11
(A,B) Crystal structure of SUN1‐KASH6 exhibiting a “trimer‐of‐trimers” arrangement. (A) KASH6 peptides are represented as cartoons and SUN domains as surfaces and white cartoons in the zoomed panel. (B) The N‐termini of KASH peptides are oriented towards the upper portion of the molecular surface, and at the interface, the KASH peptides together with their KASH‐lids form an extended β‐sheet structure (1–6 in the zoomed panel). (C) Superposition of the three SUN1 protomers from the same trimer of the structure, highlighting the spatial arrangement of the KASH‐lids. (D) KASH peptide from the model H1135TS054_3 (in green) superposed to the crystal structure (with crystal KASH peptide shown in red) (E) The KASH peptide from the model H1135TS444_5 is shown in purple, indicating its inverted orientation compared to the crystal structure peptide (in red), where the N‐terminus of the modeled KASH peptide is incorrectly facing downwards. (F) Model H1135TS086_1 displays a disconnected trimer‐of‐trimers interface, with one of the KASH6 peptides inverted and SUN1 trimers positioned in proximity but with no interface area.
FIGURE 12
FIGURE 12
The complex between the CNPase catalytic domain and nanobody 8C. (A) Crystal structure of the complex between the CNPase catalytic domain (surface and rainbow colors) and Nb8C (gray, with the CDR3 loop in purple). (B) Close‐up view of the CDR3 loop, indicating a helical segment held in place by a disulfide bridge. (C) Comparison of the crystal structure to the top three predictions based on the QS score. CNPase is in dark gray and the Nb8C in the crystal structure is in light gray. To the right, a comparison of the CDR3 loop conformation is seen. (D) Comparison of the crystal structure to the top three predictions based on the TMscore. The color coding for (C) and (D) is shown to the right.
FIGURE 13
FIGURE 13
Comparison of the experimental structure and the predicted model T1122TS270_1. Helical regions whose positions were accurately predicted are colored (green, pink, yellow, cyan, and blue). Helix α10 (in blue) was split in the predicted models and is highlighted in the dashed orange box. The N‐terminal region that was not correctly predicted is highlighted in red.
FIGURE 14
FIGURE 14
Crystal structure versus CASP15 predictions for target T1176. (A) Overview of the octameric structure of T1176 (CD630_25440). Each chain is shown in a different color. (B) Crystal structure of the T1176 dimer (extracted from the octamer structure), one monomer is shown in black, and the second is colored from blue at the N‐terminus to beige at the C‐terminus. (C) Superposition of the best CASP15 prediction for the T1176 monomer structure (red) versus the crystal structure (gray). The location of a strand that should be flipped out into an adjacent monomer is highlighted with an arrow. (D) As in panel C, with the top five nonredundant CASP15 structure predictions shown in colors ranging from red to purple (in descending order by TM score). (E) Superposition of the best CASP15 structure prediction for the T1176 dimer (red), compared with the crystal structure (gray). The location of an inter‐monomer strand transfer is indicated by the arrow, and is present in the crystal structure but not the predicted structure. (F) As in panel E, showing the top five nonredundant CASP15 predictions. (G) Overview of the top structure prediction for the T1176 octamer (red), versus the crystal structure (gray). Two representative monomers are shown below; one (on the left) with a fairly good superposition in the overall aligned octamer structure, and one (on the right) where the predicted location in the predicted structure differs substantially from the crystal structure.
FIGURE 15
FIGURE 15
Comparison of CASP15 predictions of mosquito SGS1 with the experimental structure. (A) SGS1 domain diagram. Residue numbers at the domain boundaries are indicated. The putative aspartyl protease cleavage site is shown as dashed line with scissors. β‐propeller 1 (orange), β‐propeller 2 (cyan), Rhs/YD‐repeats (dodger blue), CBM (carbohydrate‐binding module, lime green), lectin‐CRD (lectin carbohydrate‐recognition domain, purple), wedge domain (hot pink), TM (putative transmembrane helices, red), and Tox‐SGS (salivary gland secreted protein domain toxin, gray). (B) Atomic model of SGS1 derived from cryo‐EM, shown in cartoon representation and colored as in A. (C) CASP15 domain segmentation of SGS1 into D1 (orange), D2 (deep sky blue), D3 (pale turquoise), and D4 (cyan). (D–G) Structural comparison of different domains of the cryo‐EM structure of SGS1 with the predicted models: (D) β‐propeller 1; (E) transmembrane; (F) putative aspartyl protease site; and (G) the “fence” that bisects the opening of the daisy‐chained helices. For better visualization, the C‐terminal residues of SGS1 after the aspartyl protease cleavage site and β‐propeller 1 were omitted in (D) and (E), respectively; both were omitted in (G). Color scheme in (D‐G): experimental structures of SGS1 (red) and Tc toxin (pink); predicted structures T1169TS229_1 (cyan), T1169TS278_1 (gold), T1169TS204_1 (orange), T1169TS494_1 (purple), T1169TS074_1 (green).
FIGURE 16
FIGURE 16
The two left columns show overlays of the predicted 9:9:9 YscV:YscX:YscY complexes (yellow; cyan; pink) on the target structure 7QIJ (orange, blue, and red; chains A*–I*). The third column shows an overlay of the predicted YscV nonamer (yellow) on the YscV template 7ALW (orange). For SHT, the overlay was performed only on a single YscV protomer, shown here at 12 o'clock of the ring. The right column shows an overlay of the predicted 1:1:1 YscV:YscX:YscY complex (yellow; cyan; pink) on one of 18 slightly different 1:1:1 complexes of the target structure 7QIJ (orange; blue; red; chains GA, GB, GC). The structural alignment was performed on YscV only. For the predicted structures, only the region present in 7QIJ is shown.

References

    1. Kryshtafovych A, Schwede T, Topf M, Fidelis K, Moult J. Critical assessment of methods of protein structure prediction (CASP)—Round XV. Proteins. 2023;91(12):1539‐1549. doi: 10.1002/prot.26617 - DOI - PMC - PubMed
    1. Kryshtafovych A, Moult J, Bartual SG, et al. Target highlights in CASP9: experimental target structures for the critical assessment of techniques for protein structure prediction. Proteins. 2011;79(Suppl 10):6‐20. - PMC - PubMed
    1. Kryshtafovych A, Moult J, Bales P, et al. Challenging the state of the art in protein structure prediction: highlights of experimental target structures for the 10th critical assessment of techniques for protein structure prediction experiment CASP10. Proteins. 2014;82(Suppl 2):26‐42. - PMC - PubMed
    1. Kryshtafovych A, Moult J, Baslé A, et al. Some of the most interesting CASP11 targets through the eyes of their authors. Proteins. 2016;84(Suppl 1):34‐50. - PMC - PubMed
    1. Kryshtafovych A, Albrecht R, Baslé A, et al. Target highlights from the first post‐PSI CASP experiment (CASP12, may–august 2016). Proteins. 2018;86:27‐50. - PMC - PubMed