. 2023 Sep 30;13(10):jkad162.
doi: 10.1093/g3journal/jkad162.

FREQ-Seq2: a method for precise high-throughput combinatorial quantification of allele frequencies

Affiliations

FREQ-Seq2: a method for precise high-throughput combinatorial quantification of allele frequencies

Roy Zhao et al. G3 (Bethesda). .

Abstract

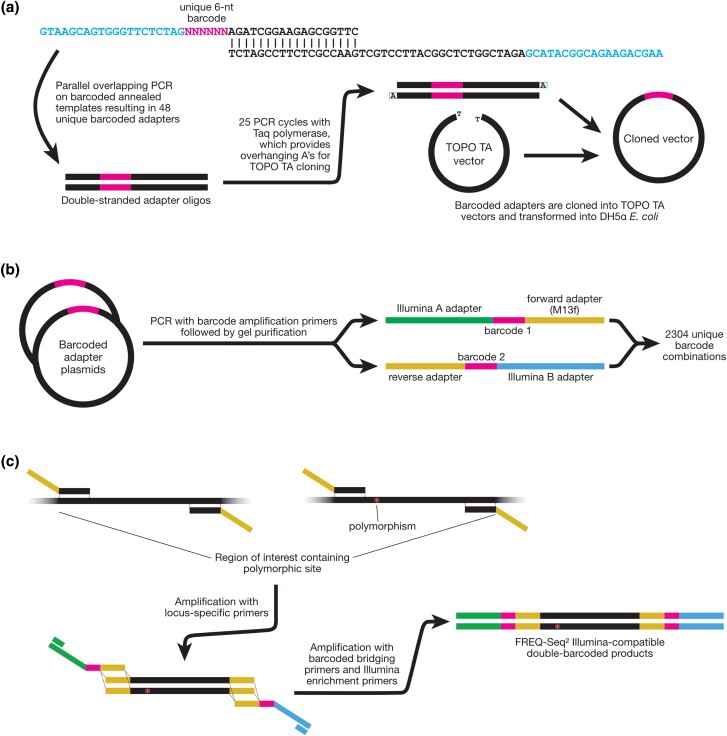
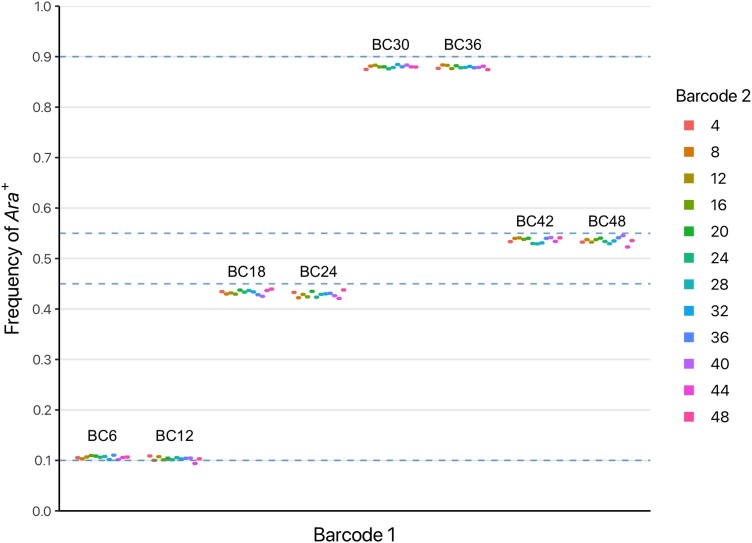
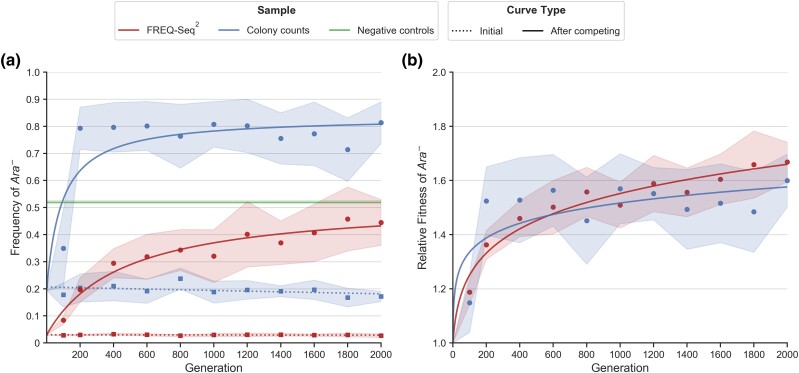
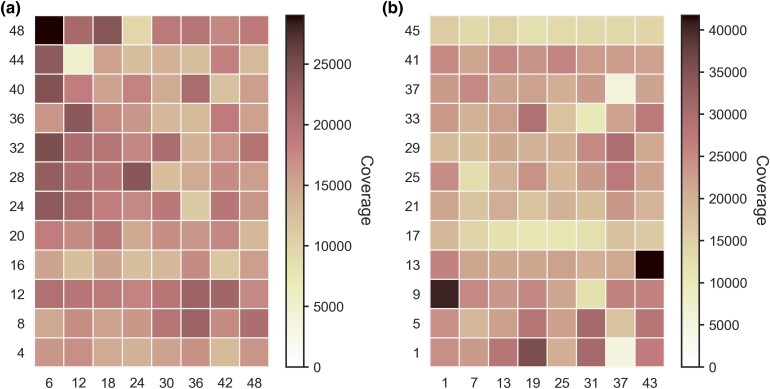
The accurate determination of allele frequencies is crucially important across a wide range of problems in genetics, such as developing population genetic models, making inferences from genome-wide association studies, determining genetic risk for diseases, as well as other scientific and medical applications. Furthermore, understanding how allele frequencies change over time in populations is central to ascertaining their evolutionary dynamics. We present a precise, efficient, and economical method (FREQ-Seq2) for quantifying the relative frequencies of different alleles at loci of interest in mixed population samples. Through the creative use of paired barcode sequences, we exponentially increased the throughput of the original FREQ-Seq method from 48 to 2,304 samples. FREQ-Seq2 can be targeted to specific genomic regions of interest, which are amplified using universal barcoded adapters to generate Illumina sequencing libraries. Our enhanced method, available as a kit along with open-source software for analyzing sequenced libraries, enables the detection and removal of errors that are undetectable in the original FREQ-Seq method as well as other conventional methods for allele frequency quantification. Finally, we validated the performance of our sequencing-based approach with a highly multiplexed set of control samples as well as a competitive evolution experiment in Escherichia coli and compare the latter to estimates derived from manual colony counting. Our analyses demonstrate that FREQ-Seq2 is flexible, inexpensive, and produces large amounts of data with low error, low noise, and desirable statistical properties. In summary, FREQ-Seq2 is a powerful method for quantifying allele frequency that provides a versatile approach for profiling mixed populations.

Keywords: allele frequency quantification; evolutionary dynamics; genomic methods; genotyping.


Conflict of interest statement

Conflicts of interest The author(s) declare no conflict of interest.

Figures

Fig. 1.
Fig. 1.
a) Protocol for generating the FREQ-Seq2 adapter library. Partially complementary single-stranded oligonucleotides containing the barcodes are annealed together, extended, and PCR amplified with primers corresponding to the regions in blue. Next, they are amplified with Taq polymerase to add overhanging adenosines, for cloning into the TOPO TA vector. After cloning into the plasmids, the vectors are transformed into competent DH5αE. coli bacteria and plated, and plasmid DNA is extracted from the transformed bacteria. b) The Illumina-compatible FREQ-Seq2 barcoded bridging primers for paired-end sequencing can be amplified from the adapter plasmids using the same amplification primers used to generate the adapter fragments. These adapters can be used in conjunction with their corresponding FREQ-Seq barcoded adapters for double-barcoded labeling of fragment mixtures. c) To generate a FREQ-Seq2 sequencing library, amplification is first performed using locus-specific primers to produce a pool of fragments in a region of interest. These fragments contain adapters on each end that are complementary to the barcoded bridging primers, enabling double-barcoded labeling. Amplification is then performed using the barcoded bridging primers and enrichment primers, resulting in Illumina-compatible double-barcoded products.
Fig. 2.
Fig. 2.
Estimated Ara+ allele frequencies using FREQ-Seq2 for 96 independent loading controls with unique barcode combinations. Dashed blue lines represent the four target allele frequencies of Ara+ that were used to benchmark the controls.
Fig. 3.
Fig. 3.
FREQ-Seq2 allele frequency and fitness trajectories over time for the evolved Ara strain. The Ara strain competed with the ancestral Ara+ strain, and their frequencies were measured at several time points over 2,000 generations. a) Ara allele frequency and b) relative fitness across eleven generations of the competition assay measured using both FREQ-Seq2 and manual colony counting. The blue and red dots represent the mean allele frequency or relative fitness at each time point. In a), the dotted lines correspond to the initial Ara frequency before the strains were conducted and the solid lines correspond to the Ara frequency after competing. The line and curves show the fit of a linear, hyperbolic, and power law model to the initial frequencies, post-competition frequencies, and fitnesses, respectively. Note that the higher magnitude of the Ara frequencies for colony counting are due to the higher initial frequencies. The green line is the mean allele frequency measured using FREQ-Seq2 for sixteen independent target 50/50 negative controls. The shaded regions represent 95% confidence intervals based on the standard error of the mean.
Fig. 4.
Fig. 4.
Sequencing read coverage measured for the FREQ-Seq2 barcode combinations used in the control and experimental samples. Different sets of 96 distinct barcode pairs were used to label the loading controls and experimental evolution samples, which are clearly identifiable by coverage from the background noise. The labels on the x-axis and y-axis show the first and second barcodes used to label each of the 96 sample barcode pairs in each heatmap for a) control samples and b) experimental evolution samples. Coverage for barcodes outside the barcode combinations used for sample labeling represents spurious signal from noise in the method or errors during preparation and sequencing.
Fig. 5.
Fig. 5.
a) Histograms comparing the coverage of properly barcoded reads to that of reads with either one or two improper barcodes for 96 unique control sample barcode combinations. The distributions of one and two spurious barcode matches represent the relative risk of misbarcoding in a FREQ-Seq2 library. b) Coverage of reads containing a valid genotype (y-axis) versus the coverage of contaminated reads containing an unrecognized allele (x-axis) among properly barcoded control sample reads for each of the 96 barcode combinations. The dashed red line is a one-to-one scaled diagonal between the axes.

References

    1. Acinas SG, Sarma-Rupavtarm R, Klepac-Ceraj V, Polz MF. PCR-induced sequence artifacts and bias: insights from comparison of two 16S rRNA clone libraries constructed from the same sample. Appl Environ Microbiol. 2005;71:8966–8969. doi:10.1128/AEM.71.12.8966-8969.2005 - DOI - PMC - PubMed
    1. Alon S, Vigneault F, Eminaga S, Christodoulou DC, Seidman JG, Church GM, Eisenberg E. Barcoding bias in high-throughput multiplex sequencing of miRNA. Genome Res. 2011;21:1506–1511. doi:10.1101/gr.121715.111 - DOI - PMC - PubMed
    1. Carlton BC, Brown BJ. Gene mutation. In: Gerhardt P, editor. Manual of Methods for General Bacteriology. Washington (DC): American Society for Microbiology; 1981. p. 222–242.
    1. Chubiz LM, Lee MC, Delaney NF, Marx CJ. FREQ-Seq: a rapid, cost-effective, sequencing-based method to determine allele frequencies directly from mixed populations. PLoS ONE. 2012;7:479–59. doi:10.1371/journal.pone.0047959 - DOI - PMC - PubMed
    1. Cleary PP, Englesberg E. Transcriptional control in the L-arabinose operon of Escherichia coli B/r. J Bacteriol. 1974;118:121–128. doi:10.1128/jb.118.1.121-128.1974 - DOI - PMC - PubMed

Publication types