

Causes of Death Among Infants and Children in the Child Health and Mortality Prevention Surveillance (CHAMPS) Network
- PMID: 37494044
- PMCID: PMC10372710
- DOI: 10.1001/jamanetworkopen.2023.22494
Causes of Death Among Infants and Children in the Child Health and Mortality Prevention Surveillance (CHAMPS) Network
Abstract
Importance: The number of deaths of children younger than 5 years has been steadily decreasing worldwide, from more than 17 million annual deaths in the 1970s to an estimated 5.3 million in 2019 (with 2.8 million deaths occurring in those aged 1-59 months [53% of all deaths in children aged <5 years]). More detailed characterization of childhood deaths could inform interventions to improve child survival.
Objective: To describe causes of postneonatal child deaths across 7 mortality surveillance sentinel sites in Africa and Asia.
Design, setting, and participants: The Child Health and Mortality Prevention Surveillance (CHAMPS) Network conducts childhood mortality surveillance in sub-Saharan Africa and South Asia using innovative postmortem minimally invasive tissue sampling (MITS). In this cross-sectional study, MITS was conducted in deceased children aged 1 to 59 months at 7 sites in sub-Saharan Africa and South Asia from December 3, 2016, to December 3, 2020. Data analysis was conducted between October and November 2021.
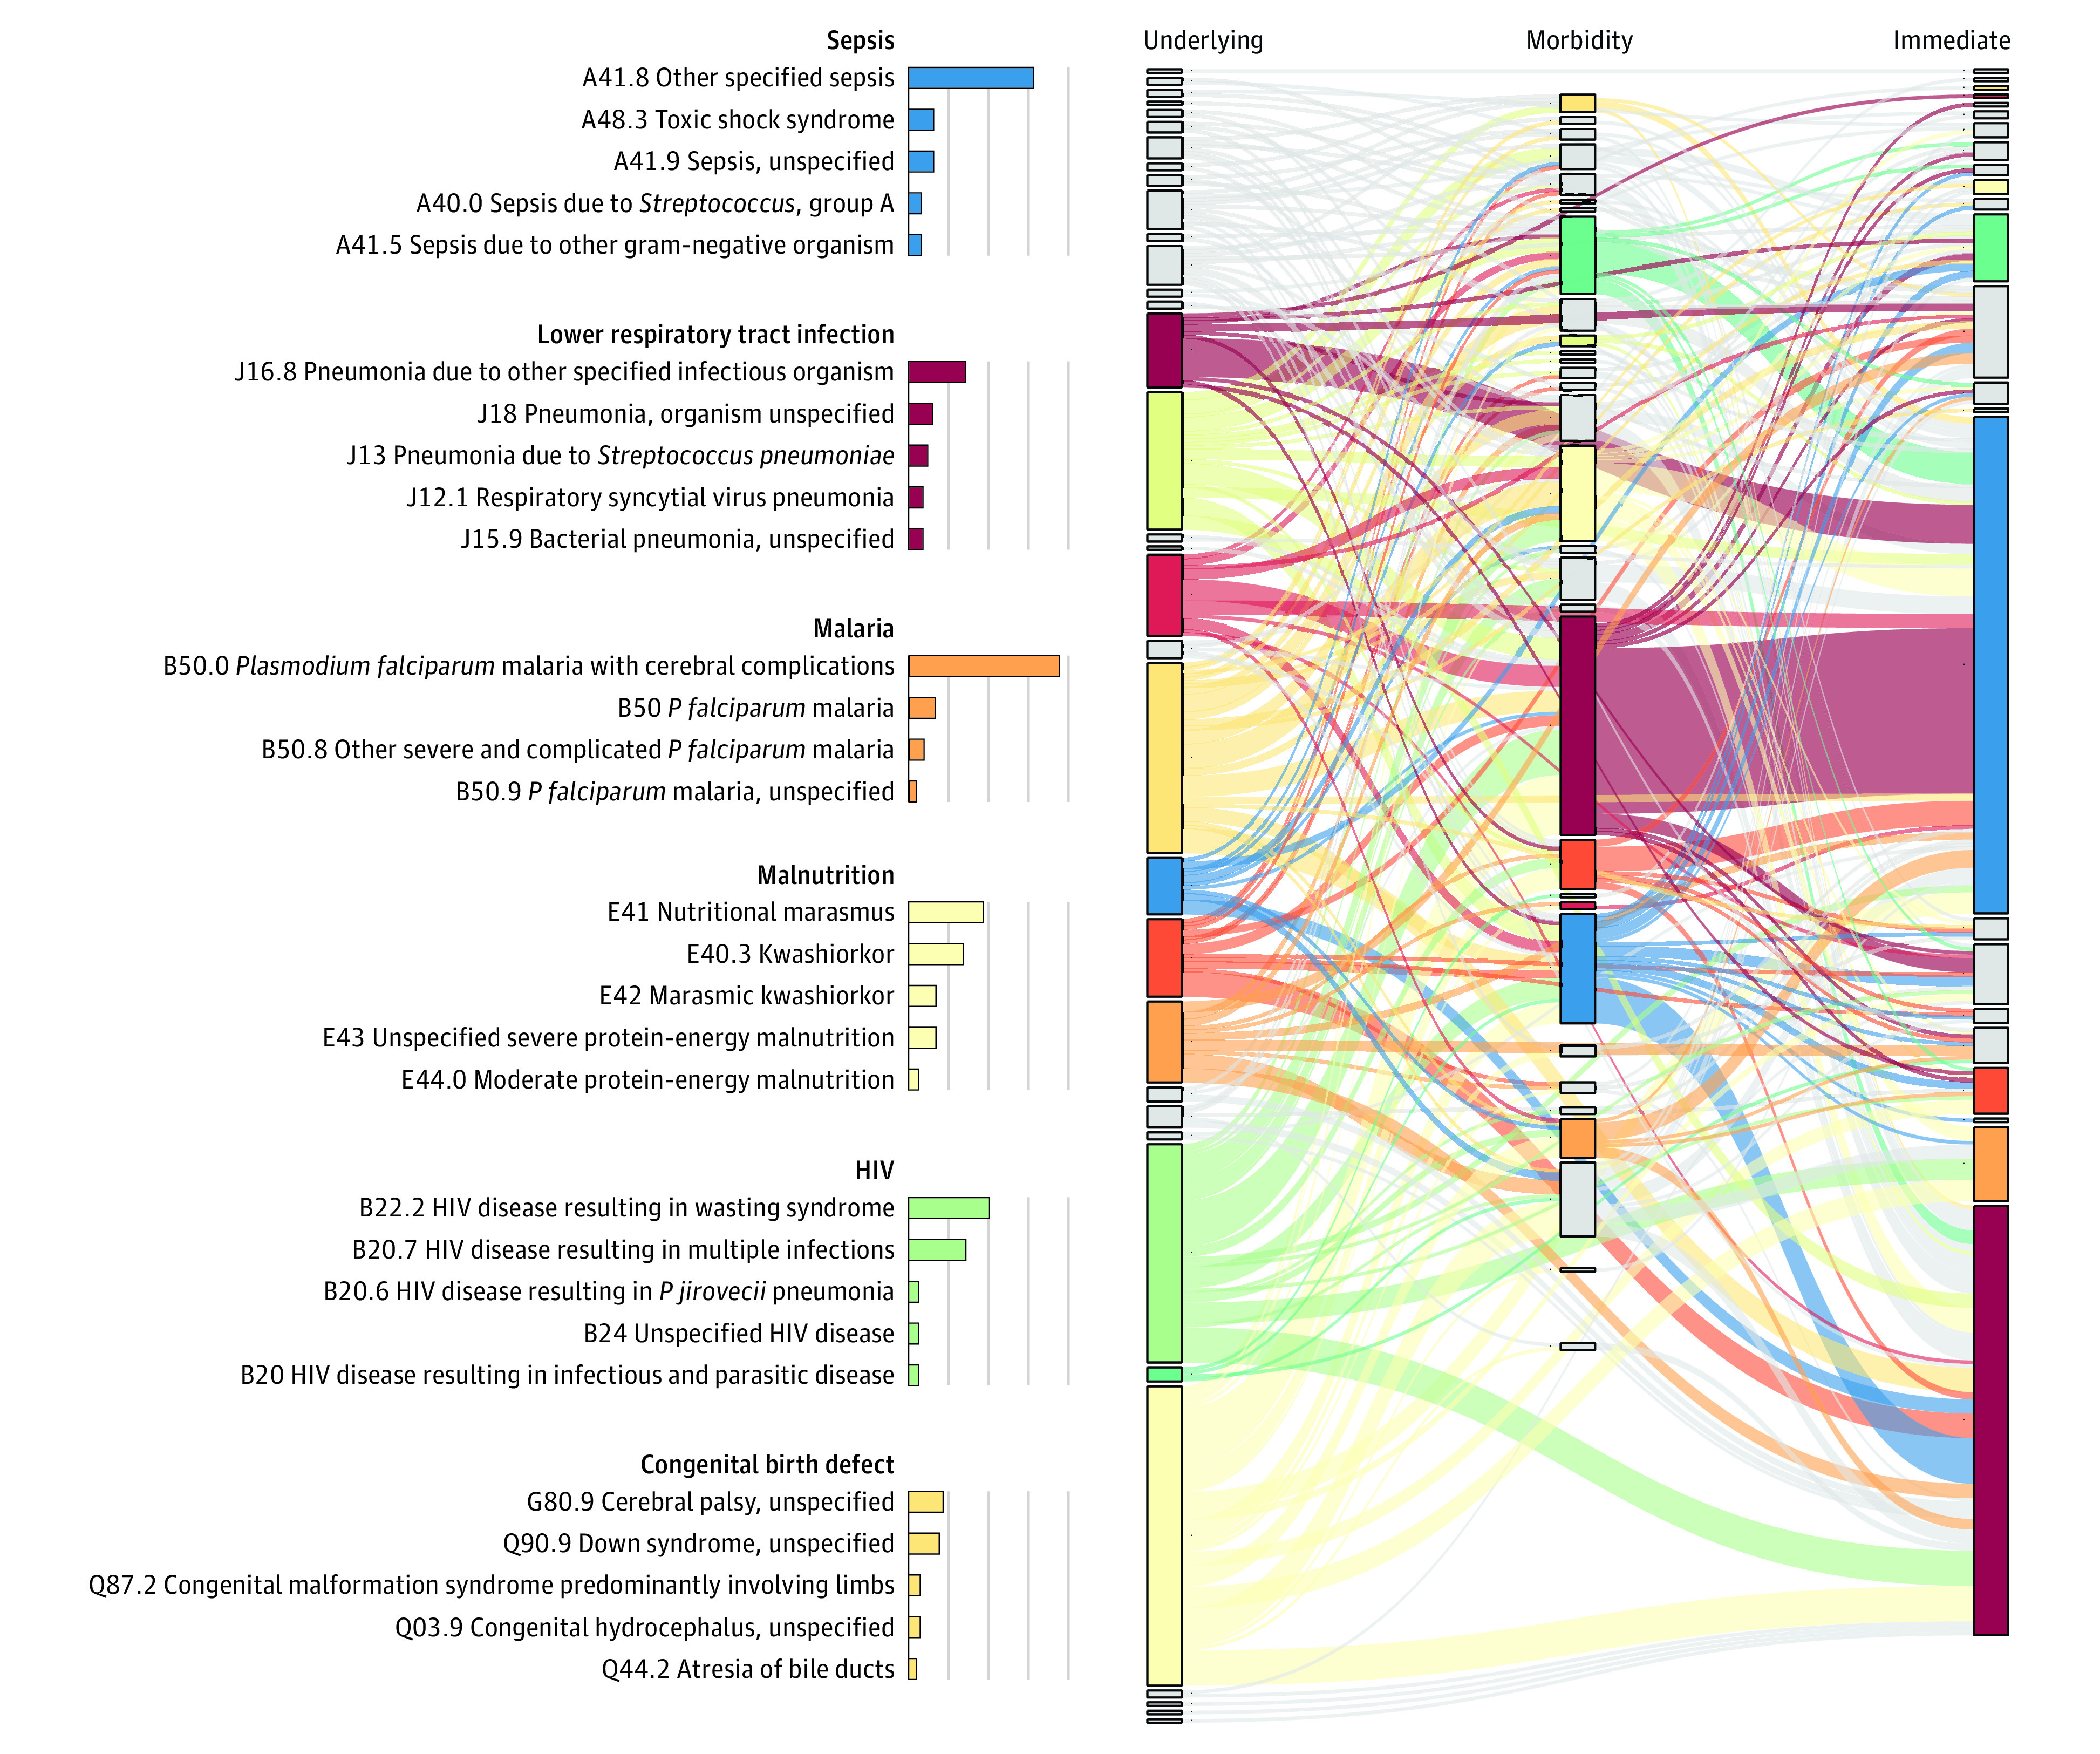
Main outcomes and measures: The expert panel attributed underlying, intermediate, and immediate conditions in the chain of events leading to death, based on histopathologic analysis, microbiological diagnostics, clinical data, and verbal autopsies.
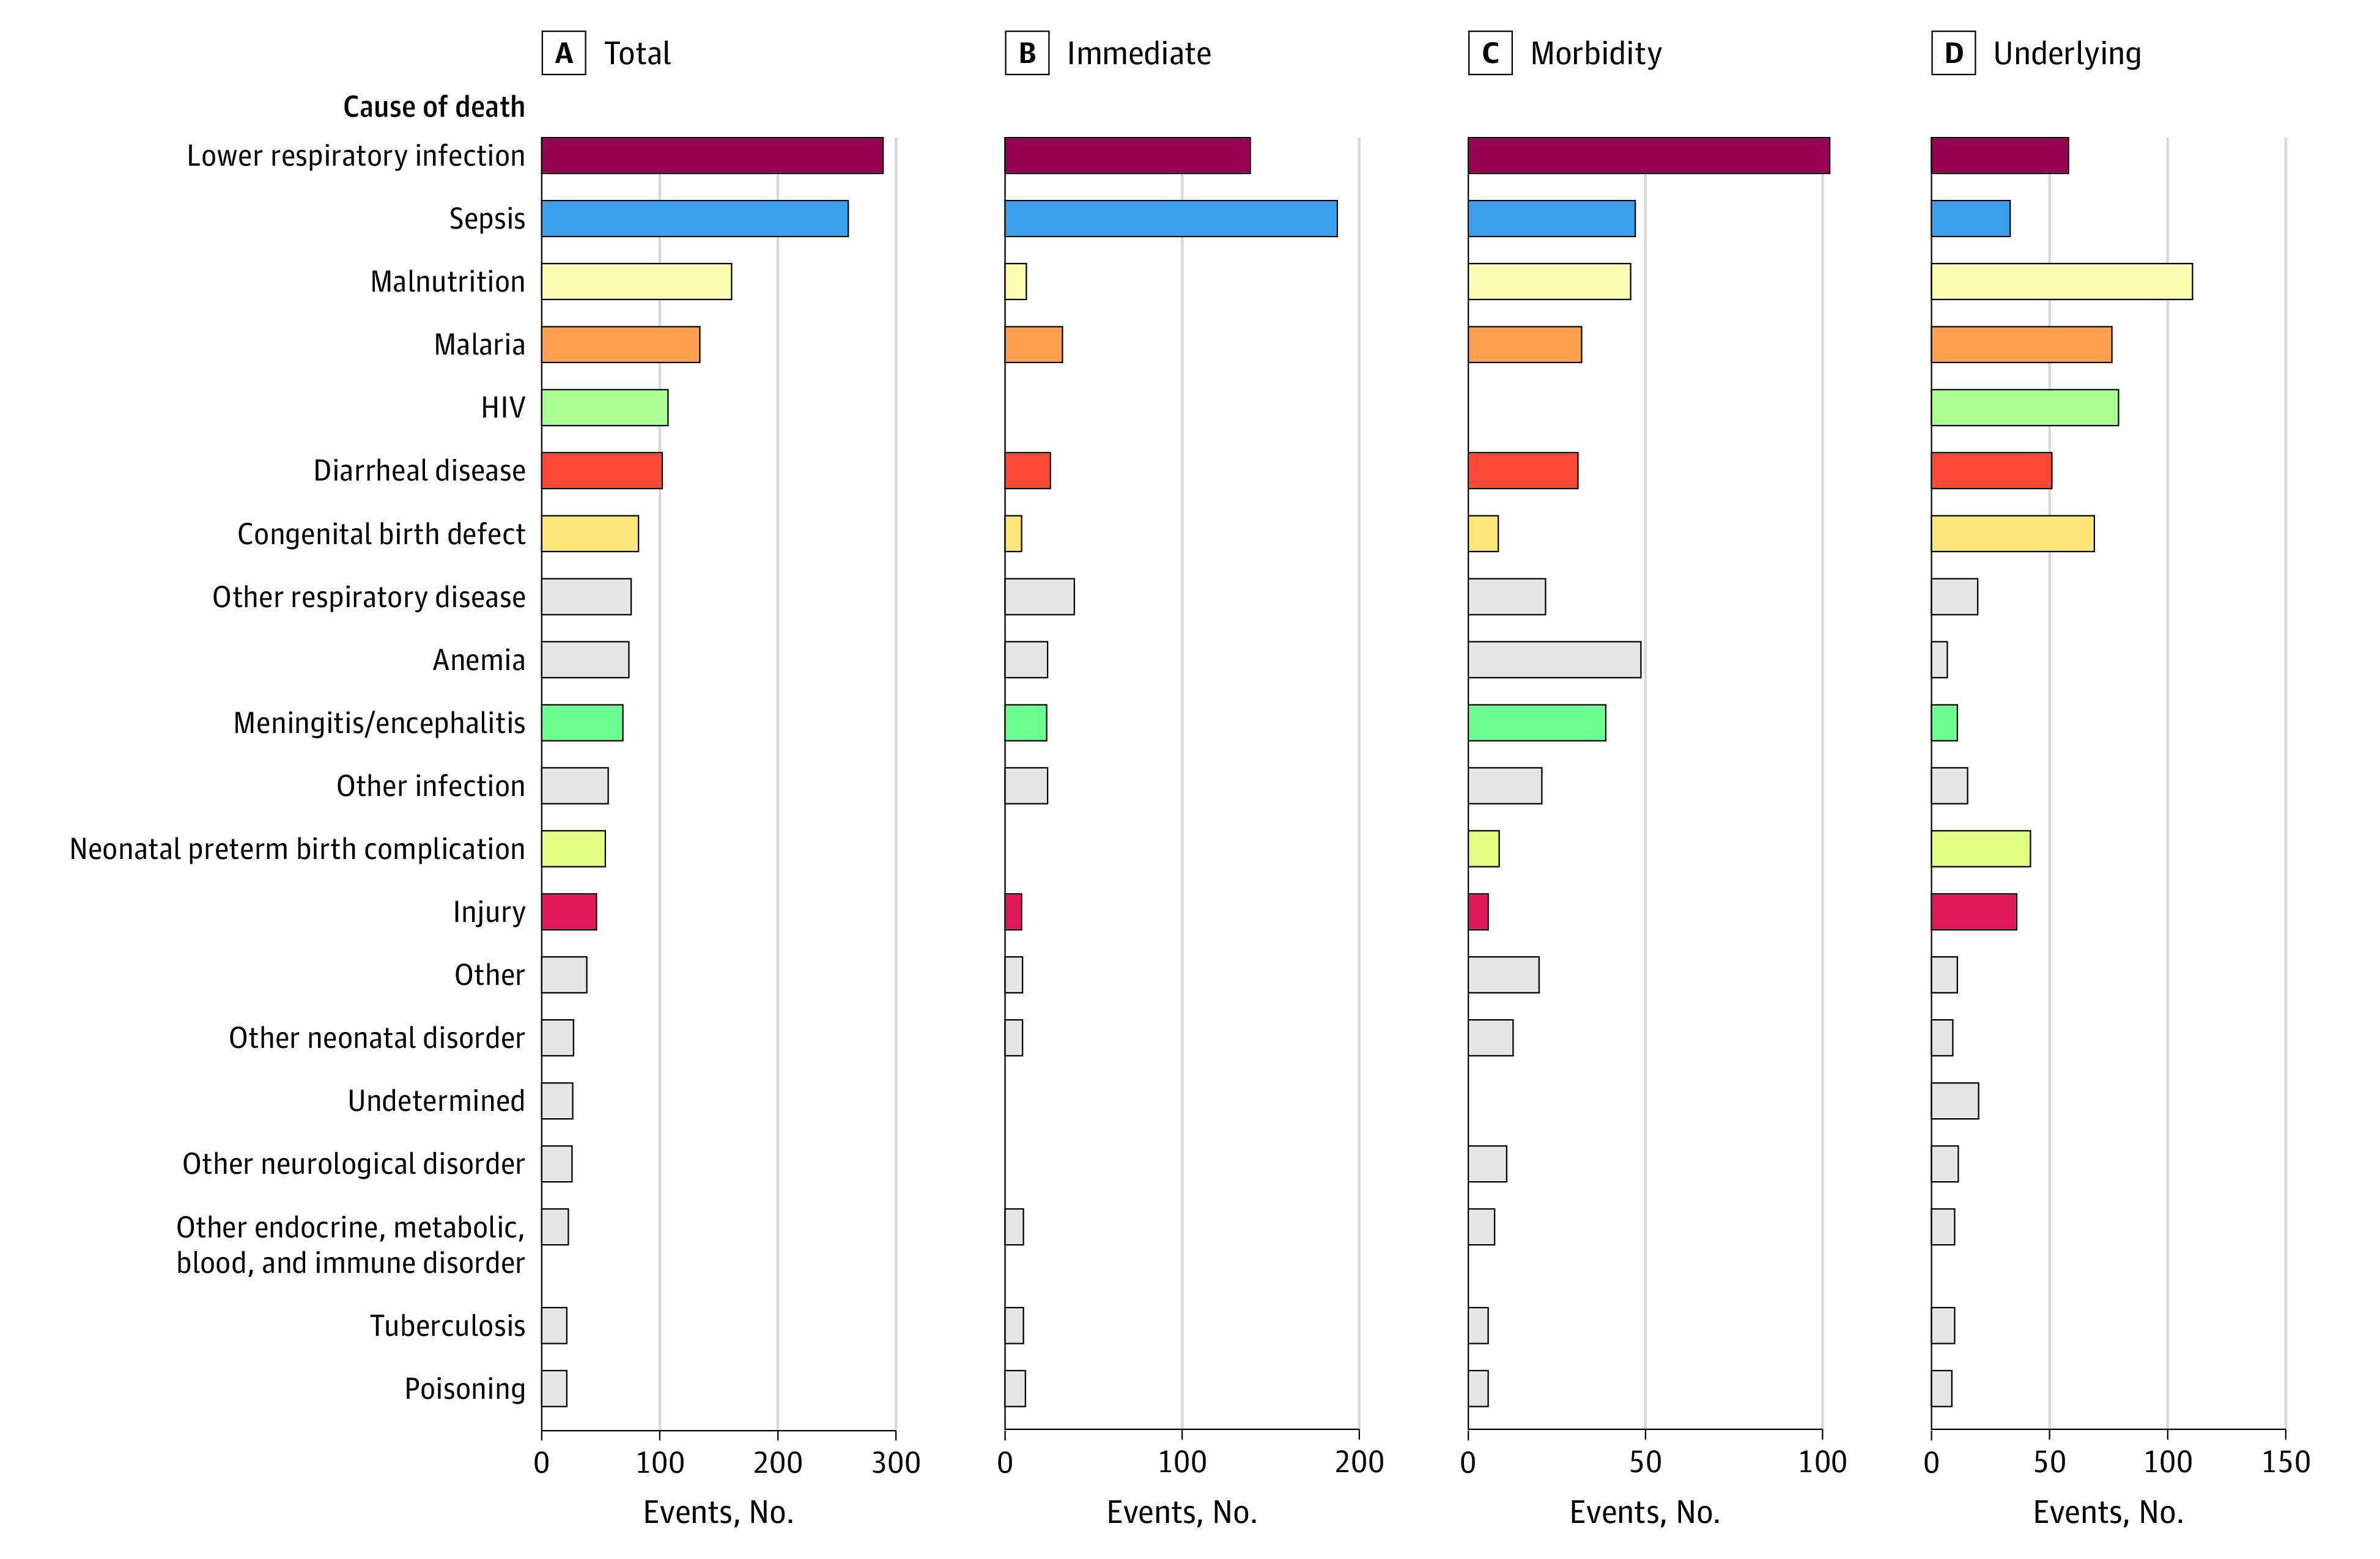
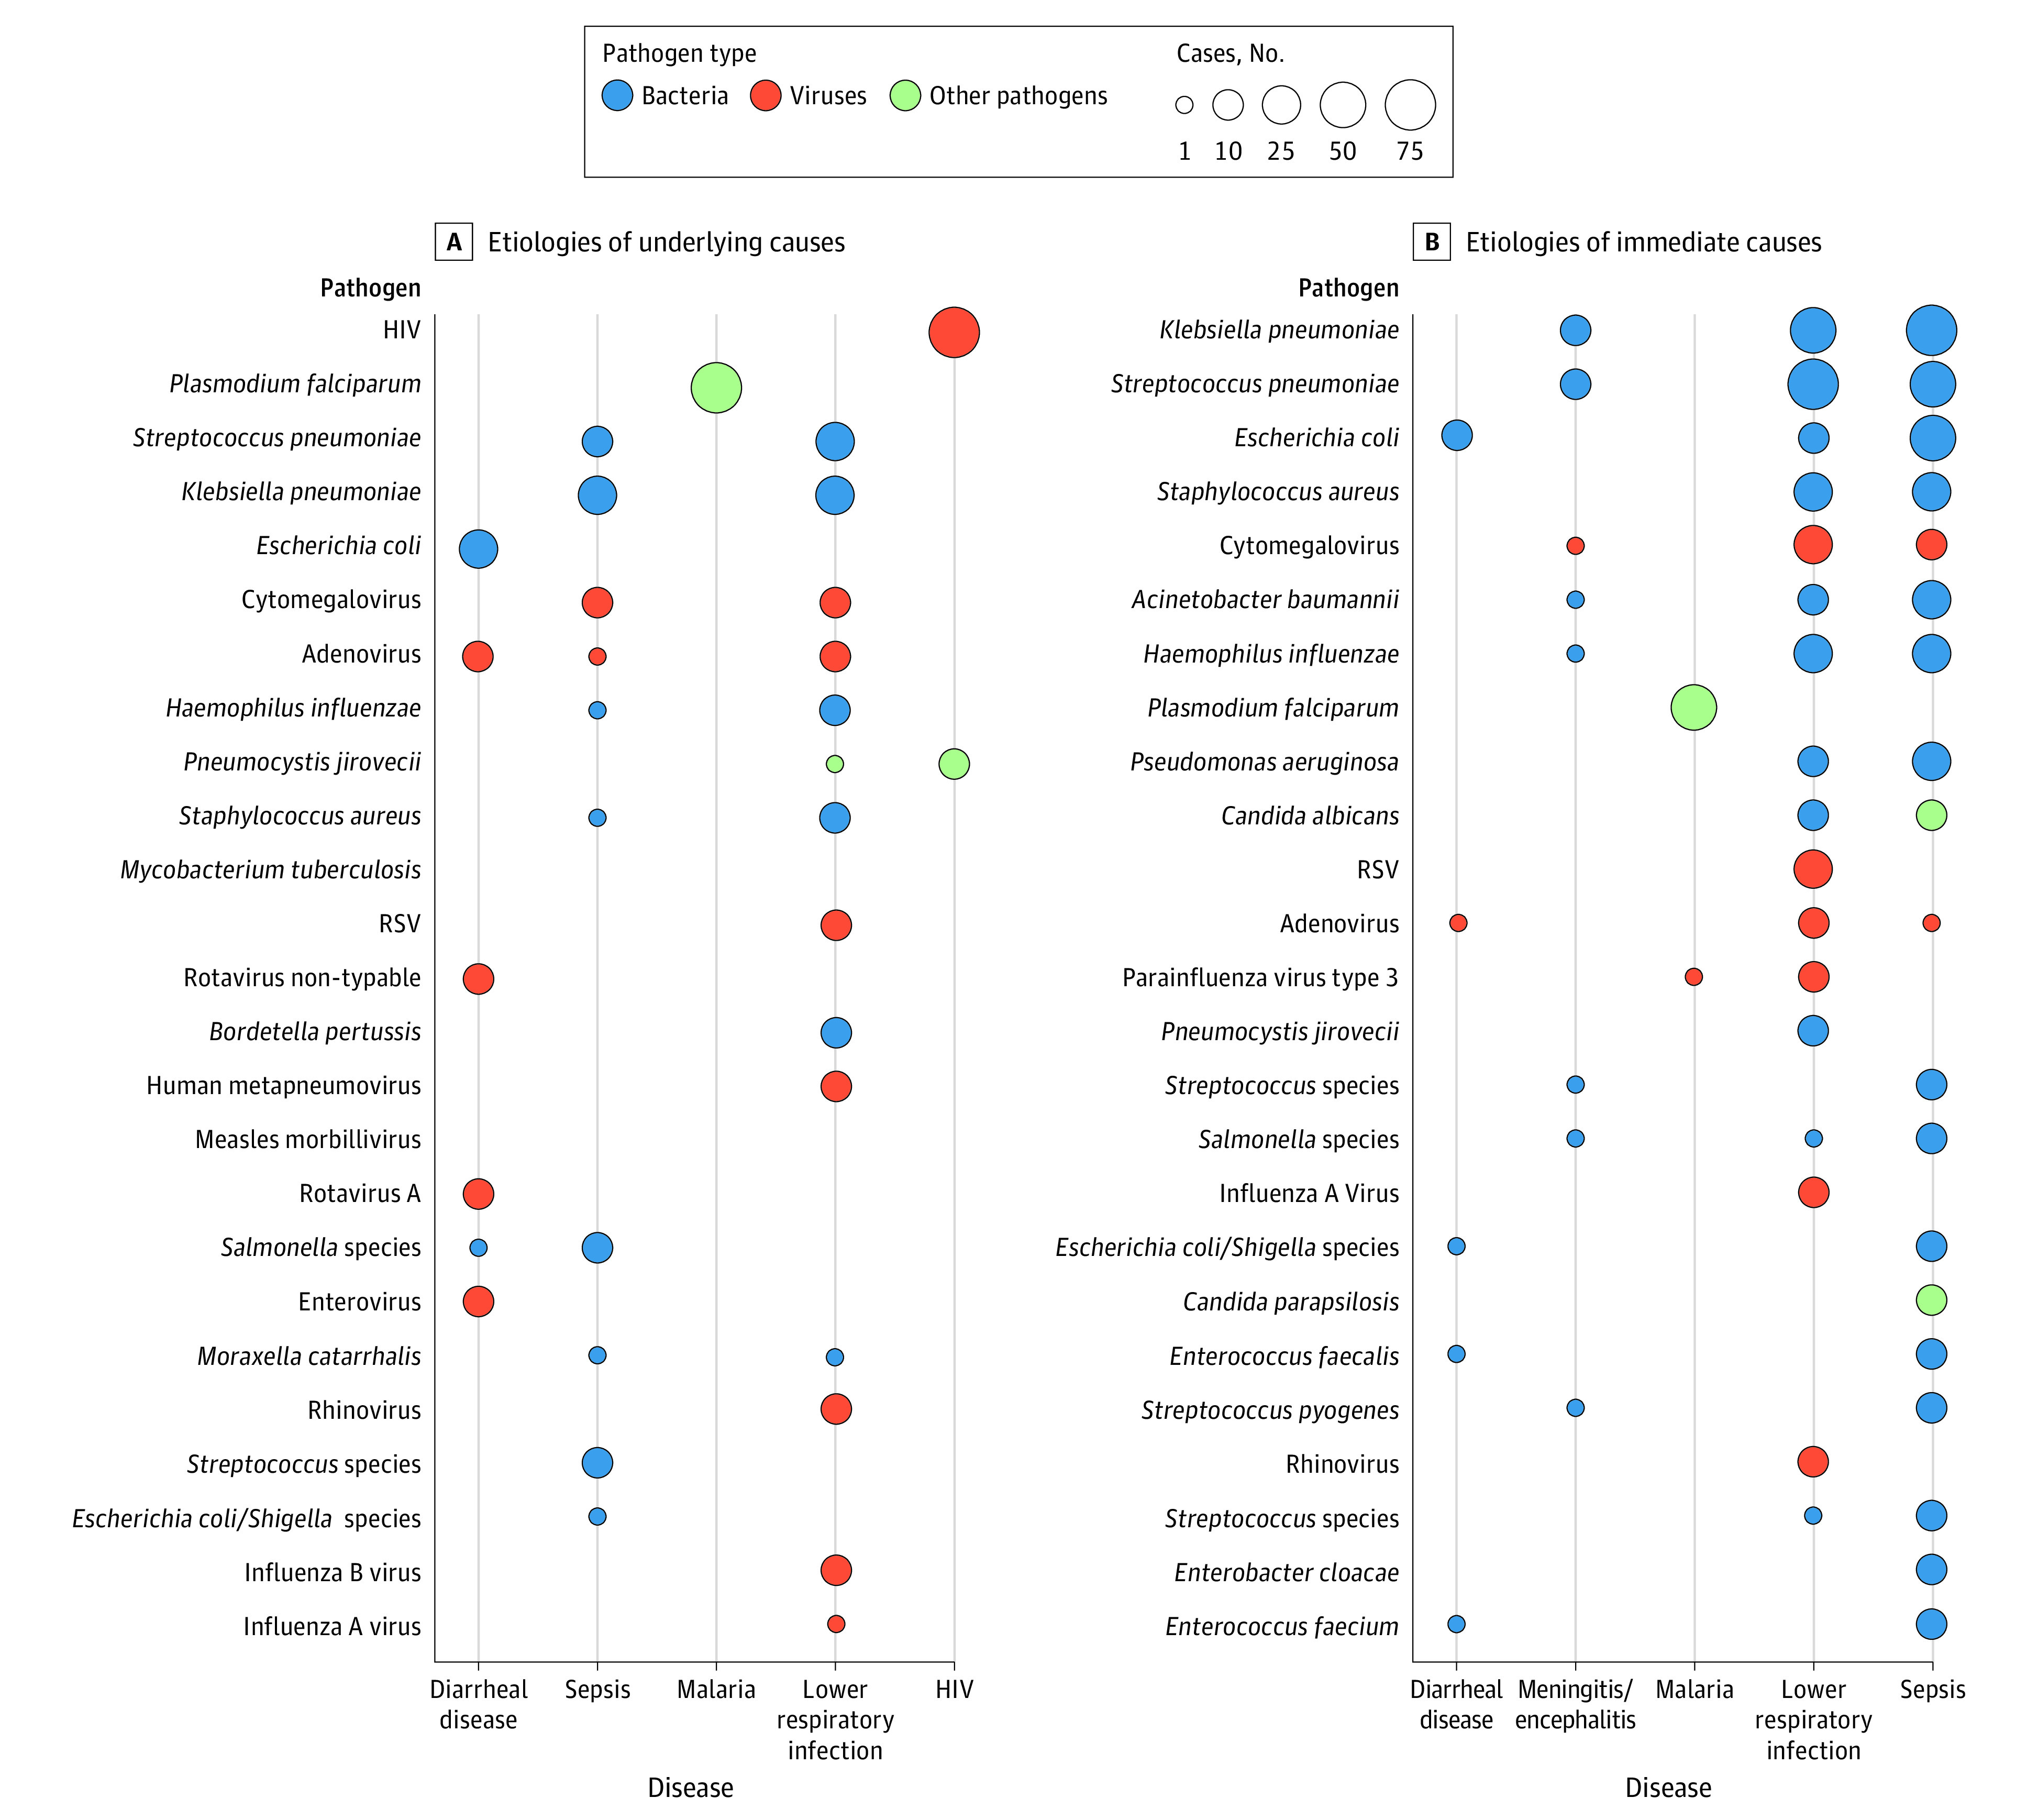
Results: In this study, MITS was performed in 632 deceased children (mean [SD] age at death, 1.3 [0.3] years; 342 [54.1%] male). The 6 most common underlying causes of death were malnutrition (104 [16.5%]), HIV (75 [11.9%]), malaria (71 [11.2%]), congenital birth defects (64 [10.1%]), lower respiratory tract infections (LRTIs; 53 [8.4%]), and diarrheal diseases (46 [7.2%]). When considering immediate causes only, sepsis (191 [36.7%]) and LRTI (129 [24.8%]) were the 2 dominant causes. An infection was present in the causal chain in 549 of 632 deaths (86.9%); pathogens most frequently contributing to infectious deaths included Klebsiella pneumoniae (155 of 549 infectious deaths [28.2%]; 127 [81.9%] considered nosocomial), Plasmodium falciparum (122 of 549 [22.2%]), and Streptococcus pneumoniae (109 of 549 [19.9%]). Other organisms, such as cytomegalovirus (57 [10.4%]) and Acinetobacter baumannii (39 [7.1%]; 35 of 39 [89.7%] considered nosocomial), also played important roles. For the top underlying causes of death, the median number of conditions in the chain of events leading to death was 3 for malnutrition, 3 for HIV, 1 for malaria, 3 for congenital birth defects, and 1 for LRTI. Expert panels considered 494 of 632 deaths (78.2%) preventable and 26 of 632 deaths (4.1%) preventable under certain conditions.
Conclusions and relevance: In this cross-sectional study investigating causes of child mortality in the CHAMPS Network, results indicate that, in these high-mortality settings, infectious diseases continue to cause most deaths in infants and children, often in conjunction with malnutrition. These results also highlight opportunities for action to prevent deaths and reveal common interaction of various causes in the path toward death.
Conflict of interest statement
Figures
Comment in
-
Need for a Structural Approach to Promote Child Survival.JAMA Netw Open. 2023 Jul 3;6(7):e2322435. doi: 10.1001/jamanetworkopen.2023.22435. JAMA Netw Open. 2023. PMID: 37494048 No abstract available.
References
-
- GBD 2015 Child Mortality Collaborators . Global, regional, national, and selected subnational levels of stillbirths, neonatal, infant, and under-5 mortality, 1980-2015: a systematic analysis for the Global Burden of Disease Study 2015. Lancet. 2016;388(10053):1725-1774. doi: 10.1016/S0140-6736(16)31575-6 - DOI - PMC - PubMed
Publication types
MeSH terms
LinkOut - more resources
Full Text Sources
Medical
