. 2023 Aug 3;40(8):msad168.
doi: 10.1093/molbev/msad168.

Chromosome-Aware Phylogenomics of Assassin Bugs (Hemiptera: Reduvioidea) Elucidates Ancient Gene Conflict

Affiliations

Chromosome-Aware Phylogenomics of Assassin Bugs (Hemiptera: Reduvioidea) Elucidates Ancient Gene Conflict

Alexander Knyshov et al. Mol Biol Evol. .

Abstract

Though the phylogenetic signal of loci on sex chromosomes can differ from those on autosomes, chromosomal-level genome assemblies for nonvertebrates are still relatively scarce and conservation of chromosomal gene content across deep phylogenetic scales has therefore remained largely unexplored. We here assemble a uniquely large and diverse set of samples (17 anchored hybrid enrichment, 24 RNA-seq, and 70 whole-genome sequencing samples of variable depth) for the medically important assassin bugs (Reduvioidea). We assess the performance of genes based on multiple features (e.g., nucleotide vs. amino acid, nuclear vs. mitochondrial, and autosomal vs. X chromosomal) and employ different methods (concatenation and coalescence analyses) to reconstruct the unresolved phylogeny of this diverse (∼7,000 spp.) and old (>180 Ma) group. Our results show that genes on the X chromosome are more likely to have discordant phylogenies than those on autosomes. We find that the X chromosome conflict is driven by high gene substitution rates that impact the accuracy of phylogenetic inference. However, gene tree clustering showed strong conflict even after discounting variable third codon positions. Alternative topologies were not particularly enriched for sex chromosome loci, but spread across the genome. We conclude that binning genes to autosomal or sex chromosomes may result in a more accurate picture of the complex evolutionary history of a clade.

Keywords: X chromosome; gene conflict; gene content; phylogenomics; sex chromosome.


Figures

<sc>Fig.</sc> 1.
Fig. 1.
Schematic of the pipeline to produce the set of loci used in the study. Raw reads were run through quality control and preprocessing, followed by a de novo assembly. Obtained assemblies, together with three reference genome assemblies, were searched for homologs of the AHE and OMCL loci and extracted using ALiBaSeq. Exonerate was then used to precisely extract CDS, which were aligned and block-trimmed on protein level. AA-based gene trees were used to remove distant outliers, and in case of the OMCL data set, more precisely detect orthologs. Two rounds of segment trimming and further sequence outlier removal were performed, followed by removing loci with extreme RF distance to the species tree, and concluded by a final segment trimming of the entire matrix using spruceup.
<sc>Fig.</sc> 2.
Fig. 2.
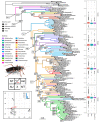
The topology in center was inferred based on the NT matrix of the combined AHE + OMCL data set. Branches are colored based on the current subfamiliar classification of the 106 ingroup taxa. Tip symbols represent data type; sex is annotated for genomic taxa with morphological sex determination. Node boxes represent UFBoot (IQ-TREE-based analyses) or local posterior probability (Astral-based analyses) support values in different analyses (asterisk denotes full support in a given analysis) or include X when a node was not recovered relative to the NT analysis or by a dash “-” when a node could not be recovered due to reduced taxon sampling. Only nodes with a conflict or with <100% support in any analysis have nodal plots shown. When only the mitogenome data set had <100% support, it was shown by itself in the interest of conserving space. From the distribution of the nodal boxes, it is evident that the conflict between analyses primarily concerns the backbone of Reduvioidea and several deep divergences within subfamilies, while most recent divergences are supported across all analyses. Additionally, X chromosome and mitochondrial data sets are the two most discordant. Lower left panel represents an RF-based PCoA analysis of topologies obtained from different analyses, only first two PCs shown, inset shows a screeplot of the eigenvalues for each individual PCoA axis. Results of this analysis show that both X chromosome and mitochondrial topologies are drastically different from the rest, however also different from each other. Additionally, the X12 data set (with third codon position removed) is relatively similar to full and autosomal analyses. Box plots on right show likelihood difference between a given node shown in the phylogeny (N5–6, 8–9) and next most likely topology with a different relationship around that node for each gene (positive scores mean that the next most likely tree with an alternative node relationships is more likely for most genes). Results show that, for several of the nodes, correcting X signal (X12) made the likelihood difference distribution closer to that of autosomal genes. Additional nodes labeled (N1–4, N7) are discussed in text. Photo of Psyttala horrida (Reduviinae) by P.K.M.
<sc>Fig.</sc> 3.
Fig. 3.
The top panel (a) shows the results of the gene synteny analysis between T. rubrofasciata (tp) and A. lucorum (al) chromosomes, with R. prolixus chromosomal synteny (rp) shown at the top. The analysis shows fairly conserved synteny between groups of al chromosomes and tp chromosomes. More interestingly, no syntenic blocks for X-loci of tp were found on autosomes of al. Bottom left panel (b) shows the distribution of average locus depth in the combined AHE + OMCL data set on autosomes and X chromosome by morphological sex determined for taxa with sex symbols indicated in figure 2. Results show male X chromosomal loci having significantly lower average coverage than female X-loci or male autosomal loci. Bottom right panel (c) shows the distribution of various locus properties in autosomal and X chromosome loci, outliers were excluded, for the full data, see supplementary figure S2, Supplementary Material online. Most properties have significantly different distributions, with the exception of proportion of parsimony informative sites and mean GC content of the third codon position.
<sc>Fig.</sc> 4.
Fig. 4.
Visualization of gene tree conflict. NT12 gene trees were clustered into groves based on weighted RF distance calculated across gene tree phylogenies with nodes supported by <50% bootstrap collapsed using TreeSpace (PCoA). Analyses of full NT123 grove sets with IQ-TREE are shown; only nodes which differ from the combined Autosomal NT123 tree (large tree on right) include support values and relevant clades which contain differences are highlighted in color for emphasis. The number of loci in each grove is represented as a portion of a pie chart with the number of X-linked loci highlighted in black. Grove 7 contained only three genes and was excluded from subsequent investigations.

Similar articles

References

    1. Altschul SF, Gish W, Miller W, Myers EW, Lipman DJ. 1990. Basic local alignment search tool. J Mol Biol. 215:403–410. - PubMed
    1. Anderson N, Jaron KS, Hodson CN, Couger MB, Ševčík J, Weinstein B, Pirro S, Ross L, Roy SW. 2022. Gene-rich X chromosomes implicate intragenomic conflict in the evolution of bizarre genetic systems. Proc Natl Acad Sci U S A. 119:e2122580119. - PMC - PubMed
    1. Arcila D, Ortí G, Vari R, Armbruster JW, Stiassny MLJ, Ko KD, Sabaj MH, Lundberg J, Revell LJ, Betancur-R R. 2017. Genome-wide interrogation advances resolution of recalcitrant groups in the tree of life. Nat Ecol Evol. 1:20. - PubMed
    1. Ballesteros JA, Hormiga G. 2016. A new orthology assessment method for phylogenomic data: unrooted phylogenetic orthology. Mol Biol Evol. 33:2481. - PubMed
    1. Bandi V, Gutwin C.. 2022. Interactive exploration of genomic conservation. [Last accessed 2020 Sep 29]. Available from: https://openreview.net/pdf?id=7-C5VJWbnI

Publication types