. 2023 Aug 8;120(32):e2220849120.
doi: 10.1073/pnas.2220849120. Epub 2023 Jul 26.

Steroidogenic factor 1 (SF-1; Nr5a1) regulates the formation of the ovarian reserve

Affiliations

Steroidogenic factor 1 (SF-1; Nr5a1) regulates the formation of the ovarian reserve

Camilla H K Hughes et al. Proc Natl Acad Sci U S A. .

Abstract

The ovarian follicle reserve, formed pre- or perinatally, comprises all oocytes for lifetime reproduction. Depletion of this reserve results in infertility. Steroidogenic factor 1 (SF-1; Nr5a1) and liver receptor homolog 1 (LRH-1; Nr5a2) are two orphan nuclear receptors that regulate adult endocrine function, but their role in follicle formation is unknown. We developed models of conditional depletion of SF-1 or LRH-1 from prenatal ovaries. Depletion of SF-1, but not LRH-1, resulted in dramatically smaller ovaries and fewer primordial follicles. This was mediated by increased oocyte death, resulting from increased ovarian inflammation and increased Notch signaling. Major dysregulated genes were Iroquois homeobox 3 and 5 and their downstream targets involved in the establishment of the ovarian laminin matrix and oocyte-granulosa cell gap junctions. Disruptions of these pathways resulted in follicles with impaired basement membrane formation and compromised oocyte-granulosa communication networks, believed to render them more prone to atresia. This study identifies SF-1 as a key regulator of the formation of the ovarian reserve.

Keywords: follicle assembly; orphan nuclear receptor; ovarian reserve; primordial follicle; steroidogenic factor 1.


Conflict of interest statement

The authors declare no competing interest.

Figures
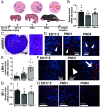
Fig. 1.
Fig. 1.
LRH-1, SF-1, and AMHR2 in wild-type ovaries on ED17.5, PND1, and PND4. (A) Schematic diagram showing the time points evaluated and the accompanying events in the ovary (created using biorender.com). (B) Gene expression of Amhr2 in ovaries from ED17.5, PND1, and PND4 as assessed by qPCR. (C) RNAscope in situ hybridization for Amhr2 in ED17.5 ovaries, including lower and higher magnification. (D) AMHR2 protein expression in ovaries from ED17.5, PND1, and PND4 as assessed by immunohistochemistry; AMHR2 staining is indicated by narrow triangles. (E) Gene expression of Nr5a2 in ovaries from ED17.5, PND1, and PND4. (F) Immunostaining for LRH-1 protein in ED17.5 and PND1 ovaries. The arrow indicates LRH-1 positive primordial follicles, while the triangle indicates an LRH-1 negative germ cell nest. (G) Gene expression of Nr5a1 in ovaries from ED17.5, PND1, and PND4. (H) Immunostaining for SF-1 protein in ED17.5, PND1, and PND4 ovaries. For the qPCR experiment, n = 6 to 8, as shown on graphs; n = 3 for immunohistochemistry and representative images are shown. In all immunofluorescence images, the protein of interest is shown in red, and nuclei are counterstained with DAPI. Data were analyzed by ANOVA followed by individual comparison of means using the Tukey post hoc test. Bar graphs represent the mean ± SEM, and bars with common superscript letters were not different at P < 0.05.
Fig. 2.
Fig. 2.
Evolutionary conservation of Nr5a1 and Nr5a2 expression before, during, and after primordial follicle assembly (PFA). Nr5a1 (pink) and Nr5a2 (blue) abundance in (A) Mus musculus (mouse); (B) Rattus norvegicus (rat); (C) Homo sapiens (human); (D) Oryctolagus cuniculus (rabbit); (E) Monodelphis domestica (opossum); and (F) Gallus gallus (chicken). Timing of ovarian developmental events labeled on graphs is approximate and based on literature reports (–36). Points represent the mean, with error bars showing ± SEM. (G) Evolutionary tree showing relationships among the six species evaluated, generated using the Interactive Tree Of Life online tool (37).
Fig. 3.
Fig. 3.
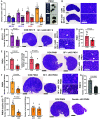
Phenotypic characterization of perinatal SF-1 cKO ovaries. (A) Effect of depletion of SF-1 on ovarian volume. (B) Representative histological images of hematoxylin and eosin (H & E)-stained SF-1 CON and cKO ovaries on ED15.5. (C) Representative histological images of hematoxylin and eosin (H & E)-stained SF-1 CON and cKO ovaries on ED17.5 and effect SF-1 depletion on oocytes remaining in cysts on ED17.5. (D) Effect SF-1 depletion on oocytes remaining in cysts on PND1. Effect of SF-1 depletion on primordial follicle populations on PND1 (E), PND4 (F), and PND13 (G) and representative histological images of hematoxylin and eosin (H & E)-stained SF-1 CON and cKO ovaries for PND1 (E) and PND4 (F). (H) Quantification of follicle populations on PND4 following depletion of both SF-1 and LRH-1 (double cKO), comparison to SF-1 single cKO, and representative histological images from the same day. For oocyte and follicle counts, sections were taken at regular intervals through the whole ovary, and thus, counts are a representative subsample of all follicles in an ovary. The number of replicates is as shown on graphs; n = 3 to 7 for oocyte and follicle count experiments and n = 4 to 18 for ovarian volume. In each ovarian cross-section image, the dark gray (Scale bar represents 100 µm.) Bar graphs represent the means, with error bars showing ± SEM. Data were analyzed by the t test.
Fig. 4.
Fig. 4.
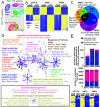
mRNAseq of SF-1 cKO and control ovaries demonstrates changes to gonadal and organ development pathways. (A) Principal component analysis showing clustering of the six groups. (B) Heatmaps showing differentially abundant mRNA (padj < 0.05; log2 fold change > |1| within each individual pairwise comparison, performed in DEseq2) in the SF-1 cKO vs. control comparison on ED17.5, PND1, and PND4. (C) A Venn diagram depicting the commonalities among datasets in the number of genes affected by the depletion of SF-1 on each of the three days of ovarian development. The number of regulated genes in each comparison is shown outside of the diagram, while the number of common genes for each comparison is shown in each overlapping segment. (D) Pathway analysis of the genes down-regulated by depletion of SF-1 on ED17.5, PND1, and PND4, with selected genes from each pathway shown on the network diagram. Reclustering (boxed) and a heatmap (genes: A​ldh​1a1, ​A​mhr​2, ​Bcl​11b​, C​dh2​3, ​Edn​2​, Gat​a3​, Gp​r55​, I​rx3​, I​rx5​, K​cnq​1, ​, Krt​8​, Lga​ls2​, L​gr5​, L​sr, Nr0b1, Ryr2, Srd5a2, Tmie, and Wnt6) depict pathways of interest, gonad development, and embryonic organ morphogenesis. (E) Proportion of transcripts that changed (Padj < 0.05; log2 fold change > |1|) in SF-1 cKO ovaries that also have the Nr5a1/Nr5a2 motif in the cis-regulatory region, as compared to the proportion of transcripts that did not change (P > 0.05; log2 fold change < |1|) with the motif. N = 4 per group for mRNAseq. In both heatmaps, yellow indicates the maximum value within a row, while blue indicates the minimum value.
Fig. 5.
Fig. 5.
Conditional depletion of SF-1 results in downregulation of Irx3 and Irx5 and dysregulation of ovarian laminin. Abundance of Irx3 and Irx5 transcript from mRNAseq (A) and in situ hybridization (B) and of laminin transcripts by mRNAseq (C), qPCR (D) and total laminin protein on PND4 by immunofluorescence (E and F). The dashed white lines in F indicate a normal laminin basement membrane around primary follicles in the control ovaries. In immunofluorescence images, the protein of interest is red, and nuclei are blue (DAPI). The red channel only (laminin) image is also shown. (G) H&E images of follicles from an adult control and SF-1 cKO mice. N = 4 to 6, as shown on graphs. Data in A are mRNAseq data analyzed in DEseq2, and * indicates Padj < 0.05 within the individual pairwise cKO vs. CON comparison shown. Pairwise comparisons of other groups are not shown but are available in Datasets S1–S7. Data in (D) and (E) were analyzed by the t test. In all bar graphs, the bars represent the means, with error bars showing ± SEM.
Fig. 6.
Fig. 6.
Conditional depletion of SF-1 results in increased oocyte death, excess ovarian inflammation, and changes to Notch signaling during follicular assembly. (A) Heatmap showing the expression of transcripts that changed between ED17.5 and PND1 in control ovaries but failed to change in SF-1 cKO ovaries. Yellow indicates the maximum value within a row, while blue indicates the minimum value. Complete pathway analysis is in SI Appendix, Fig. S11. (B) Abundance of selected transcripts that regulate phagocytosis, assessed by mRNAseq. Abundance of components of the Notch signaling pathway, regulators of oocyte survival (C) and of complement transcripts, and regulators of cellular death downstream of the DNA damage response (D), assessed by mRNAseq. (E) TUNEL staining and quantification on ED17.5 and PND1, showing dead cells in brown and all cells counterstained in green. As shown on graphs, n = 4 for mRNAseq and n = 4 to 7 for TUNEL assay. Data in (B) are mRNAseq data analyzed in DEseq2, and * indicates Padj < 0.05 within the individual pairwise cKO vs. CON comparison. Pairwise comparisons of other groups are not shown but are available in Datasets S1–S7. Data in (E) were analyzed by the t test. In all bar graphs, the bars represent the means, with error bars showing ± SEM.
Fig. 7.
Fig. 7.
KITL is downstream of SF-1 and rescues the phenotype of reduced ovarian reserve in SF-1 cKO ovaries. (A) Abundance of Kit and Kitl in ED17.5 and PND1 ovaries, as assessed by qPCR. (B) Representative histological images of SF-1 cKO ovaries cultured for 6 d without and with 100 ng/mL KITL. (C) Quantification of primordial follicle populations in CON and SF-1 cKO ovaries cultured without and with KITL. (D) Multi-oocyte follicles were observed in cKO ovaries cultured with KITL. Error bar = 50 μ M. (E) Large oocytes with flattened, primordial granulosa cells were observed in cKO ovaries cultured with KITL. Error bar = 25 μ M. N = 3 to 5 for both qPCR and ovarian culture experiments as shown on the graphs. The qPCR data were analyzed by the t test and ovarian culture data were analyzed by paired t test with mouse as pairing factor. In all bar graphs, the bars represent the means, with error bars showing ± SEM.
Fig. 8.
Fig. 8.
Summary of the effects of SF-1 depletion on the ovarian reserve. (A) Schematic diagram showing events in follicular assembly in wild-type or control ovaries. (B) Schematic diagram showing the processes that are disrupted in SF-1 cKO ovaries during follicular development.

Similar articles

Cited by

References

    1. Damario M. A., General aspects of fertility and infertility. Methods Mol. Biol. 1154, 3–23 (2014). - PubMed
    1. Vander Borght M., Wyns C., Fertility and infertility: Definition and epidemiology. Clin. Biochem. 62, 2–10 (2018). - PubMed
    1. Wang R., et al. , Treatment strategies for women with WHO group II anovulation: Systematic review and network meta-analysis. BMJ 356, j138 (2017). - PMC - PubMed
    1. O’Connell J. M., Pepling M. E., Primordial follicle formation - some assembly required. Curr. Opin. Endocr. Metab. Res. 18, 118–127 (2021). - PMC - PubMed
    1. Lew R., Natural history of ovarian function including assessment of ovarian reserve and premature ovarian failure. Best Pract. Res. Clin. Obstet. Gynaecol. 55, 2–13 (2019). - PubMed

Substances

Grants and funding