. 2023 Jul 28;9(30):eadd6997.
doi: 10.1126/sciadv.add6997. Epub 2023 Jul 26.

Loss of metabolic fitness drives tumor resistance after CAR-NK cell therapy and can be overcome by cytokine engineering

Affiliations

Loss of metabolic fitness drives tumor resistance after CAR-NK cell therapy and can be overcome by cytokine engineering

Li Li et al. Sci Adv. .

Abstract

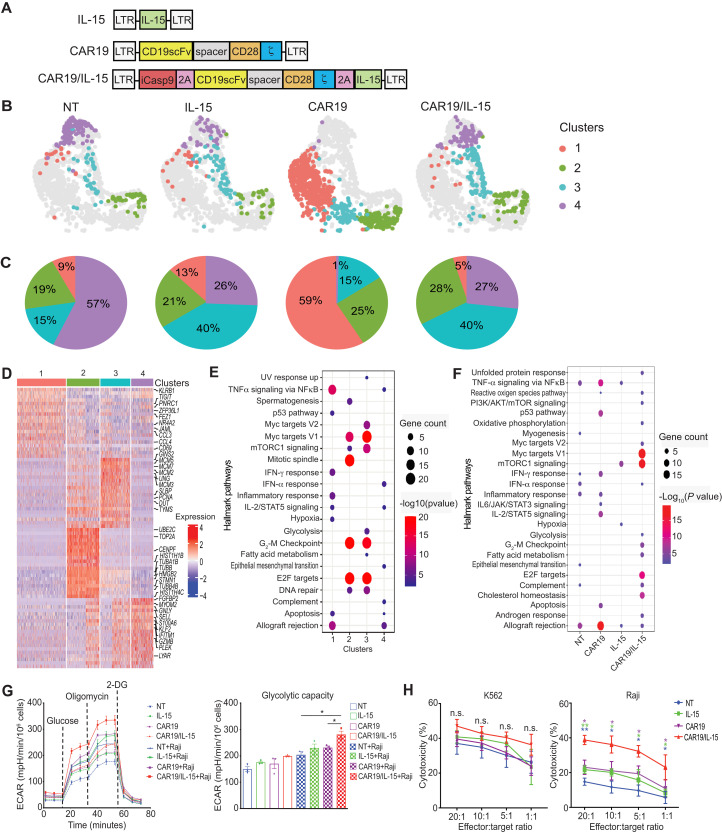
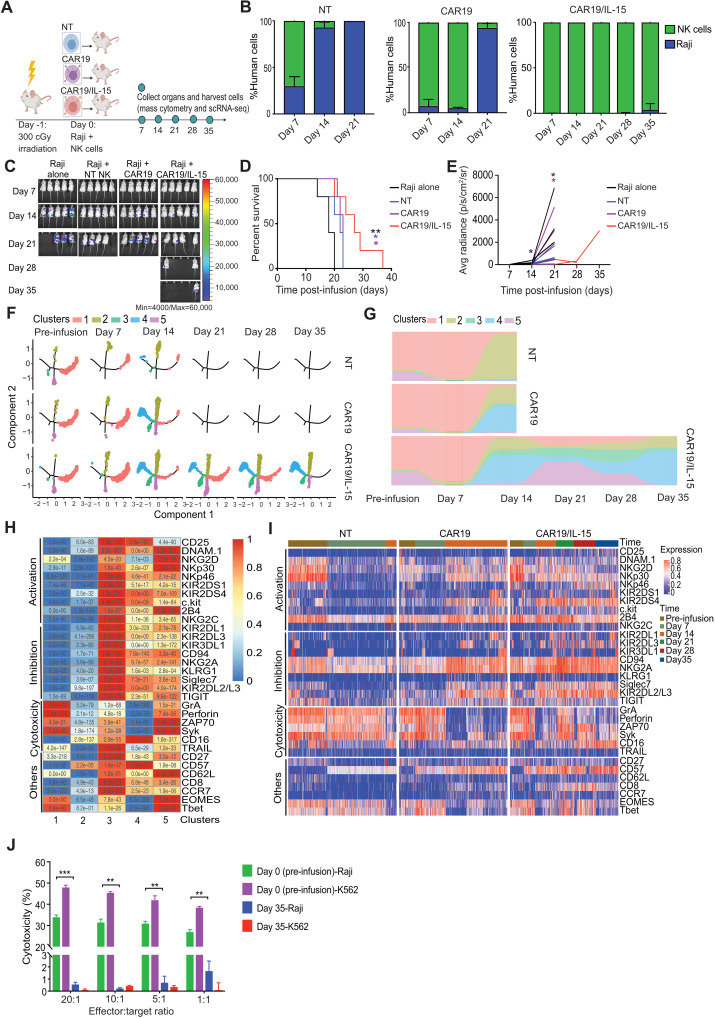
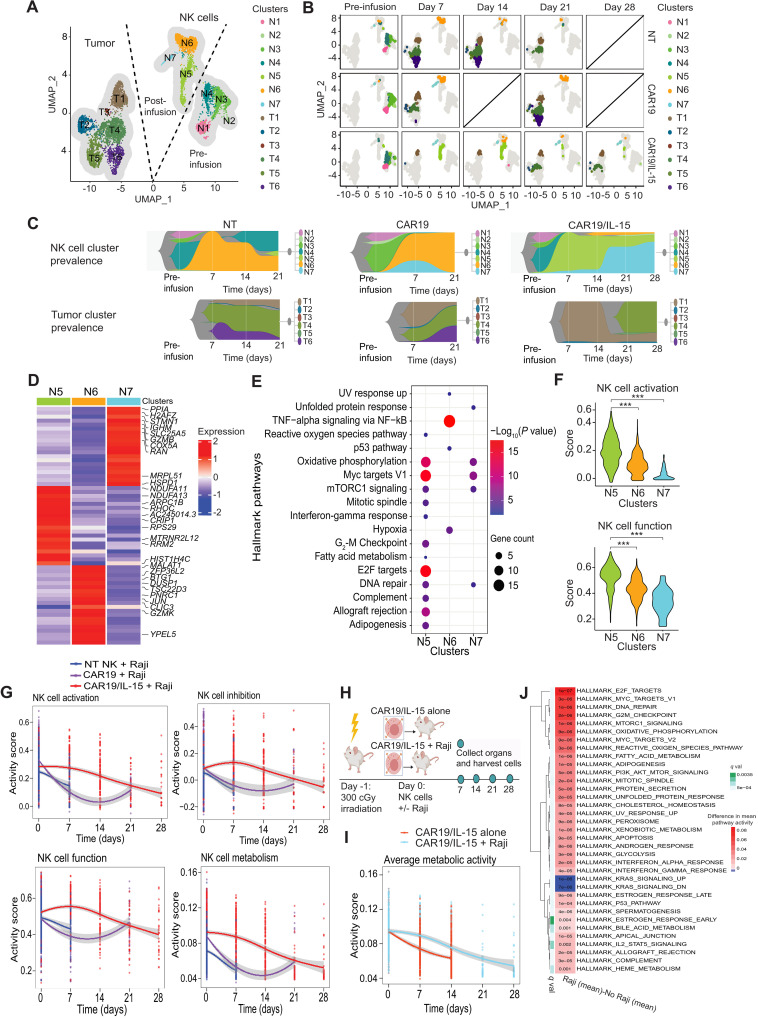
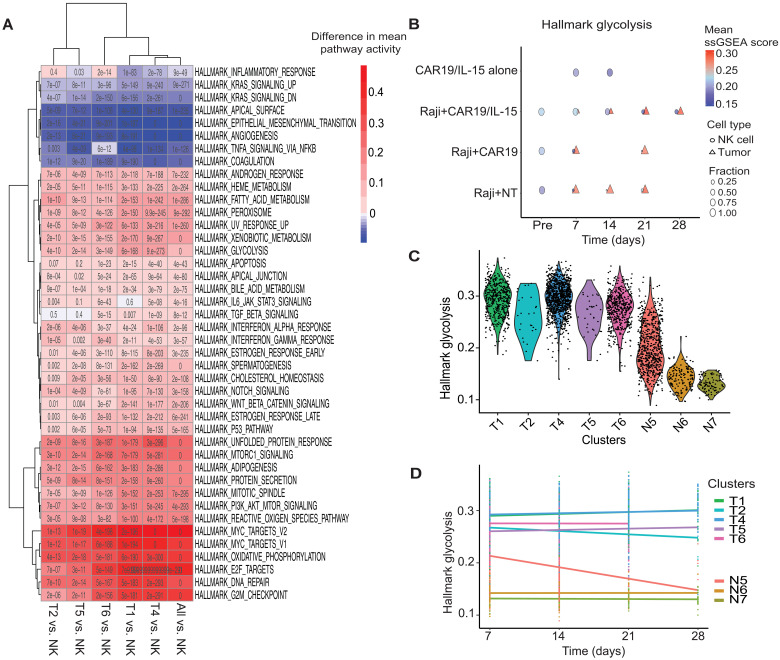
Chimeric antigen receptor (CAR) engineering of natural killer (NK) cells is promising, with early-phase clinical studies showing encouraging responses. However, the transcriptional signatures that control the fate of CAR-NK cells after infusion and factors that influence tumor control remain poorly understood. We performed single-cell RNA sequencing and mass cytometry to study the heterogeneity of CAR-NK cells and their in vivo evolution after adoptive transfer, from the phase of tumor control to relapse. Using a preclinical model of noncurative lymphoma and samples from a responder and a nonresponder patient treated with CAR19/IL-15 NK cells, we observed the emergence of NK cell clusters with distinct patterns of activation, function, and metabolic signature associated with different phases of in vivo evolution and tumor control. Interaction with the highly metabolically active tumor resulted in loss of metabolic fitness in NK cells that could be partly overcome by incorporation of IL-15 in the CAR construct.


Figures

Fig. 1.
Fig. 1.. CAR-NK cells have a distinct single-cell transcriptome and metabolic profile.
(A) Schematic of vectors used to transduce CB-NK cells. (B) UMAP visualizing transcriptional clusters of NK cells across products. (C) Pie charts showing the relative proportions of the NK cell clusters. (D) Top up-regulated genes in each of the four NK cell clusters. Columns correspond to cells, and rows correspond to genes. Color represents Z-transformed expression. (E and F) Hallmark pathways enriched (Fisher’s test adjusted P value < 0.01) in genes up-regulated in NK cell clusters (E) or NK cell products (F). Color scale corresponds to −log10 transformed false discovery rate (FDR)–adjusted P values. (G) ECAR measured by Seahorse assays for NK cell products alone (dashed lines) or after coculture with Raji cells for 2 hours and then purified (solid lines). Bar graphs in the right panel summarize their glycolytic capacity. A representative graph of three independent experiments is shown. (H) 51Cr-release assay of NK cell products against K562 (left) and Raji (right) targets (n = 3 donors). Purple asterisks: CAR19/IL-15 versus CAR19 NK cells. Green asterisks: CAR19/IL-15 versus IL-15 NK cells. Blue asterisks: CAR19/IL-15 versus NT NK cells. The error bars represent mean values with SD. *P ≤ 0.05; **P ≤ 0.01; n.s., not significant. The statistical significance was determined by paired t test in (G) and (H).
Fig. 2.
Fig. 2.. IL-15 promotes the persistence of CAR-NK cells in vivo.
(A) Schematic timeline of experiments (n = 13 to 15 mice per group; 5 mice were followed for survival and 8 to 10 were assigned for single-cell analyses; 2 mice per group were sacrificed at each time point). (B) Bar plots of NK and Raji cell percentages in samples collected at multiple time points from mice treated with NT, CAR19, or CAR19/IL-15 NK cells. (C) Bioluminescence imaging (n = 5 mice per group). Kaplan-Meier plots (D) showing mice survival and average radiance (E). Black asterisks: Raji alone versus CAR19/IL-15. Blue asterisks: NT versus CAR19/IL-15. Purple asterisks: CAR19 versus CAR19/IL-15. (F) Trajectory evolution of NK cell products from pre-infusion (day 0) to day 35 post-infusion (n = 8 mice per group, 2 mice analyzed at each time point). No data were available at days 21 to 35 in NT and CAR19 groups due to limited in vivo persistence. (G) Relative proportion of NK cell clusters. (H) Heatmap showing the average expression levels of the proteomic markers for the five clusters. P values in each square were calculated using unpaired t test by comparing the levels of marker abundance for cells in their cluster versus cells from all other cluster. (I) Heatmap of protein expression at different time points across products. (J) 51Cr-release assay of CAR19/IL-15 day 0 or 35 days after infusion against K562 or Raji. *P ≤ 0.05; **P ≤ 0.01; ***P ≤ 0.001. The P values were determined by log-rank (Mantel-Cox; D) and unpaired t test in (E) and (J).
Fig. 3.
Fig. 3.. In vivo evolution of CAR-NK cells and Raji tumor.
(A) UMAP visualizing transcriptomic clusters of NK and Raji cells (n = 8 mice per group, 2 mice per group were sacrificed at each time point). (B) UMAP from (A) faceted by product and time point. Data are not available on day 14 (CAR19) or on day 28 (NT and CAR19) due to technical issues and limited in vivo persistence of NK cells. (C) Fish plots of NK and tumor cell clusters over time. (D) Z-transformed mean expression of top up-regulated genes in post-infusion clusters. (E) Hallmark pathway enriched in them (Fisher’s test adjusted P value < 0.01). (F) Violin plots of NK activation (top) and function (bottom) scores in post-infusion NK clusters. P value was calculated with Wilcoxon rank sum test. ***P < 0.01. (G) Trends in NK activation, inhibition, function, and metabolism across products before infusion (day 0) to day 28 after infusion. (H) Schematic of in vivo studies to test CAR19/IL-15 NK behavior in the presence or absence of tumor cells (n = 8 mice per group; 2 mice were sacrificed per time point per treatment group). (I) Pathway activity of the in vivo trend in NK cell metabolism for CAR19/IL-15 when exposed to Raji or not. (J) Heatmap of differential mean pathway activity (q < 0.01) between CAR19/IL-15 NK cells exposed or not to tumor. (G to I) The curves are the mean scores, and the shaded region is the 95% confidence interval of Student’s t-distribution at each data point.
Fig. 4.
Fig. 4.. Metabolic activity of CAR-NK cells and tumor cells in vivo.
(A) Heatmap of difference in pathway activity between indicated tumor and post-infusion NK cell clusters. Only pathways significantly dysregulated in at least one comparison are reported (q < 0.01; q values are reported in each cell). (B) Dot plots comparing pathway activity of glycolysis for tumor and NK cells in each product before infusion (Pre, day 0) and at days 7, 14, 21, and 28 after NK cell infusion. Significance of difference in pathway activity between NK and tumor cells at each time point, across products, was tested using Wilcoxon rank sum test and FDR-corrected (table S6). The color of a symbol indicates the mean pathway activity, and the size indicates the relative fraction of the cells. (C) Violin plots of glycolysis pathway activity across tumor and NK cell clusters. (D) Glycolysis pathway activity of the NK and tumor cell clusters across time. Linear regression was performed for each cell cluster. The slopes of the regression lines and P values are reported in table S7.
Fig. 5.
Fig. 5.. Trajectory analysis of NK cells.
(A) Trajectory of NK cells: colored by cluster membership (left) and pseudotime (right). The red arrows indicate the root nodes for the pre- and post-infusion trajectories (see Materials and Methods) relative to which pseudotime is computed. (B) Boxplot of pseudotime of NK clusters N5 and N6 that form the post-infusion trajectory; P value reported was computed using Wilcoxon rank sum test. (C) Trajectory plots split by NK cell product. (D) Violin plots showing the distribution pseudotime in pre- and post-infusion NK cells by groups. Differences in pseudo-time between groups in both pre- and post-infusion cells was significantly different [analysis of variance (ANOVA), P < 2 × 10⁻¹⁶ by a pairwise Tukey’s test reported in fig. S8]. (E) Hallmark pathways enriched in genes overexpressed in the low and high N5 cells (P < 0.05 and q < 0.1, respectively).
Fig. 6.
Fig. 6.. Improvement of CAR-NK cell antitumor activity following two infusions of CAR19/IL-15 NK cells.
(A) Schematic of the in vivo studies testing the two infusion treatment protocols [n = 15 mice per group; 5 mice were followed for survival and 10 mice were assigned for single-cell analyses; 2 mice per group were sacrificed at each time point (days 14, 21, 28, 35, and 61)]. (B) Bioluminescent imaging (n = 5 mice per group). The average radiance (C) and Kaplan-Meier plots showing the probability of survival (D) for the three groups of mice. *P ≤ 0.05 and **P ≤ 0.01. Black asterisks: Raji alone versus CAR19/IL-15. Blue asterisk: NT versus CAR19/IL-15. P values were determined by log-rank (Mantel-Cox, C) and unpaired t test (D). (E) UMAP plot showing the cell population change over time from mass cytometry analysis of the CAR19/IL-15 NK cells derived from the first donor infusion (HLA-A3+; red) and the second donor infusion (HLA-A2+; blue) (n = 10 mice per group; n = 2 mice per time point). Pie charts show the relative proportions of the first donor infusion (red) and the second donor infusion (blue). (F) Heatmap showing the mass cytometry proteomic marker abundance level in the first and the second infusion at different time points. The middle panel shows the FC between the first and second infusion. Brown bars represent higher expression in the second infusion; gray bars indicate higher expression in the first infusion. *P ≤ 0.05 and log10(FC) > 0.25.
Fig. 7.
Fig. 7.. Patient response to one infusion of CAR-NK cell therapy.
(A) Positron emission tomography (PET) scans from two patients with lymphoid malignancies before (Pre-infusion) and 1 month after receiving one dose of CAR19/IL-15 NK cell infusion. (B) UMAP showing the distribution of two transcriptomic clusters of cells from patient scRNA-seq data. Cluster 1 contained 60 NK cells, including 17 from patient 10 and 43 from patient 6. Cluster 2 contained 30 B cells from patient 10. (C) Dot plot showing the mRNA expression levels for the two patient clusters. The size of the dots represents the percentage of cells expressing the gene, and the color represents its average expression. (D and E) Heatmaps of scRNA-seq data showing the top 15 and bottom 15 genes ranked by log FC between patients 6 and 10 at days 7 and 14 after NK cell infusion. The color bar represents the significance of both P values and adjusted P values. The asterisks were added if P value/adjusted P value < 0.05. (F) Dot plots showing significantly activated (left panel) and suppressed (right panel) hallmark pathways in the NK cells in patient 6 at day 14 versus those in patient 10 at day 14 (see Materials and Methods).

References

    1. S. S. Neelapu, F. L. Locke, N. L. Bartlett, L. J. Lekakis, D. B. Miklos, C. A. Jacobson, I. Braunschweig, O. O. Oluwole, T. Siddiqi, Y. Lin, J. M. Timmerman, P. J. Stiff, J. W. Friedberg, I. W. Flinn, A. Goy, B. T. Hill, M. R. Smith, A. Deol, U. Farooq, P. McSweeney, J. Munoz, I. Avivi, J. E. Castro, J. R. Westin, J. C. Chavez, A. Ghobadi, K. V. Komanduri, R. Levy, E. D. Jacobsen, T. E. Witzig, P. Reagan, A. Bot, J. Rossi, L. Navale, Y. Jiang, J. Aycock, M. Elias, D. Chang, J. Wiezorek, W. Y. Go, Axicabtagene ciloleucel CAR T-cell therapy in refractory large B-cell lymphoma. N. Engl. J. Med. 377, 2531–2544 (2017). - PMC - PubMed
    1. S. J. Schuster, M. R. Bishop, C. S. Tam, E. K. Waller, P. Borchmann, J. P. McGuirk, U. Jäger, S. Jaglowski, C. Andreadis, J. R. Westin, I. Fleury, V. Bachanova, S. R. Foley, P. J. Ho, S. Mielke, J. M. Magenau, H. Holte, S. Pantano, L. B. Pacaud, R. Awasthi, J. Chu, Ö. Anak, G. Salles, R. T. Maziarz, Tisagenlecleucel in adult relapsed or refractory diffuse large B-cell lymphoma. N. Engl. J. Med. 380, 45–56 (2019). - PubMed
    1. S. L. Maude, T. W. Laetsch, J. Buechner, S. Rives, M. Boyer, H. Bittencourt, P. Bader, M. R. Verneris, H. E. Stefanski, G. D. Myers, M. Qayed, B. de Moerloose, H. Hiramatsu, K. Schlis, K. L. Davis, P. L. Martin, E. R. Nemecek, G. A. Yanik, C. Peters, A. Baruchel, N. Boissel, F. Mechinaud, A. Balduzzi, J. Krueger, C. H. June, B. L. Levine, P. Wood, T. Taran, M. Leung, K. T. Mueller, Y. Zhang, K. Sen, D. Lebwohl, M. A. Pulsipher, S. A. Grupp, Tisagenlecleucel in children and young adults with B-cell lymphoblastic leukemia. N. Engl. J. Med. 378, 439–448 (2018). - PMC - PubMed
    1. J. H. Park, I. Rivière, M. Gonen, X. Wang, B. Sénéchal, K. J. Curran, C. Sauter, Y. Wang, B. Santomasso, E. Mead, M. Roshal, P. Maslak, M. Davila, R. J. Brentjens, M. Sadelain, Long-term follow-up of CD19 CAR therapy in acute lymphoblastic leukemia. N. Engl. J. Med. 378, 449–459 (2018). - PMC - PubMed
    1. D. L. Porter, B. L. Levine, M. Kalos, A. Bagg, C. H. June, Chimeric antigen receptor-modified T cells in chronic lymphoid leukemia. N. Engl. J. Med. 365, 725–733 (2011). - PMC - PubMed

LinkOut - more resources