. 2023 Jul 28;9(30):eadg2829.
doi: 10.1126/sciadv.adg2829. Epub 2023 Jul 26.

Cleavage of cFLIP restrains cell death during viral infection and tissue injury and favors tissue repair

Affiliations

Cleavage of cFLIP restrains cell death during viral infection and tissue injury and favors tissue repair

Kristel Martinez Lagunas et al. Sci Adv. .

Abstract

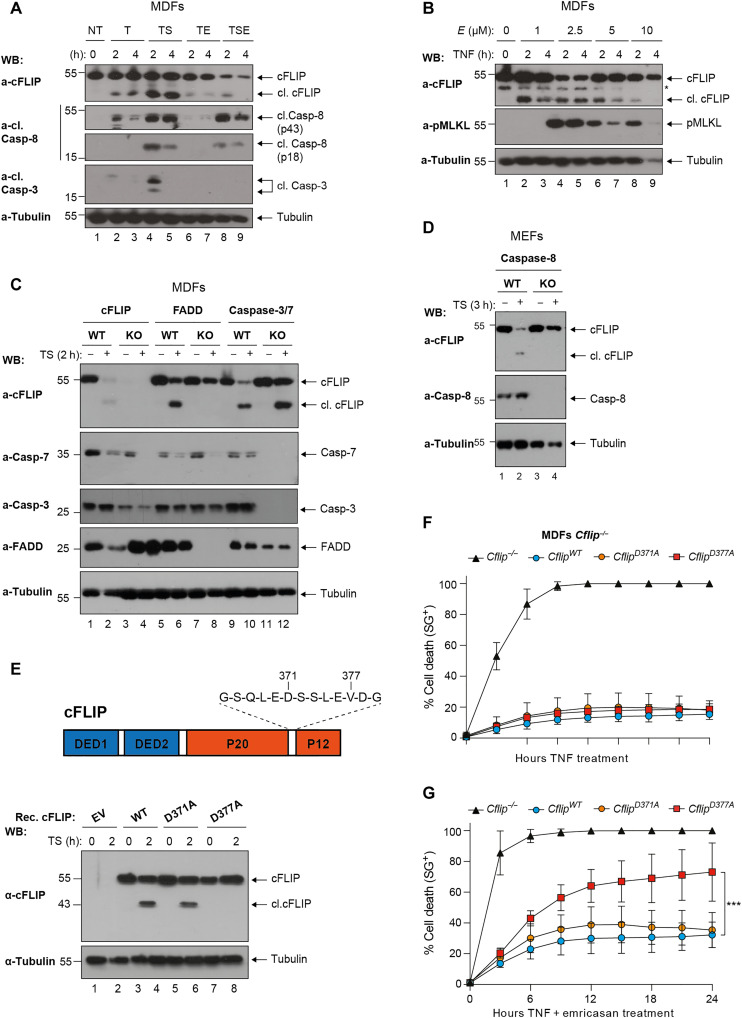
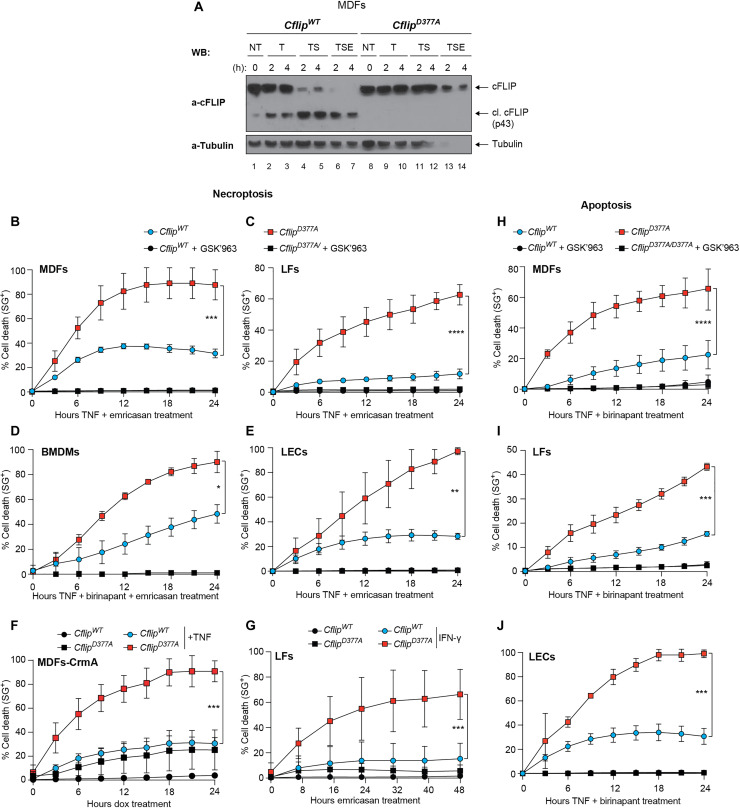
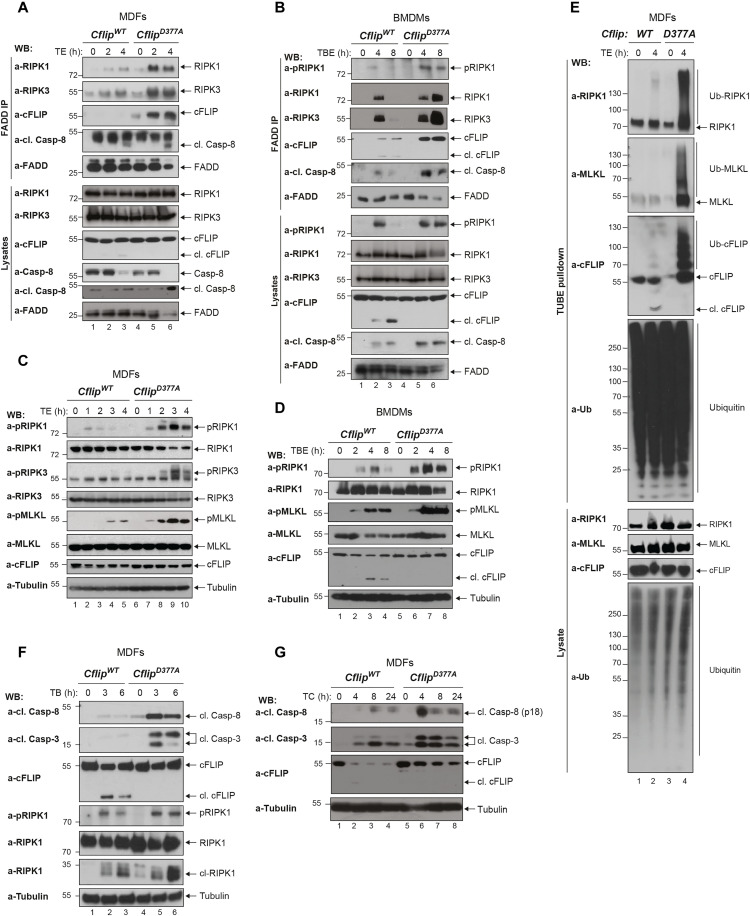
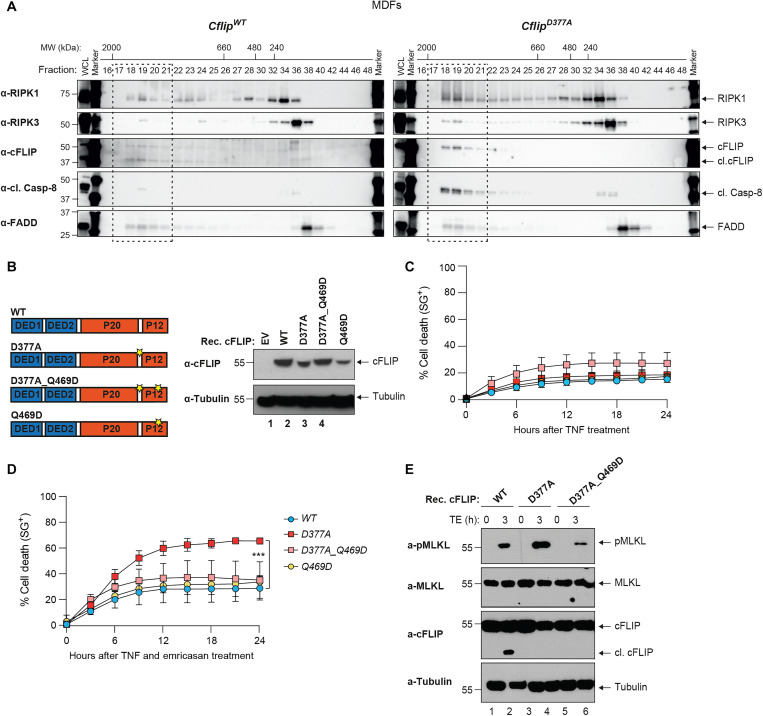
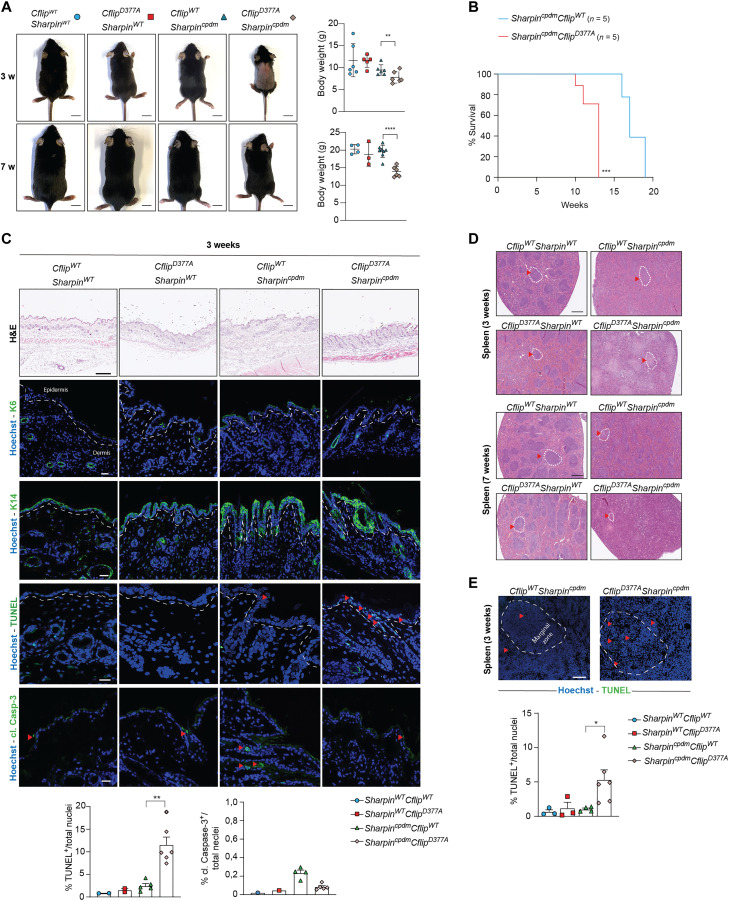
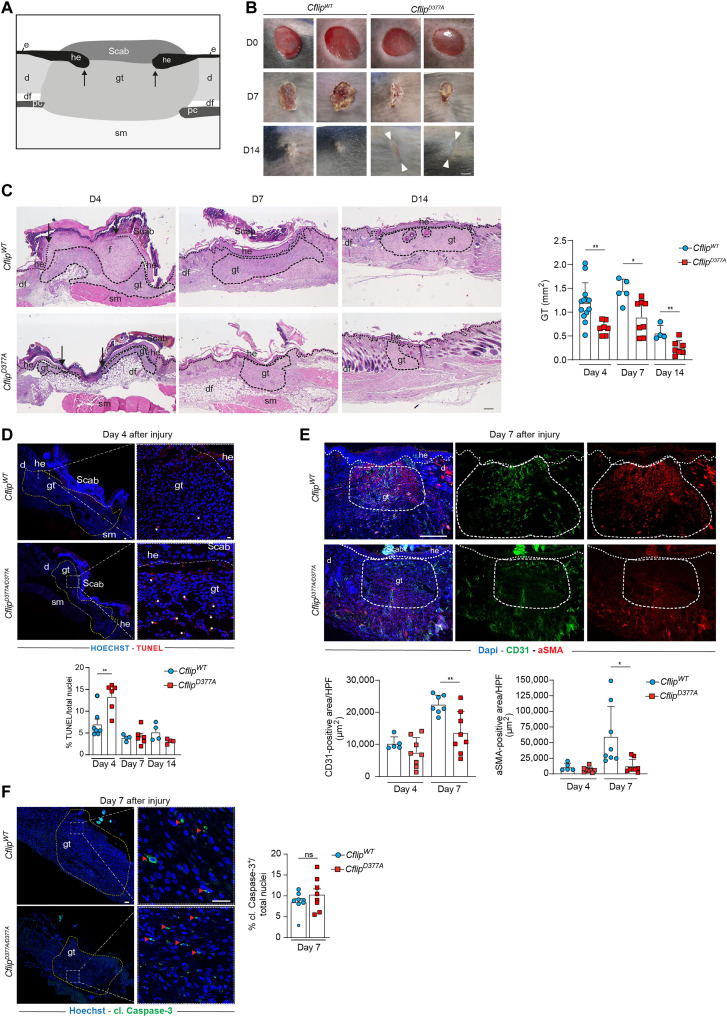
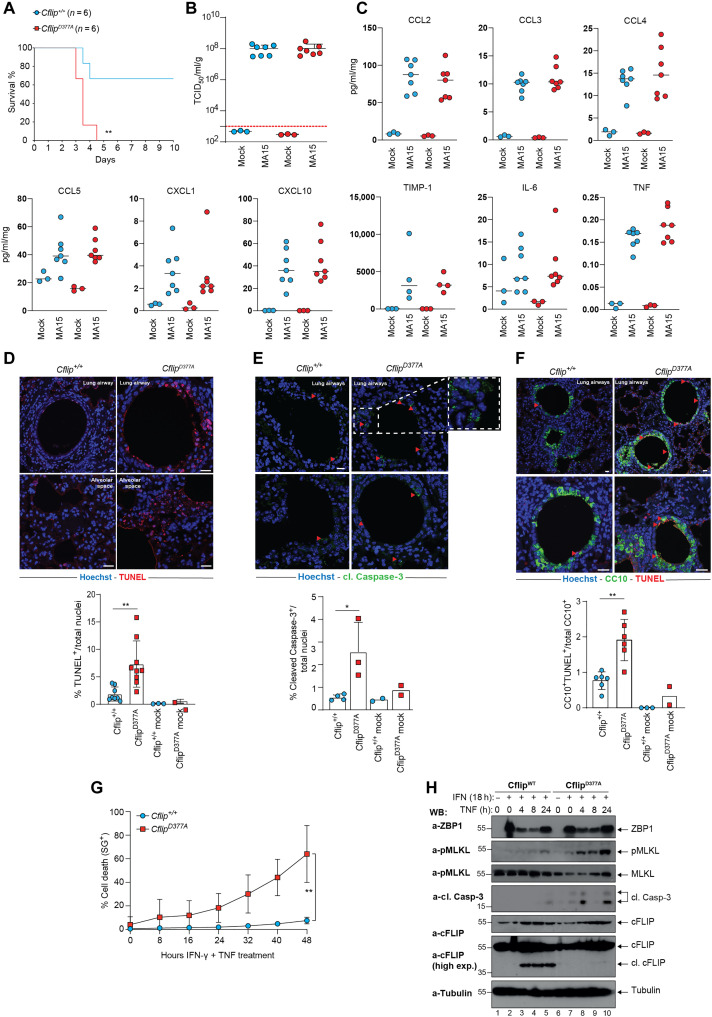
Cell death coordinates repair programs following pathogen attack and tissue injury. However, aberrant cell death can interfere with such programs and cause organ failure. Cellular FLICE-like inhibitory protein (cFLIP) is a crucial regulator of cell death and a substrate of Caspase-8. However, the physiological role of cFLIP cleavage by Caspase-8 remains elusive. Here, we found an essential role for cFLIP cleavage in restraining cell death in different pathophysiological scenarios. Mice expressing a cleavage-resistant cFLIP mutant, CflipD377A, exhibited increased sensitivity to severe acute respiratory syndrome coronavirus (SARS-CoV)-induced lethality, impaired skin wound healing, and increased tissue damage caused by Sharpin deficiency. In vitro, abrogation of cFLIP cleavage sensitizes cells to tumor necrosis factor(TNF)-induced necroptosis and apoptosis by favoring complex-II formation. Mechanistically, the cell death-sensitizing effect of the D377A mutation depends on glutamine-469. These results reveal a crucial role for cFLIP cleavage in controlling the amplitude of cell death responses occurring upon tissue stress to ensure the execution of repair programs.


Figures

Fig. 1.
Fig. 1.. cFLIP is cleaved at D377 following TNFR1 activation.
(A) WT MDFs were treated with TNF (T: 100 ng/ml), TNF and Smac mimetic (TS, S:250 nM), TNF and emricasan (TE, E:1 μM) and TNF, Smac mimetic and emricasan (TSE) for the indicated time points. Cell lysates were analyzed by immunoblotting for the indicated specific antibodies (n = 2). WB, Western blot. (B) WT MDFs were treated with TNF (100 ng/ml) and increasing concentration of emricasan for the indicated time points. Cell lysates were analyzed by immunoblotting with the indicated specific antibodies (n = 3). The asterisk (*) indicates a nonspecific band. (C) MDFs and (D) mouse embryonic fibroblasts (MEFs) of the indicated genotypes were treated with TNF (100 ng/ml) and Smac mimetics (250 nM) for 2 hours, and cell lysates were analyzed by immunoblotting with the indicated specific antibodies (n = 2). KO, knockout. (E) Cartoon depicting cFLIP domain composition and D371 and D377 (top). Cflip−/− MDFs were reconstituted either with empty virus or virus expressing WT or the indicated mutant versions of cFLIP and treated with TNF (100 ng/ml) and Smac mimetic (250 nM) for 2 hours. Cell lysates were analyzed by immunoblotting with the indicated specific antibodies (n = 2). (F and G) Cells as in (E) were treated with TNF (10 ng/ml) alone (F) or in combination with emricasan (G) (1 μM), and cell death was measured over time by calculating the percentage of Sytox Green–positive cells (SG+) (n = 4). Data are presented as means ± SD; **P < 0.01 (n = 4).
Fig. 2.
Fig. 2.. Cleavage-resistant cFLIP mutant sensitizes to TNF-induced necroptosis and apoptosis.
(A) CflipWT and CflipD377A MDFs were treated as indicated [TNF (100 ng/ml), emricasan (1 μg/ml), and birinapant (250 nM)], and cell lysates were analyzed by immunoblotting using the indicated specific antibodies (n = 2). (B) WT and D377A mutant MDFs, (C) LFs, (D) BMDMs and (E) LECs were treated with TNF and emricasan (MDFs, LFs, and LECs) or TNF, birinapant, and emricasan (BMDMs) in the presence or not of the RIPK1-specific inhibitor GSK’963 (100 nM), and cell death was measured over time by calculating the percentage of Sytox Green–positive cells. For MDFs, TNF (1 ng/ml) and 1 μM emricasan (n = 6), for LFs, TNF (10 ng/ml) and 1 μM emricasan (n = 4) and for BMDMs and LECs, TNF (10 ng/ml), 250 nM birinapant, and 1 μM emricasan (n = 5 and n = 3, respectively). (F) CflipWT and CflipD377A MDFs stably expressing a doxycycline-inducible HA-tagged CrmA construct were treated for 48 hours with doxycycline (1 μg/ml) and then treated or not with TNF (100 ng/ml). Cell death was measured as in (B) to (E) (n = 3). (G) WT and D377A mutant LFs were pretreated with IFN-γ for 18 hours and then subjected to emricasan (1 μm) treatment. Cell death was measured as in (B) to (E) (n = 3). (H) WT and D377A mutant MDFs, (I) LFs, and (J) LECs were treated with TNF and birinapant in the presence or not of the RIPK1-specific inhibitor GSK’963 (100 nM), and cell death was measured over time by calculating the percentage of Sytox Green–positive cells. For MDFs, LFs, and LECs, TNF (10 ng/ml) and 250 nM birinapant, n = 4. Data are presented as means ± SD; *P ≤ 0.05, **P ≤ 0.01, ***P ≤ 0.001, and ****P ≤ 0.0001.
Fig. 3.
Fig. 3.. The D377A mutation enhances complex-II formation, independently of NF-κB.
(A) WT and D377A mutant MDFs and (B) BMDMs were treated with TNF (1 ng/ml) and emricasan (1 μg/ml) and TNF (1 ng/ml), birinapant (250 nM), and emricasan (1 μg/ml), respectively, for the indicated time points. Cell lysates were subjected to immunoprecipitation using a FADD-specific antibody. Immunocomplexes and cellular lysates were then analyzed by immunoblotting using the indicated specific antibodies (n = 3). (C) MDFs and (D) BMDMs were treated as in (A) and (B) for the indicated time points. Cell lysates were analyzed by immunoblotting using the indicated specific antibodies (n = 2). (E) MDFs were treated with TNF (10 ng/ml) and emricasan (1 μg/ml), and cell lysates were subjected to TUBE pull-down, followed by immunoblotting analysis with the indicated specific antibodies (n = 3). (F) WT and D377A mutant MDFs were treated with TNF (10 ng/ml) and birinapant (250 nM) or (G) TNF (10 ng/ml) and cycloheximide (1 μg/ml) for the indicated time points, and cell lysates were immunoblotted using the indicated specific antibodies (n = 2).
Fig. 4.
Fig. 4.. cFLIP cleavage counteracts complex-II formation.
(A) CflipWT and CflipD377A MDFs were treated with TNF (10 ng/ml), Smac mimetic (250 nM), and emricasan (1 μg/ml) for 4 hours, and lysates were separated on a Superose 6 size exclusion column. Aliquots from each fraction were retained and analyzed by immunoblotting with the indicated specific antibodies. (B) Cartoon depicting cFLIP domain composition and position of the D377 and Q469 residues (left). Immunoblotting analysis of Cflip−/− MDFs reconstituted with the indicated cFLIP constructs via lentiviral infection or with an empty lentivirus (EV). cFLIP- and tubulin-specific antibodies were used (right). (C and D) Cflip−/− MDFs reconstituted as in (B) were treated with TNF (10 ng/ml) (C) or TNF (1 ng/ml) and emricasan (1 μg/ml) (D) and cell death was measured over time by calculating the percentage of Sytox Green–positive cells (n = 3). (E) MDFs Cflip−/− MDFs reconstituted as in (C) and treated as in (D) for 3 hours. Cell lysates were analyzed by immunoblotting with the indicated specific antibodies.
Fig. 5.
Fig. 5.. Abrogation of cFLIP cleavage exacerbates the phenotype of Sharpin mutant mice.
(A) Pictures (left) and body weight (right) of 3- and 7-week-old CflipWTSharpinWT, CflipD377ASharpinWT, CflipWTSharpincpdm, and CflipD377ASharpincpdm mice. Each symbol corresponds to one mouse. Scale bars, 1 cm. Data are presented as means ± SD; **P < 0.01, ****P < 0.0001. (B) Kaplan-Meier survival curve of CflipWTSharpincpdm and CflipD377ASharpincpdm mice. The mice were euthanized when the termination criteria, based on the severity of dermatitis, were reached. ***P < 0.001. (C) Representative skin sections of 3-week-old mice of the indicated genotypes stained with H&E, K6, K14, cleaved Caspase-3, and TUNEL. Nuclei were stained with Hoechst. White dashed lines separate the epidermis from the dermis. Red arrowheads indicate TUNEL- and cleaved Caspase-3–positive cells. The graphics represent the percentage of TUNEL- and cleaved Caspase-3–positive cells over the total number of cells. Data are presented as means ± SD; **P < 0.01. Scale bars 20 μm. (D) Representative images of spleen sections of 3- and 7-week-old mice of the indicated genotypes [as in (A)] stained with H&E. Scale bars, 500 μm. Dotted circles and red arrowheads indicate marginal zones. (E) Representative pictures of TUNEL staining of spleen sections of 3-weeks-old mice of the indicted genotypes (top) and the relative quantification (bottom) expressed as percentage of TUNEL-positive cells over the total number of cells. Hoechst stains nuclei. Red arrowheads indicate TUNEL-positive cells. Data are presented as means ± SD; *P < 0.05. Scale bars, 100 μm.
Fig. 6.
Fig. 6.. CflipD377A mice exhibit impaired skin wound healing.
(A) Cartoon depicting a skin wound at around 4 dpi (days post-injury), where the following skin areas are marked: d, dermis; df, dermal fat tissue; e, epidermis; gt, granulation tissue; he, hyperproliferative epithelium; pc, panniculus carnosus; sm, skeletal muscle. (B) Macroscopic pictures of wounds at 0, 7, and 14 dpi in CflipWT and CflipD377A mice. White arrowheads indicate scar tissue. Scale bar, 2 mm. (C) Representative H&E-stained wound sections (left) of CflipWT (top) and CflipD377A mice (bottom) at 4, 7, and 14 dpi. Scale bar, 200 μm. Arrows indicate the tips of the epithelial tongues. Quantitative analysis (right) of granulation tissue (gt) area of sections in (C) at 4, 7, and 14 dpi (n = 4 to 12 total wounds per genotype per dpi). (D) Representative TUNEL-stained wound sections (top) at 4 dpi of CflipWT mice and CflipD377A mice. Nuclei were stained with Hoechst (blue). Scale bars, 50 μm (left) and 20 μm (right). White asterisks indicate TUNEL-positive cells. Percentage of total TUNEL-positive cells (bottom) at 4, 7, and 14 dpi (n = 4 to 7 total wounds per genotype per dpi). (E) Representative CD31 (green) and α-SMA (red) immunostainings (top) at day 7 dpi of wound sections of CflipWT and CflipD377A mice. Scale bar, 200 μm. Percentage of total CD31- and α-SMA–positive area per HPF (high power field) in wound sections (bottom) at 4 and 7 dpi (n = 5 to 8 total wounds per genotype per dpi). (F) Representative cleaved Caspase-3–stained wound sections (left) at 7 dpi. Red arrowheads indicate cleaved Caspase-3–positive cells. Percentage of cleaved Caspase-3–positive cells (right) at 7 dpi (n = 4 to 7 total wounds per genotype per dpi). Data are presented as means ± SD; *P < 0.05 and **P < 0.01. ns, not significant.
Fig. 7.
Fig. 7.. CflipD377A mice are more sensitive to SARS-CoV–induced lethality.
(A) Survival curve of CflipWT and CflipD377A mice infected with SARS-Cov MA15 virus (n = 6). **P < 0.01. Viral titer (B) and cytokine levels (C) from lungs of CflipWT and CflipD377A mice at 3 dpi (n = 3 for mock infection and n = 7 for MA15 infection). (D) Representative TUNEL-stained lung sections of CflipWT mice and CflipD377A mice 3 dpi (top). Nuclei were stained with Hoechst (blue). Scale bars, 10 μm (top left) and 20 μm (top right and bottom). Percentage of total TUNEL-positive cells (bottom) (n = 8 for CflipWT-infected lungs, n = 10 CflipD377A-infected lungs, and n = 2–3 for mock infection). Data are presented as mean ± SD; **P < 0.01. (E) Representative pictures of lung sections of CflipWT and CflipD377A mice at 3 dpi, stained with cleaved Caspase-3 (top). Nuclei were stained with Hoechst (blue). Scale bar, 10 μm. Red arrowheads indicate cleaved Caspase-3–positive cells. Percentage of total cleaved Caspase-3–positive cells (bottom). Data are presented as means ± SD; *P < 0.05. (F) Representative CC10 (green)/TUNEL (red) double-stained lung sections of CflipWT mice and CflipD377A mice at 3 dpi (top). Nuclei were stained with Hoechst (blue). Scale bars, 10 μm (top) and 20 μm (bottom). Red arrowheads indicate TUNEL-positive/CC10-positive cells. Percentage of total CC10/TUNEL double-positive cells (bottom). (n = 6 for CflipWT infected lungs, n = 6 CflipD377A infected lungs, and n = 2 to 3 for mock infection). Data are presented as means ± SD; **P < 0.01. (G) CflipWT and CflipD377A LFs were pretreated with IFN-γ (100 nM) for 18 hours and then treated with TNF (100 ng/ml) for additional 24 hours. Cell death was measured over time by calculating the percentage of Sytox Green–positive cells (n = 3). (H) Total lysates of LFs treated like in (G) for the indicated times points were immunoblotted with the indicated specific antibodies (n = 2).

References

    1. A. Annibaldi, P. Meier, Checkpoints in TNF-induced cell death: Implications in inflammation and cancer. Trends Mol. Med. 24, 49–65 (2018). - PubMed
    1. J. Zinngrebe, E. Rieser, L. Taraborrelli, N. Peltzer, T. Hartwig, H. Ren, I. Kovács, C. Endres, P. Draber, M. Darding, S. von Karstedt, J. Lemke, B. Dome, M. Bergmann, B. J. Ferguson, H. Walczak, LUBAC deficiency perturbs TLR3 signaling to cause immunodeficiency and autoinflammation. J. Exp. Med. 213, 2671–2689 (2016). - PMC - PubMed
    1. T. Oltean, E. van San, T. Divert, T. vanden Berghe, X. Saelens, J. Maelfait, N. Takahashi, P. Vandenabeele, Viral dosing of influenza A infection reveals involvement of RIPK3 and FADD, but not MLKL. Cell Death Dis. 12, 471 (2021). - PMC - PubMed
    1. F. Balkwill, Tumour necrosis factor and cancer. Nat. Rev. Cancer 9, 361–371 (2009). - PubMed
    1. G. D. Kalliolias, L. B. Ivashkiv, TNF biology, pathogenic mechanisms and emerging therapeutic strategies. Nat. Rev. Rheumatol. 12, 49–62 (2016). - PMC - PubMed