. 2023 Jul 26;15(706):eadd1014.
doi: 10.1126/scitranslmed.add1014. Epub 2023 Jul 26.

Expression of the excitatory opsin ChRERα can be traced longitudinally in rat and nonhuman primate brains with PET imaging

Affiliations

Expression of the excitatory opsin ChRERα can be traced longitudinally in rat and nonhuman primate brains with PET imaging

Jordi Bonaventura et al. Sci Transl Med. .

Abstract

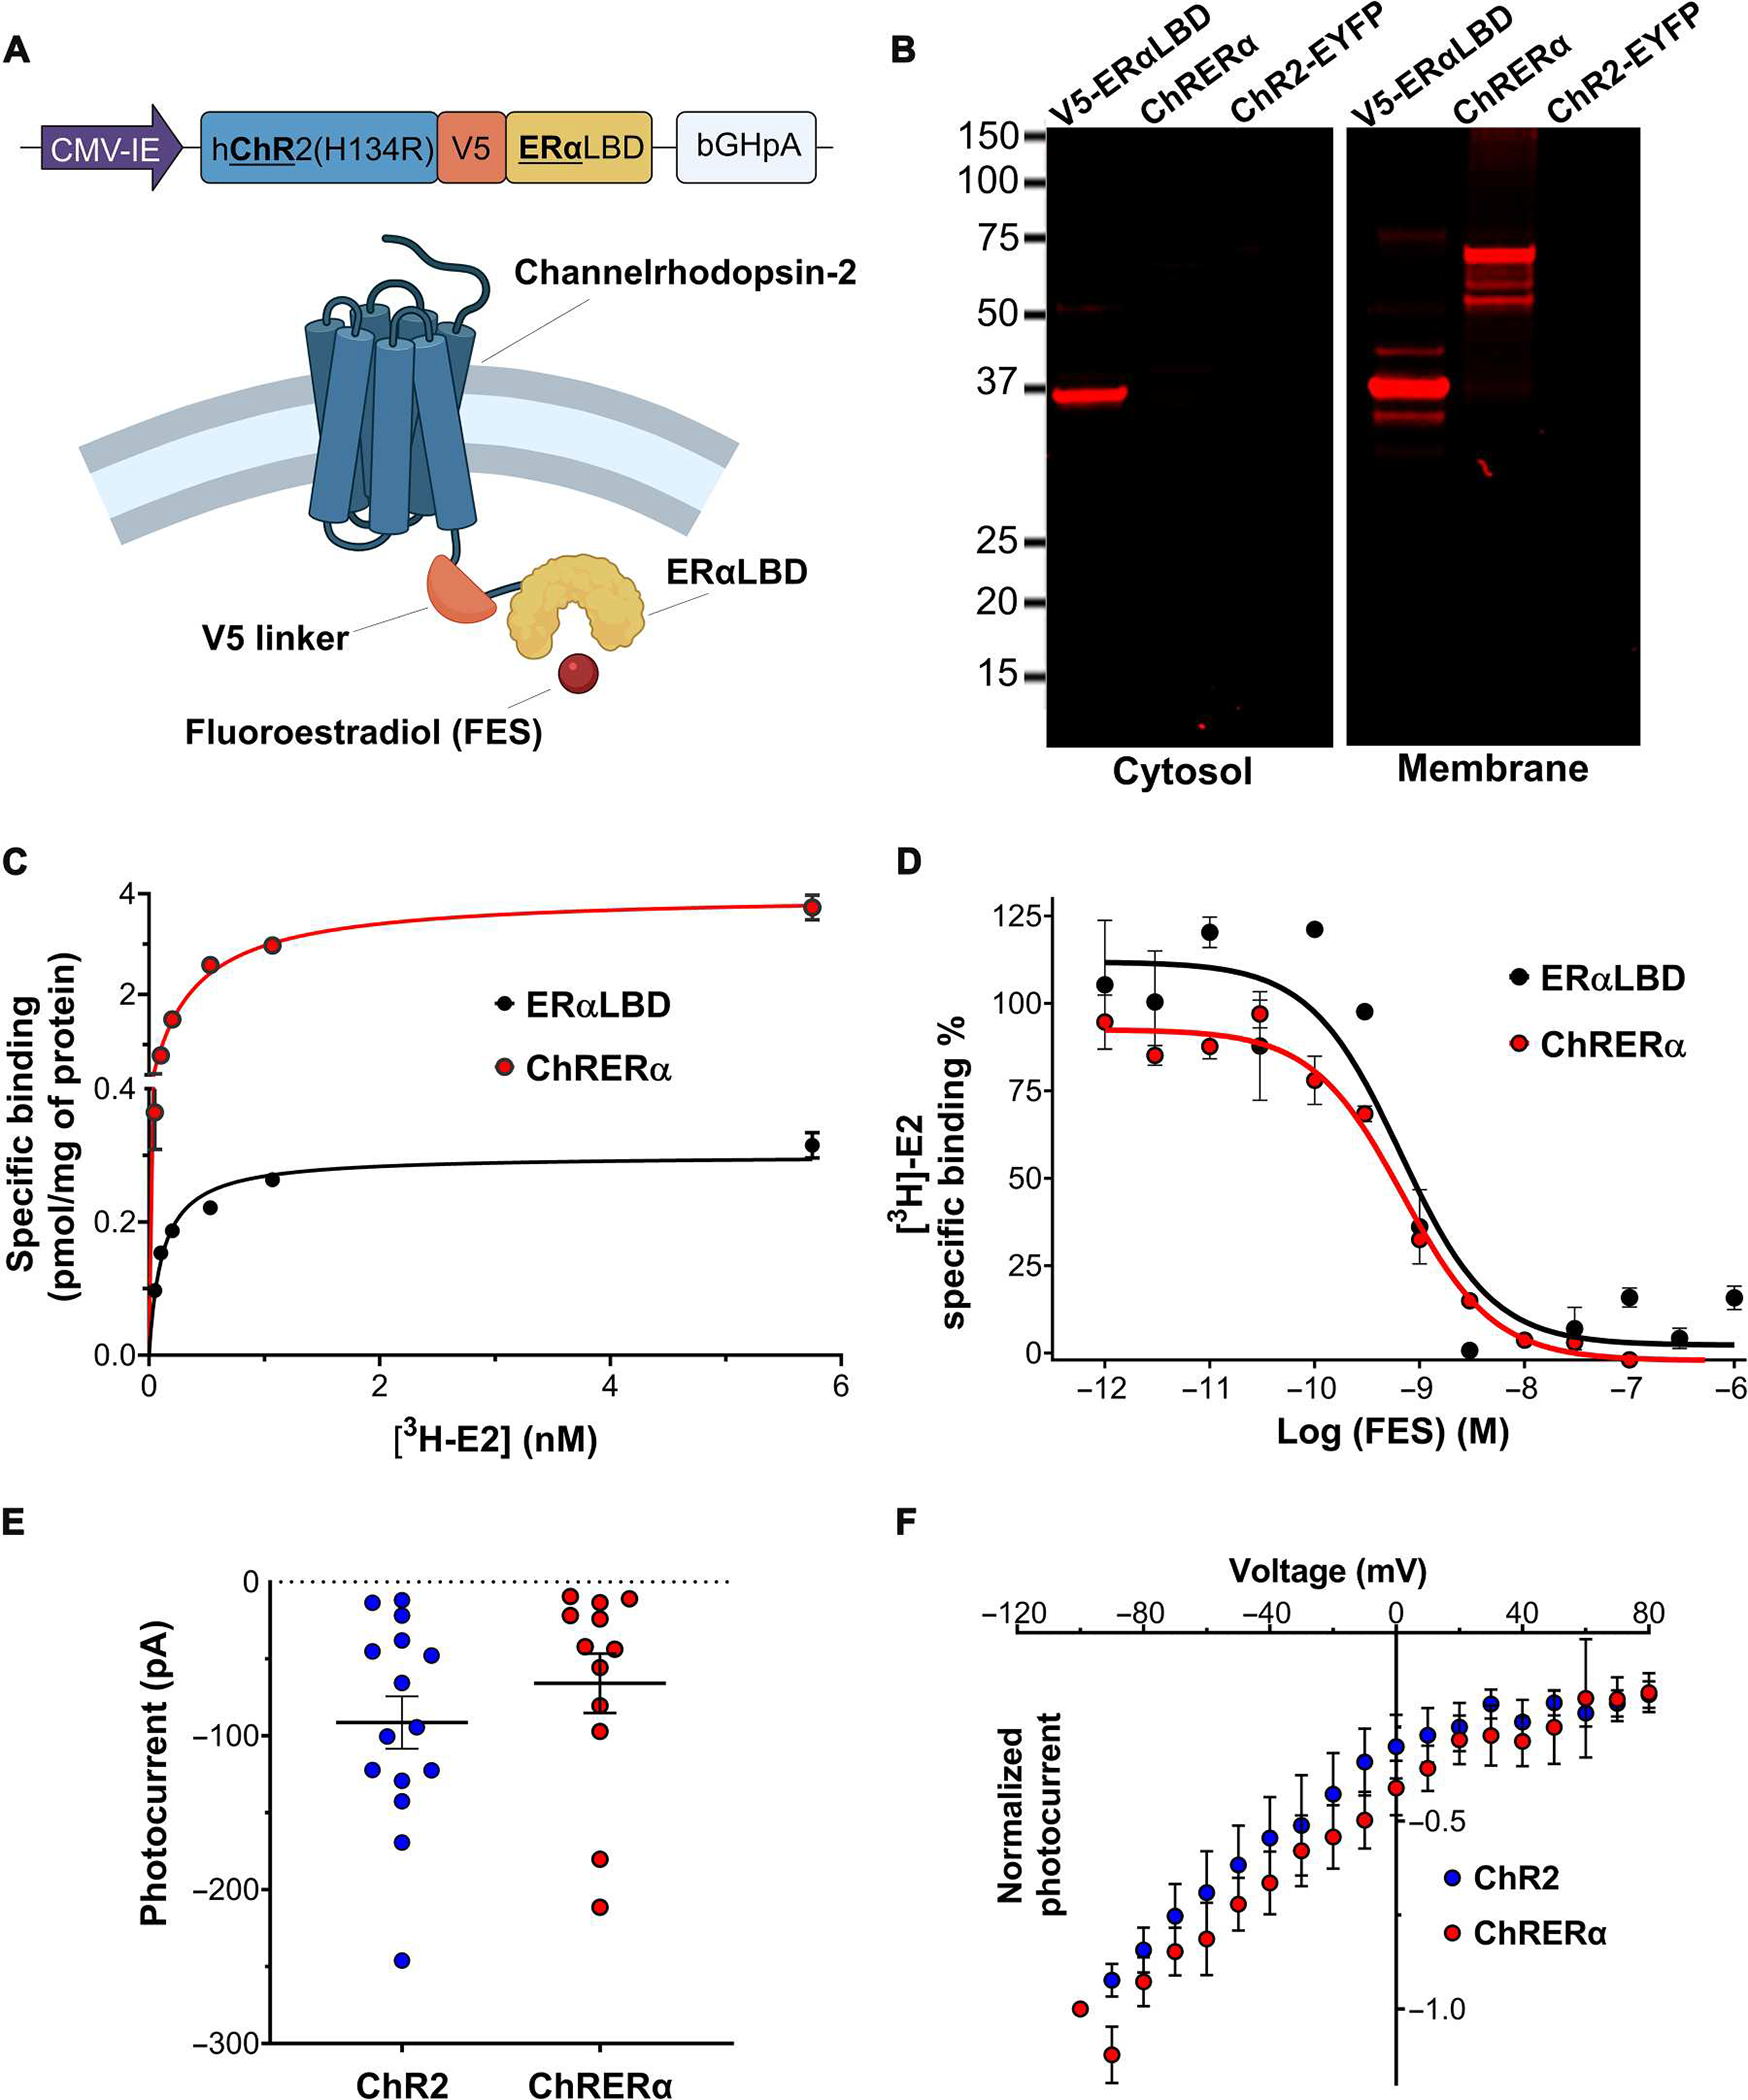
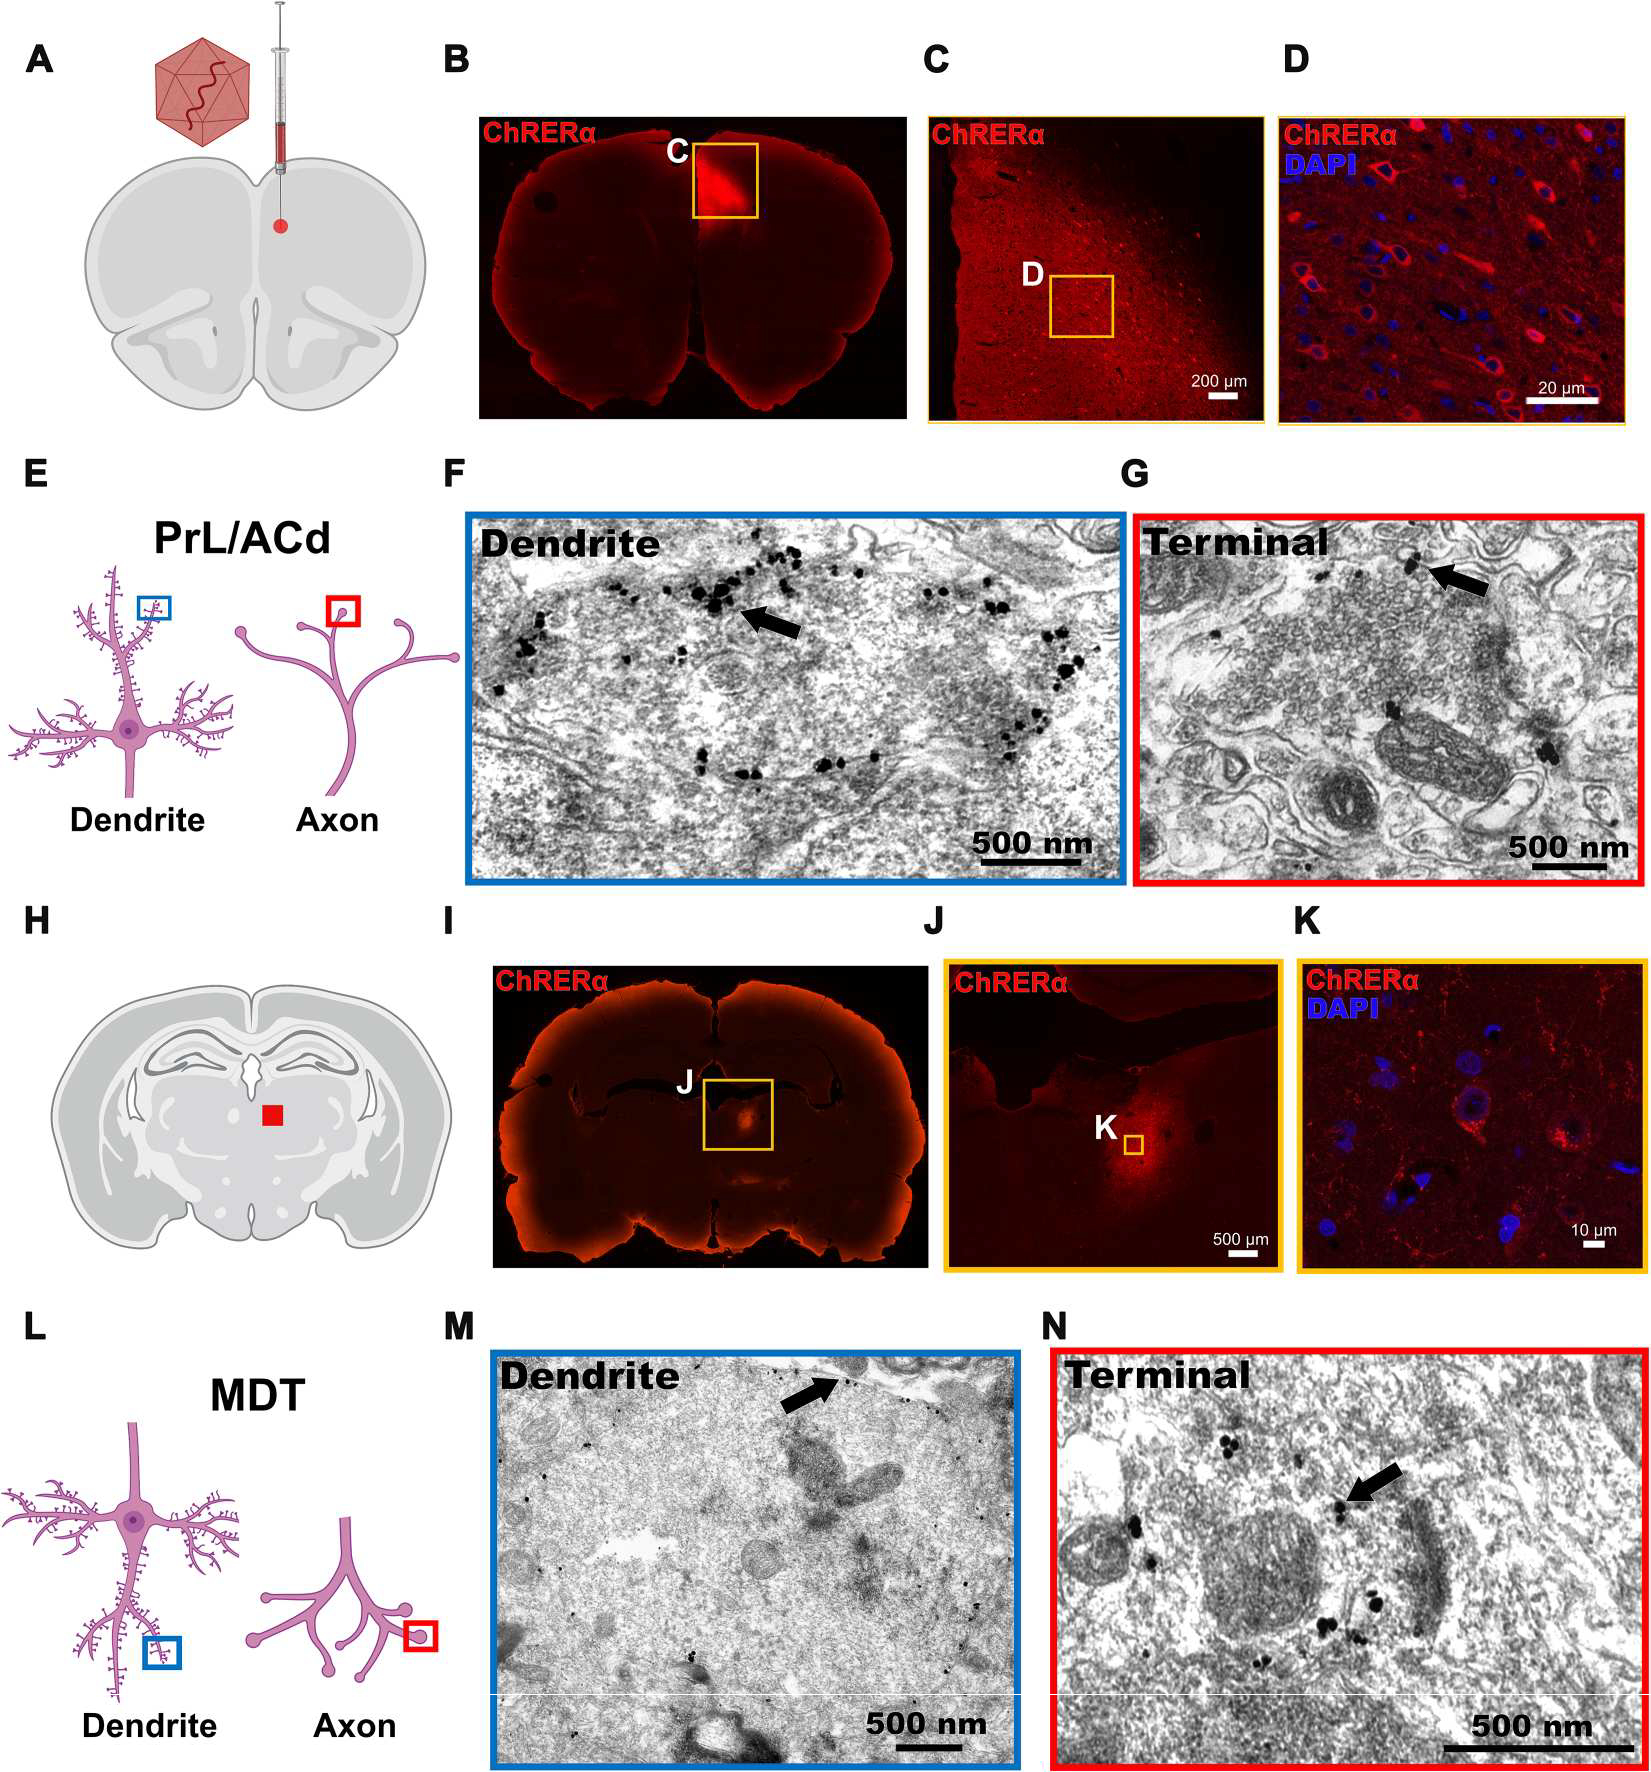
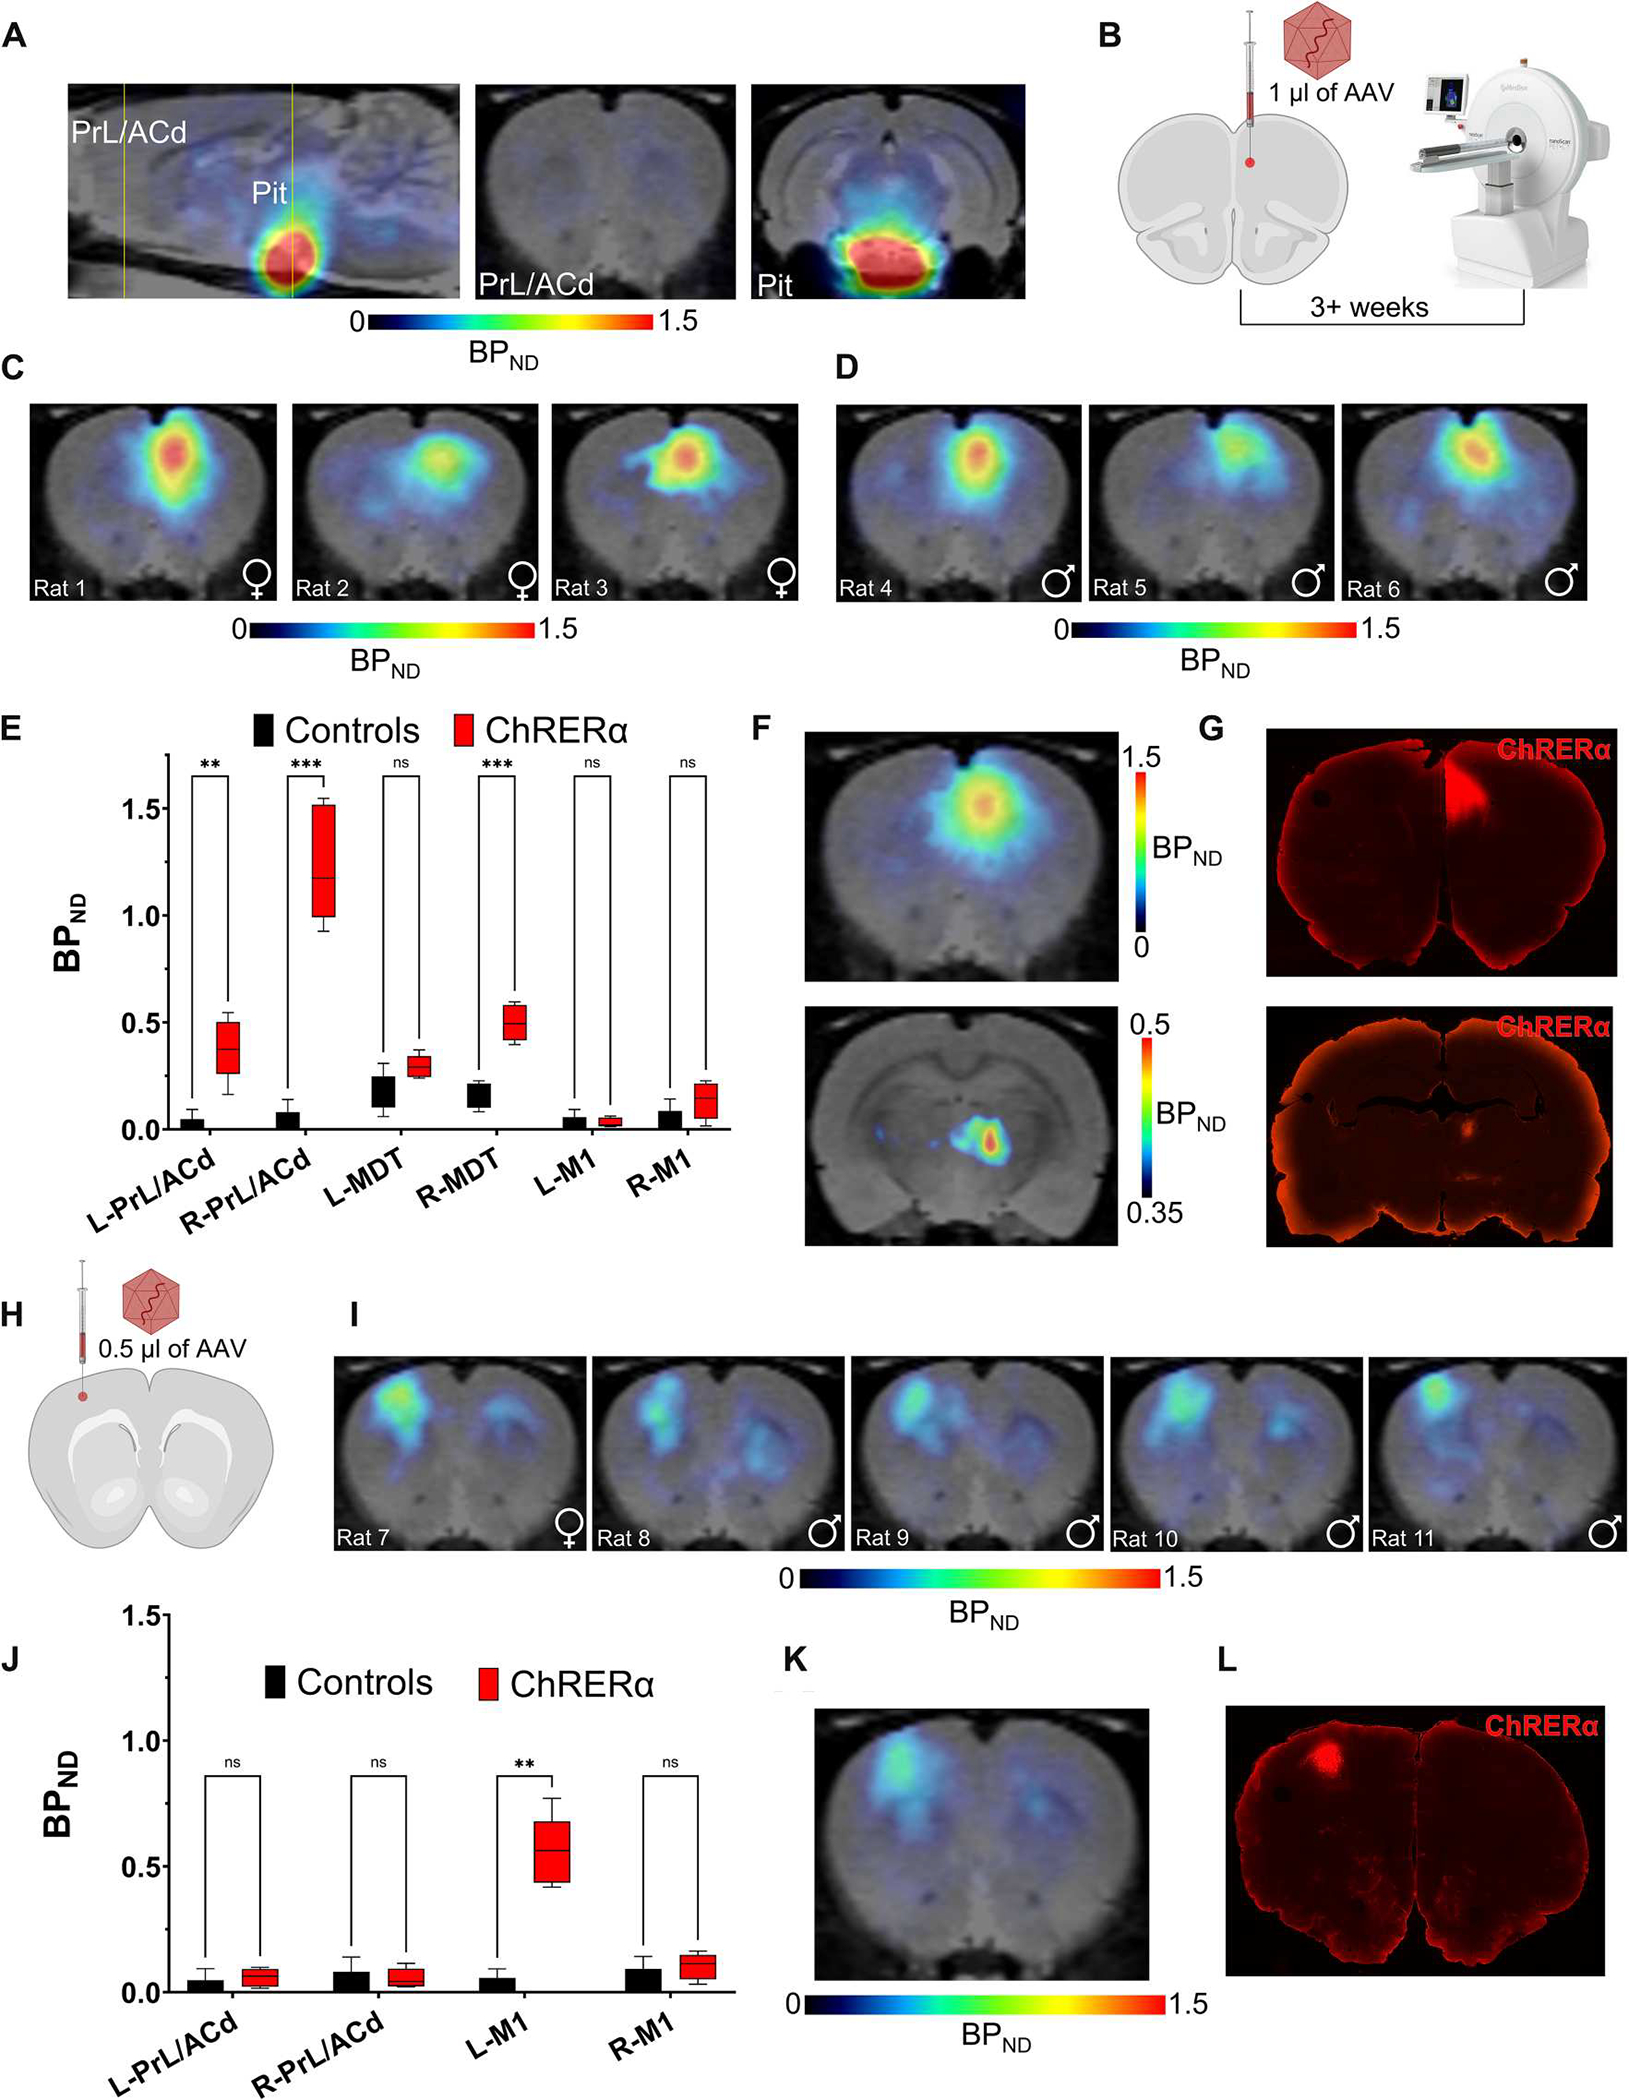
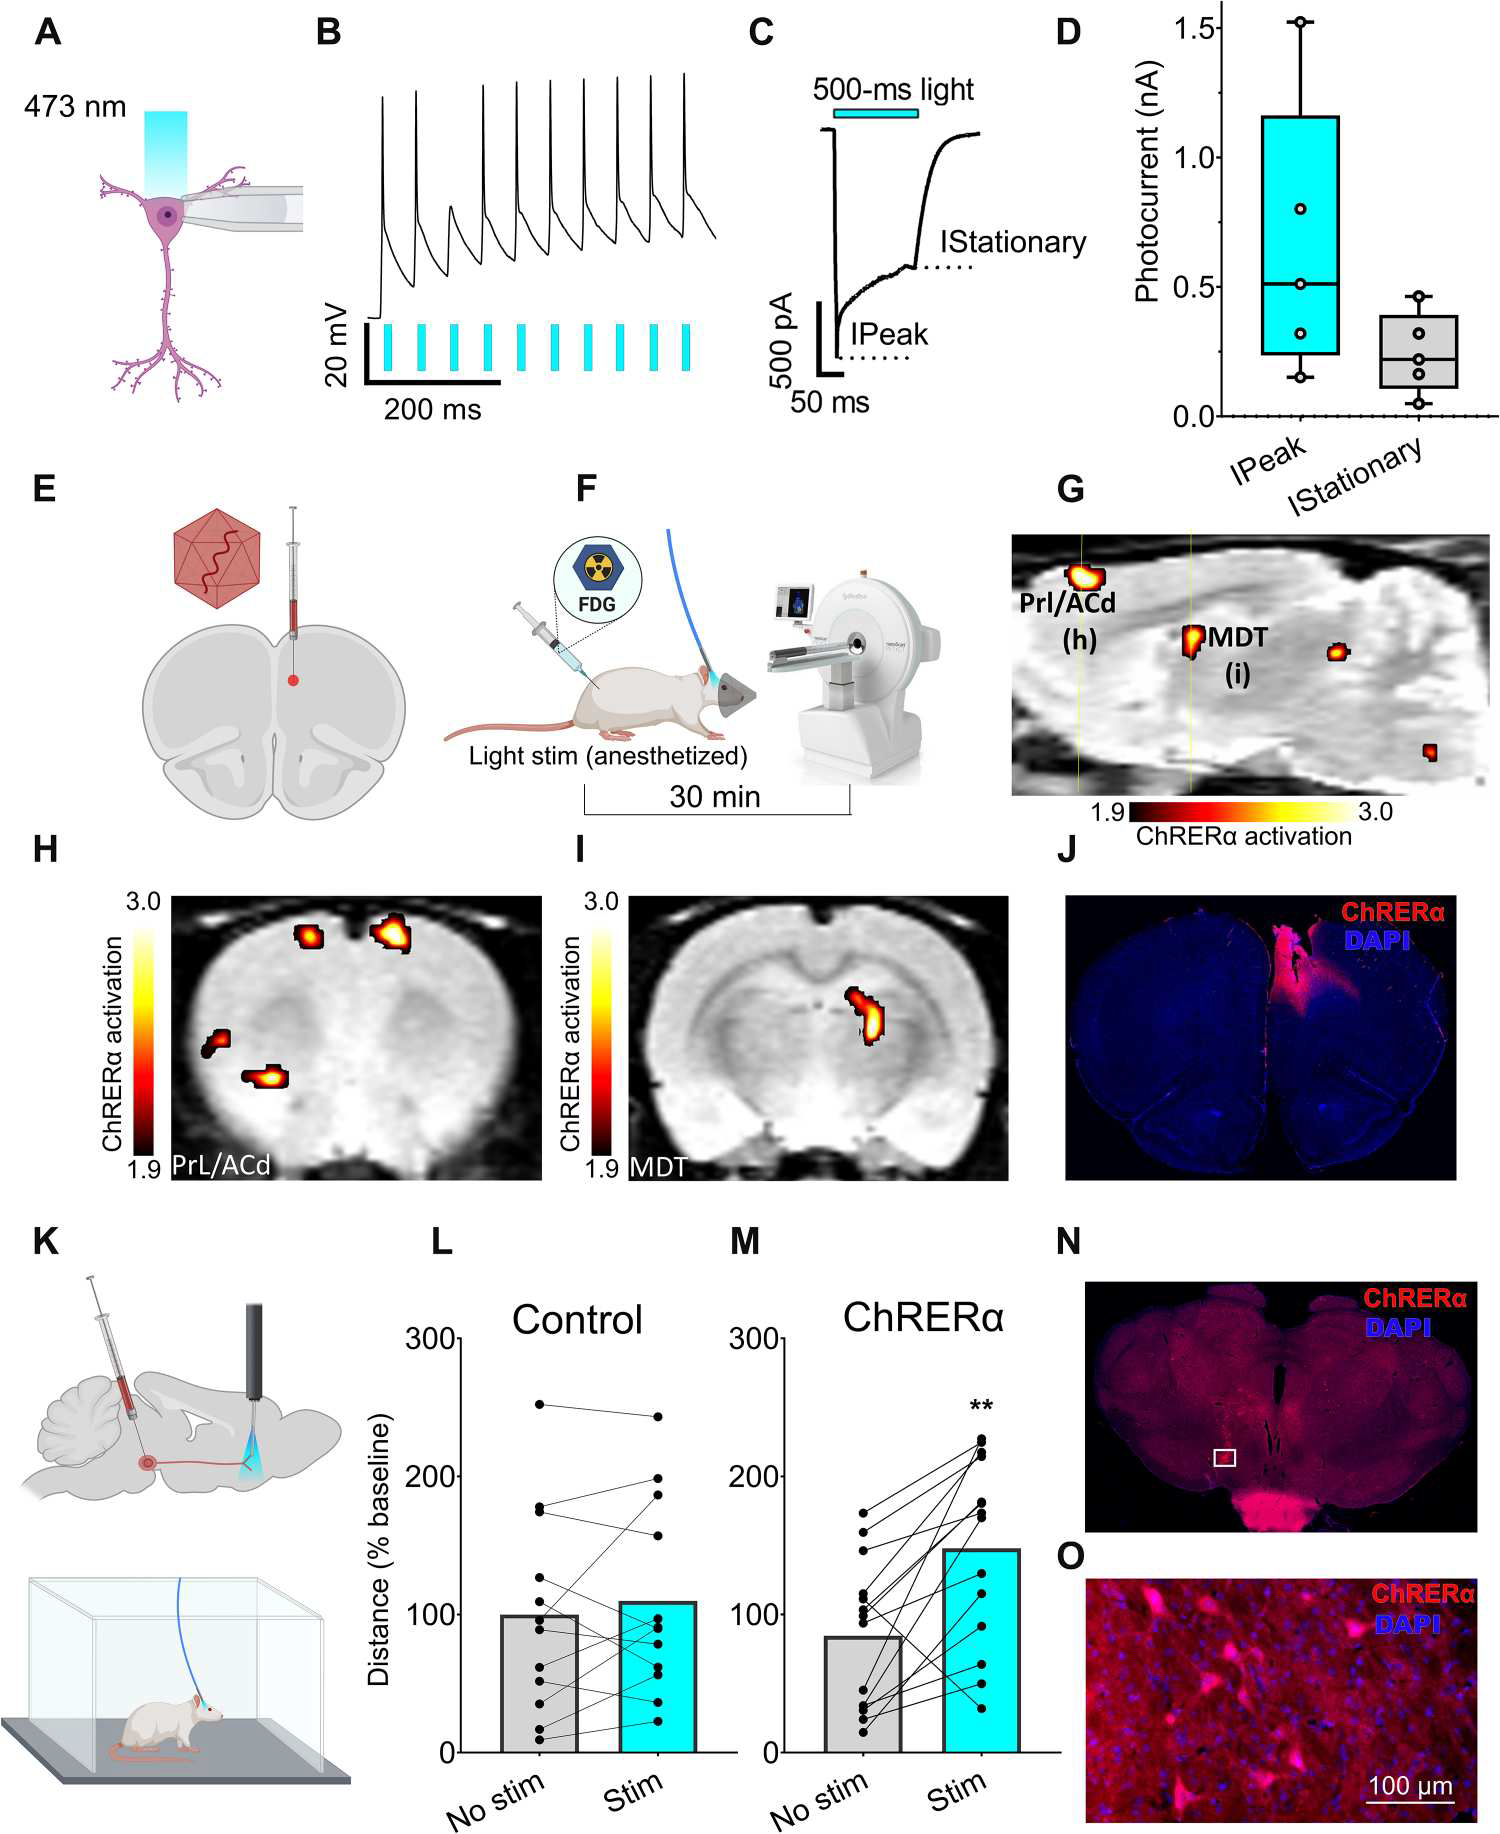
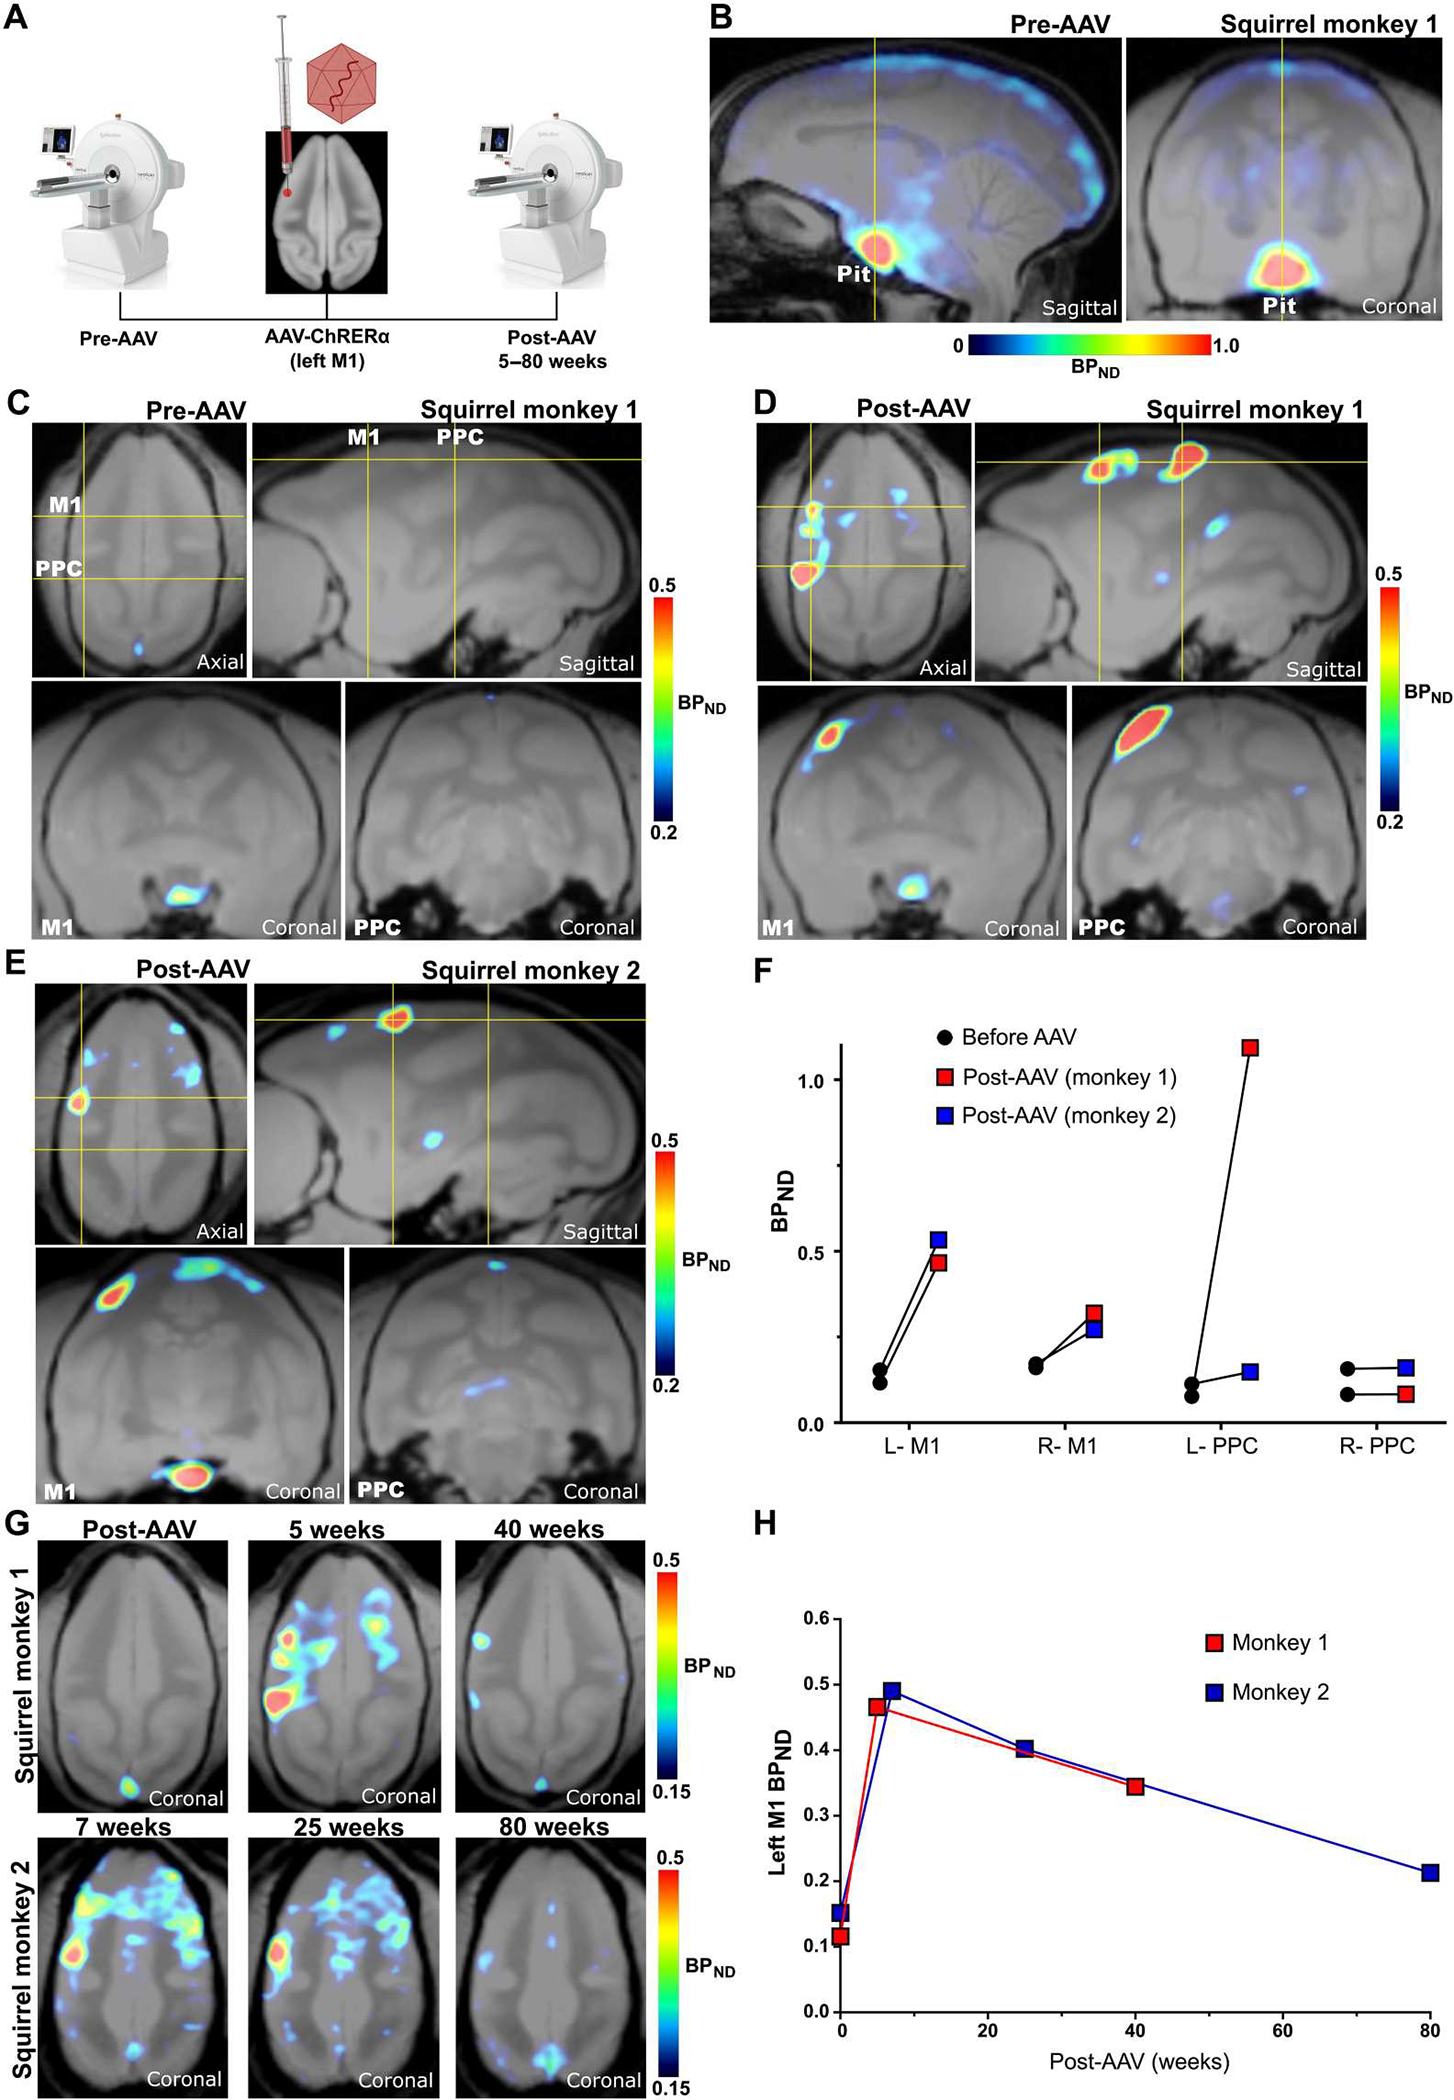
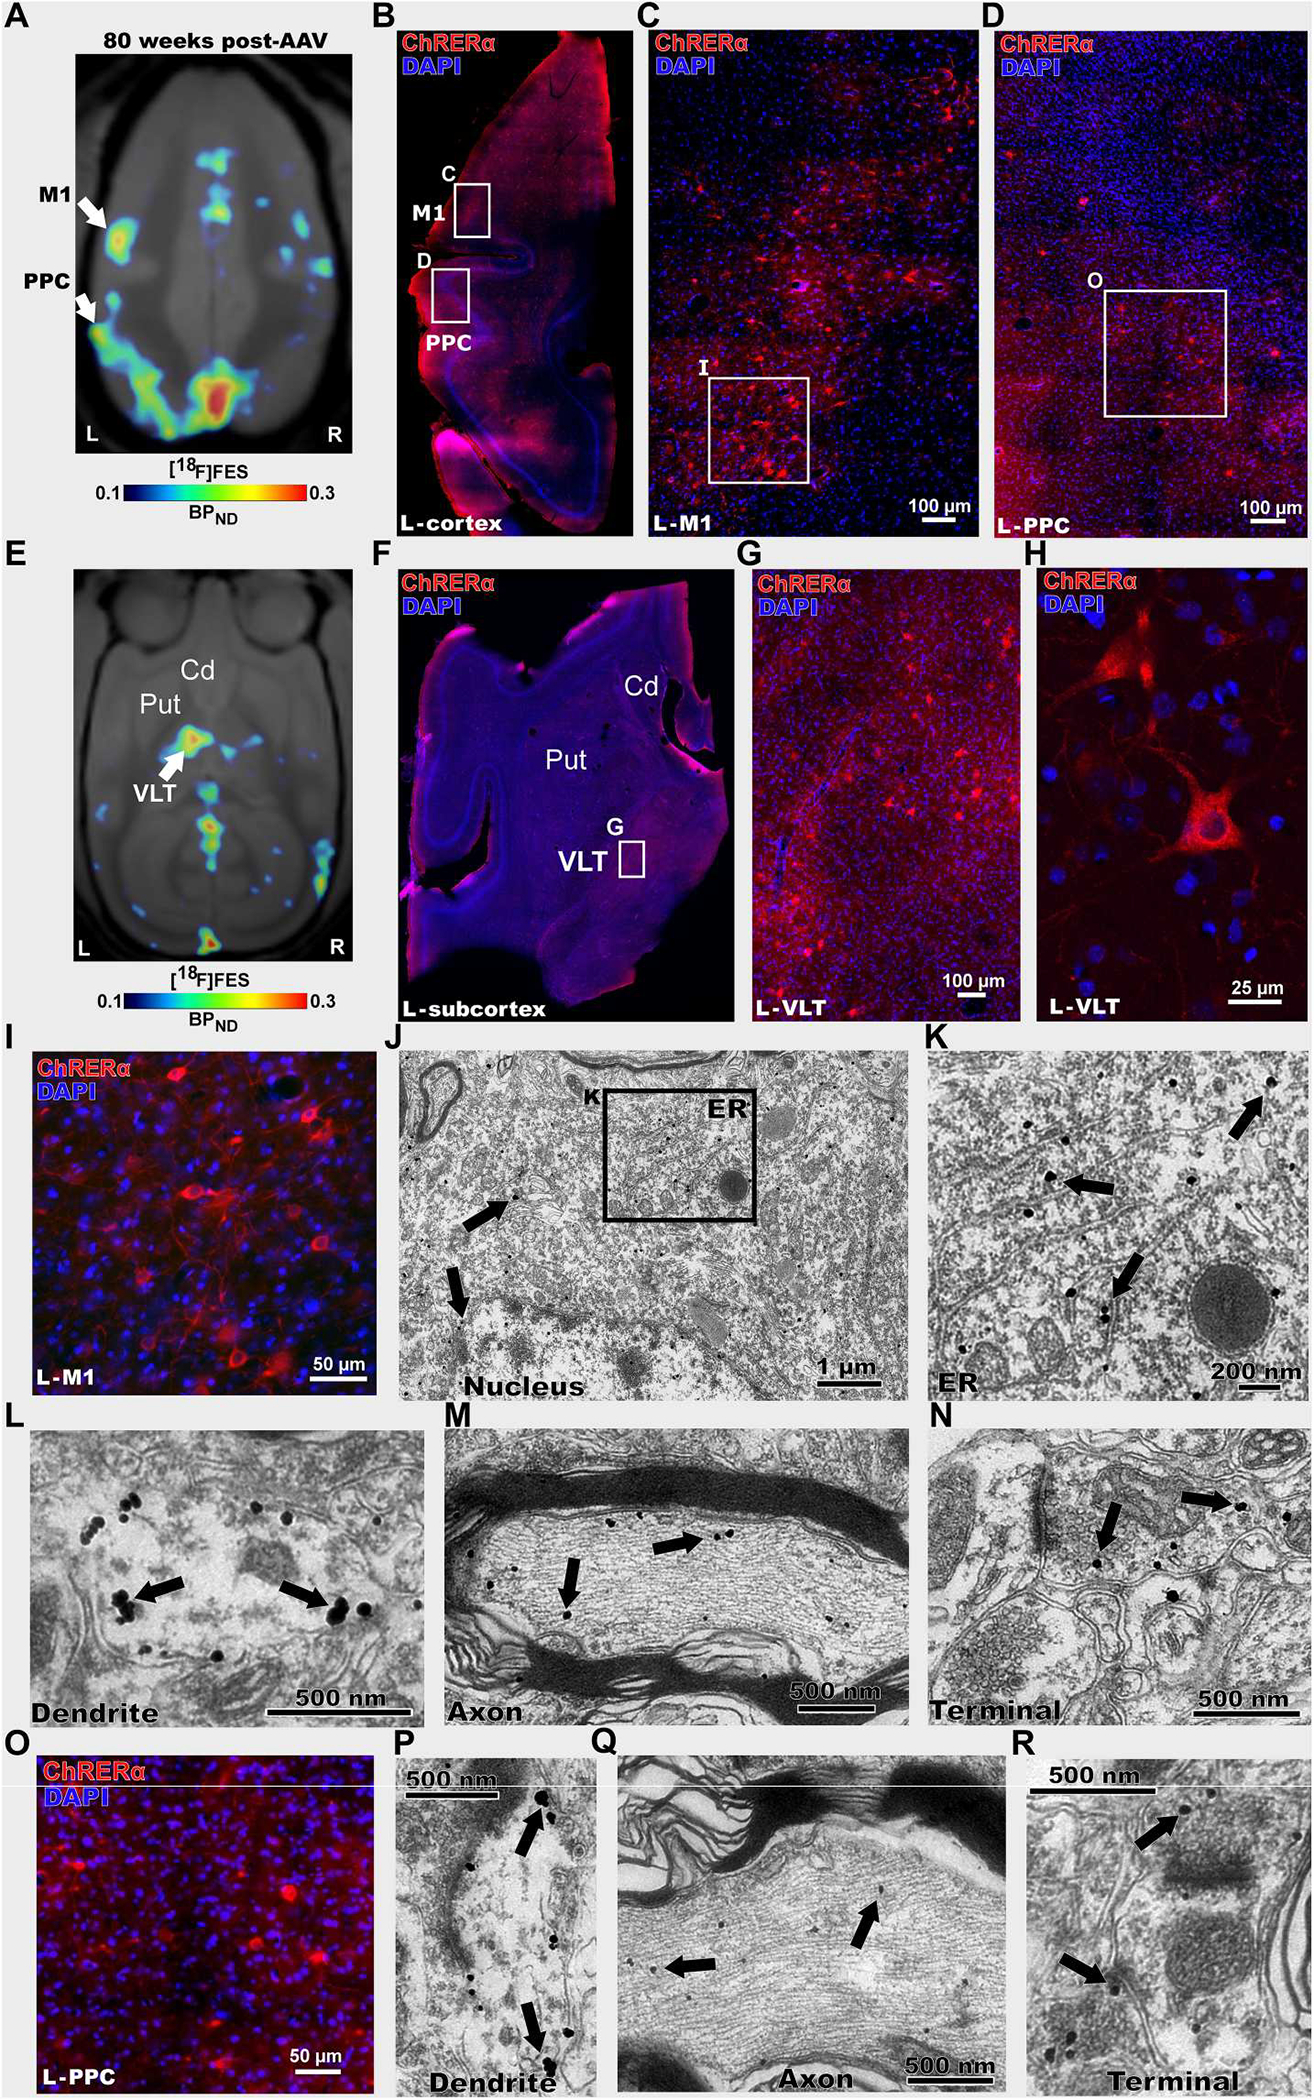
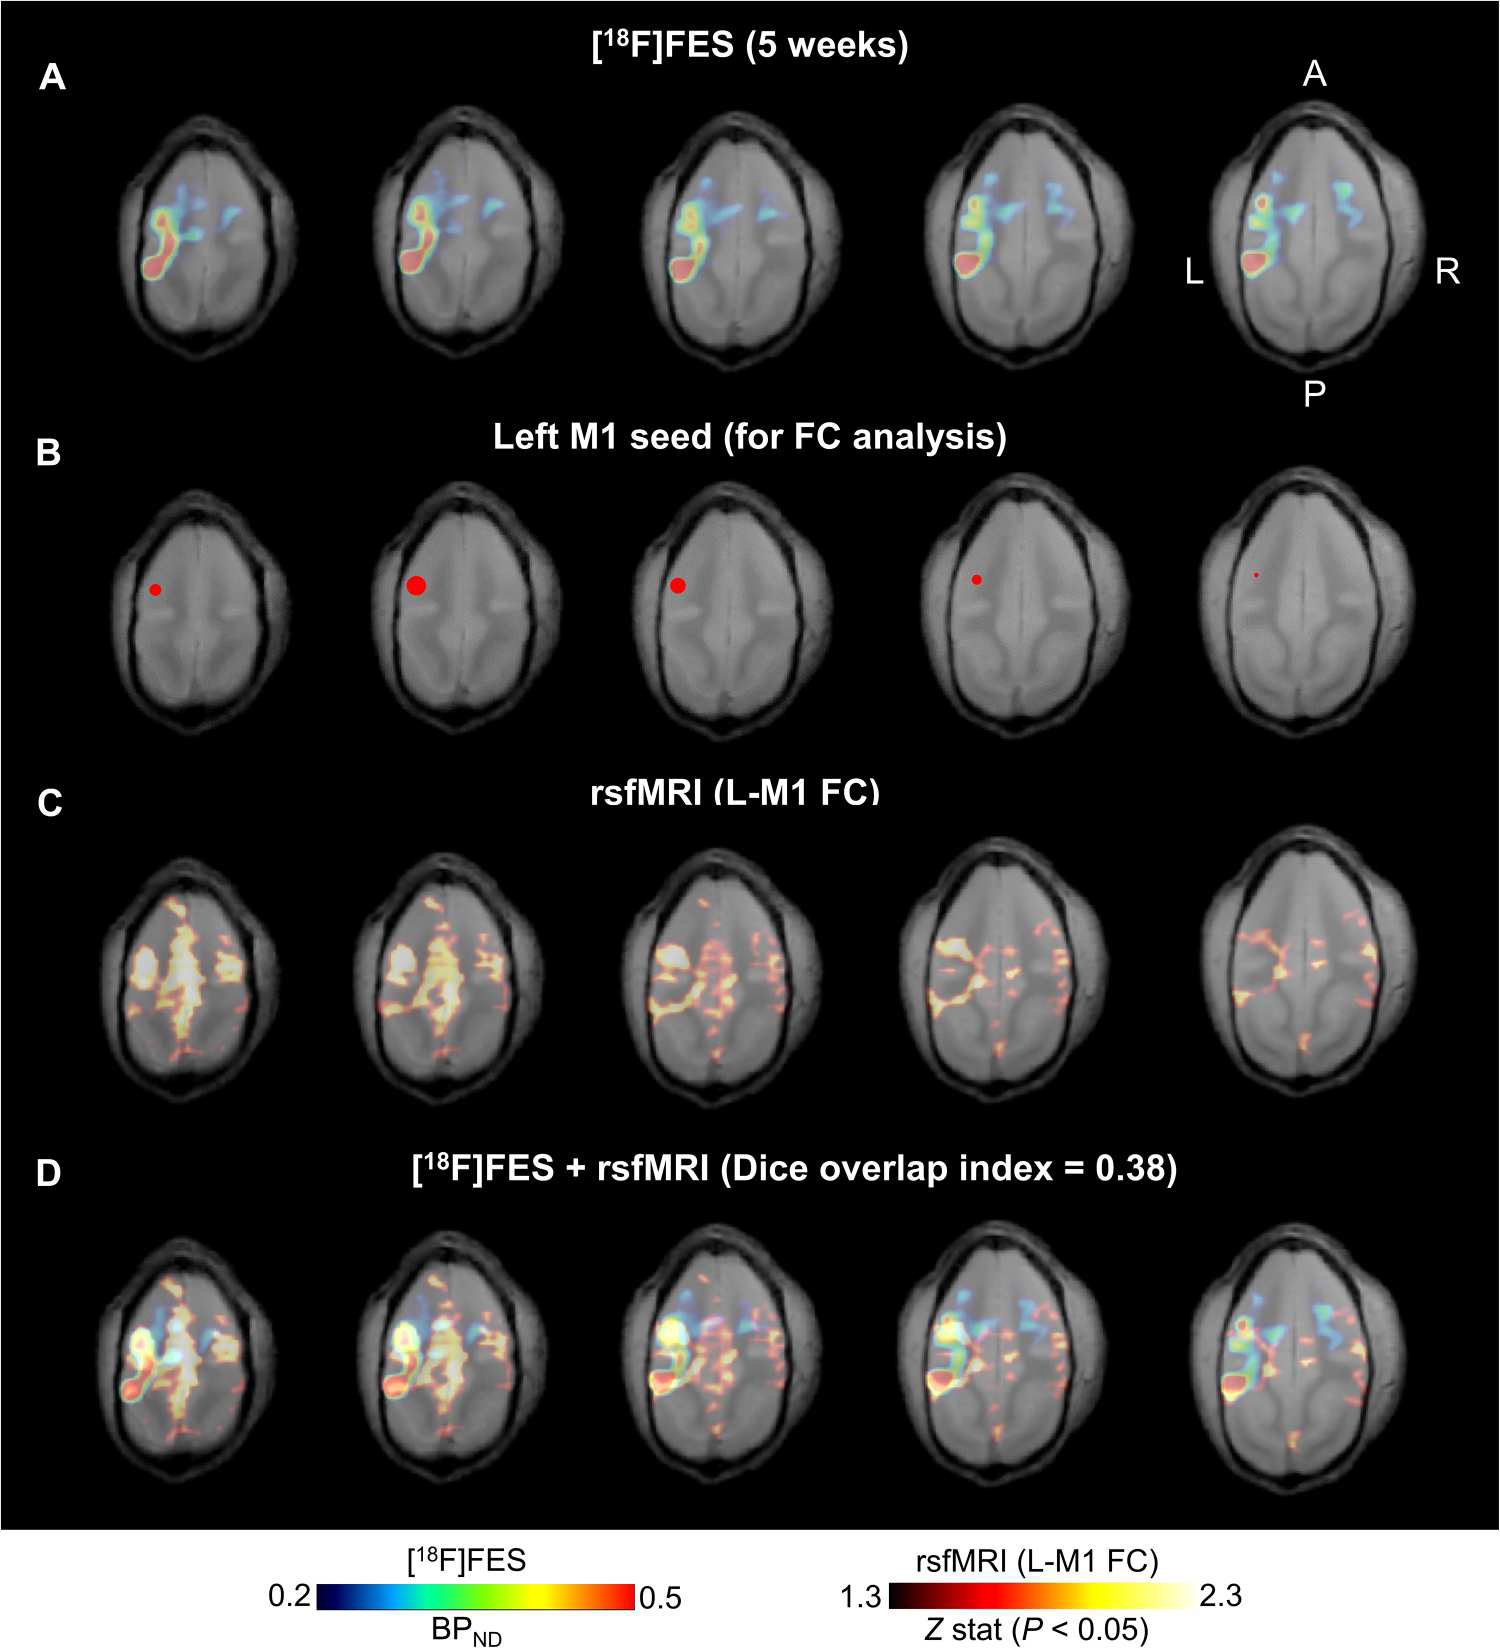
Optogenetics is a widely used technology with potential for translational research. A critical component of such applications is the ability to track the location of the transduced opsin in vivo. To address this problem, we engineered an excitatory opsin, ChRERα (hChR2(134R)-V5-ERα-LBD), that could be visualized using positron emission tomography (PET) imaging in a noninvasive, longitudinal, and quantitative manner. ChRERα consists of the prototypical excitatory opsin channelrhodopsin-2 (ChR2) and the ligand-binding domain (LBD) of the human estrogen receptor α (ERα). ChRERα showed conserved ChR2 functionality and high affinity for [18F]16α-fluoroestradiol (FES), an FDA-approved PET radiopharmaceutical. Experiments in rats demonstrated that adeno-associated virus (AAV)-mediated expression of ChRERα enables neural circuit manipulation in vivo and that ChRERα expression could be monitored using FES-PET imaging. In vivo experiments in nonhuman primates (NHPs) confirmed that ChRERα expression could be monitored at the site of AAV injection in the primary motor cortex and in long-range neuronal terminals for up to 80 weeks. The anatomical connectivity map of the primary motor cortex identified by FES-PET imaging of ChRERα expression overlapped with a functional connectivity map identified using resting state fMRI in a separate cohort of NHPs. Overall, our results demonstrate that ChRERα expression can be mapped longitudinally in the mammalian brain using FES-PET imaging and can be used for neural circuit modulation in vivo.


Conflict of interest statement

Competing interests: M. Michaelides has received research funding from AstraZeneca, Redpin Therapeutics, and Attune Neurosciences. All other coauthors report no competing interests.

Figures

Fig. 1.
Fig. 1.. Development and characterization of ChRERα in HEK-293 cells.
(A) Schematic illustrations of the encoding sequence for ChRERα (top) and the protein structure of ChRERα (bottom) are shown. (B) Representative Western blots verifying the subcellular localization of the V5 epitope in cytosolic or membrane fractions of HEK-293 cells transfected with V5-ERα-LBD, ChRERα, or ChR2-EYFP are shown. (C) [3H]E2 binding saturation curves in membrane homogenates from HEK-293 cells transfected with ERα-LBD (black) or ChRERα (red). (D) [3H]E2 competition binding curves with FES in membrane homogenates from HEK-293 cells transfected with ERα-LBD or ChRERα. Values for fitted parameters are described in the main text. (E) Photocurrent amplitudes in picoamperes (pA) and (F) light-induced voltage-current curves in millivolts (mV) of HEK-293 cells transfected with ChR2 (blue) or ChRERα (red). All data are shown as means ± SEM except that dots in (E) are individual cells.
Fig. 2.
Fig. 2.. ChRERα trafficking and subcellular localization in the rat brain.
(A) Illustration of the AAV-ChRERα injection site in the right PrL/ACd (AP = 3.0, ML = 0.6, DV = −3.5) is shown. (B to D) Representative IHC images at three different levels of magnifications illustrate the expression of ChRERα in cells in the right PrL/ACd (red = anti-ChR2 and blue = DAPI). (E) Schematic of dendrite (left, blue box) and axon terminal (right, red box) illustrates the localization of immuno-EM images. (F and G) Immunogold labeling of ChRERα expression in (F) right PrL/ACd dendrite and (G) axon terminal. (H) Schematic of right MDT projection site (red square). (I to K) Representative IHC images at three different levels of magnification illustrate the expression of ChRERα in cells in the right MDT (red = anti-ChR2 and blue = DAPI). (L) Schematic of dendrite localization (left, blue box) after retrograde transduction and anterograde axon terminal (right, red box) trafficking in the MDT. (M and N) Immunogold labeling of ChRERα expression in (M) MDT dendrite and (N) axon terminal.
Fig. 3.
Fig. 3.. Noninvasive localization of ChRERα in the brain of individual rats with [18F]FES.
(A) Baseline [18F]FES-PET representative image in control rats (no AAV) shows high endogenous binding in the pituitary but low binding in the rest of the brain (yellow lines illustrate location of coronal cross sections). (B) Schematic of right PrL/ACd injection site for AAV-ChRERα in rats 3+ weeks before [18F]FES-PET scan. (C and D) [18F]FES binding localizes ChRERα near the AAV injection site in right PrL/ACd of (C) female (n = 3) and (D) male (n = 3) rats 3 to 5 weeks after receiving AAV-ChRERα (representative images from individual rats). (E) Group BPND plot reveals higher binding in the right PrL/ACd and MDT in AAV-ChRERα (n = 6) versus control (n = 5) rats. ***P < 0.001 and **P < 0.01. (F) Group average BPND of [18F]FES in the right PrL/ACd (top) and MDT (bottom) in ChRERα rats (n = 6). (G) IHC confirms ChRERα expression in the right PrL/ACd and MDT (red = anti-ChR2). (H) Schematic of the left M1 injection site for AAV-ChRERα in rats (n = 5). (I) Individual post-AAV [18F]FES-PET scans of rats injected with AAV-ChRERα in the left M1 (n = 5). (J) Group BPND plot of AAV-ChRERα (left M1 AAV, n = 5) versus control (n = 5) rats shows higher binding in the left M1 but not in PrL/ACd. **P < 0.01. (K) Group average BPND of [18F]FES in the left M1 of AAV-ChRERα rats (n = 5). (L) IHC confirms ChRERα expression (red = anti-ChR2) corresponding with the left M1 area localized with [18F]FES-PET. ns, not significant.
Fig. 4.
Fig. 4.. ChRERα activation alters brain activity and behavior in rodents.
(A to D) Slice electrophysiology in mice. (A) Patch-clamp recordings of pyramidal neurons from layer 5 of the ventromedial prefrontal cortex during stimulation with 473-nm light at 10 megawatt (mW) power using 5- or 500-ms-long pulses. (B) Representative voltage trace of neuronal firing in responses (black trace) to a train of light pulses (blue bars). (C) Representative current trace in response to a 500-ms light pulse. (D) Average peak and stationary photocurrent values in nanoampere (nA) (five cells per three mice). (E to I) FDG-PET imaging in rats. (E) Schematic of AAV-ChRERα injection and optic fiber target in right PrL/ACd (ChRERα n = 5, control n = 4). (F) FDG-PET experimental design—bolus intraperitoneal. FDG injection at start of the 30-min light stimulation protocol (anesthetized), followed by PET/CT scan. (G) Sagittal view (right hemisphere) with regions of greater FDG uptake (maps thresholded at t1,7 = 1.89, P < 0.05) in ChRERα versus control rats [group analysis, yellow lines indicate level of coronal images shown in (H) and (I)]. (H and I) Coronal view with regions of significantly greater FDG uptake (ChRERα > control) that was observed in (H) bilateral PrL/ACd, left insula and striatum, and (I) right MDT. (J) IHC confirms expression of ChRERα and optic fiber placement in the right PrL/ACd (red = anti-ChR2 and blue = DAPI). (K to M) Locomotor behavior in rats. Each dot represents an individual trial from five different rats. (K) Schematic of unilateral AAV-ChRERα injection in VTA and optic fiber placement in NAc (top) and open-field optogenetic stimulation in awake rats (bottom). (L and M) Light stimulation significantly increased (**P = 0.01) distance traveled in (M) AAV-ChRERα rats but not in (L) control rats. (N to O) IHC confirms ChRERα expression in rat VTA (red = anti-ChR2 and blue = DAPI), and white box indicates area of high magnification (O) in VTA.
Fig. 5.
Fig. 5.. Noninvasive localization of ChRERα in squirrel monkeys with [18F]FES PET imaging.
(A) Schematic of PET experimental design and the left M1 injection site for AAV-ChRERα. (B) Pre-AAV baseline [18F]FES-PET in a squirrel monkey (monkey 1) shows high endogenous binding in the pituitary but low binding in the rest of the brain. Yellow lines indicate the cross-sectional planes corresponding to the subsequent coronal images. (C) Pre-AAV baseline [18F]FES-PET in squirrel monkey 1 at the level of M1 and PPC. (D) Post-AAV [18F]FES in squirrel monkey 1 localizes ChRERα near the left M1 AAV injection site and in the ipsilateral PPC 5 weeks after receiving AAV. (E) [18F]FES localizes ChRERα near the left M1 AAV injection site in a second squirrel monkey (monkey 2) 7 weeks after AAV. (F) Pre-AAV and post-AAV BPND in left and right M1 and PPC for each animal. (G) Longitudinal comparisons of [18F]FES-PET in squirrel monkey 1 (top, before AAV, 5 and 40 weeks after AAV) and squirrel monkey 2 (bottom, 7, 25, and 80 weeks after AAV). (H) Longitudinal comparisons of average BPND in left M1 in squirrel monkey 1 (red) and squirrel monkey 2 (blue).
Fig. 6.
Fig. 6.. Postmortem validation of [18F]FES-PET ChRERa imaging in a nonhuman primate.
(A) [18F]FES-PET imaging 80 weeks after AAV-ChRERα injection in squirrel monkey 2 to localize ChRERα expression (BPND scaled to optimize [18F]FES signal). Arrows indicate the left M1 and PPC (B to R). (B) IHC in a left hemisphere horizontal brain slice confirms ChRERα expression in the left M1 and PPC (red = anti-ChR2 and blue = DAPI), white rectangles highlight regions in left M1 and PPC. (C and D) High magnification of images of insets shown in (B). (E) [18F]FES-PET 80 weeks after AAV-ChRERα injection in squirrel monkey 2 localized ChRERα expression in left ventral lateral thalamus (VLT) (BPND scaled to optimize [18F]FES signal). Arrow indicates left VLT (F) IHC in a left hemisphere horizontal brain slice confirms ChRERα expression in left VLT (red = anti-ChR2 and blue = DAPI), white rectangle highlights region in left VLT. (G and H) High-magnification IHC images of insets shown in (F). (I) High-magnification IHC image of left M1 (J to N) Immuno-EM in left M1 reveals subcellular localization of ChRERα expression in (J) cell body (black rectangle highlights location of (K), (K) ER, (L) dendrite, (M) myelinated axon, and (N) axon terminal. (O) High-magnification IHC image of left PPC. (P to R) Immuno-EM images in the left PPC showing ChRERα located in (P) dendrite, (Q) myelinated axon, and (R) axon terminal. Cd, caudate; ER, endoplasmic reticulum; Put, putamen.
Fig. 7.
Fig. 7.. [18F]FES-PET and ChRERα correlate with functional brain connectivity in NHPs.
(A) Horizontal sections (left, most dorsal; right, most ventral) of [18F]FES-PET from squirrel monkey 1 at 5 weeks after AAV. (B) Left M1 seed (red 2-mm sphere centered at peak [18F]FES signal) for functional connectivity analysis of resting state functional MRI (rsfMRI). (C) rsfMRI functional connectivity patterns of the left M1 seed in an independent group of squirrel monkeys (n = 9, 35 total scans) coregistered to the squirrel monkey 1 structural MRI. (D) Overlapping patterns of [18F]FES binding (ChRERα expression) and rsfMRI suggest structural and functional connectivity between left M1 and ipsilateral PPC and in the contralateral hemisphere (r = 0.23; P = 0 with Fisher’s z transformation; 27,871 voxels; and Dice overlap index = 0.38).

References

    1. Boyden ES, Zhang F, Bamberg E, Nagel G, Deisseroth K, Millisecond-timescale, genetically targeted optical control of neural activity. Nat. Neurosci. 8, 1263–1268 (2005). - PubMed
    1. Zhang F, Wang L-P, Boyden ES, Deisseroth K, Channelrhodopsin-2 and optical control of excitable cells. Nat. Methods 3, 785–792 (2006). - PubMed
    1. Zhang F, Wang L-P, Brauner M, Liewald JF, Kay K, Watzke N, Wood PG, Bamberg E, Nagel G, Gottschalk A, Deisseroth K, Multimodal fast optical interrogation of neural circuitry. Nature 446, 633–639 (2007). - PubMed
    1. Chow BY, Boyden ES, Optogenetics and translational medicine. Sci. Transl. Med. 5, 177ps5 (2013). - PubMed
    1. Iyer SM, Vesuna S, Ramakrishnan C, Huynh K, Young S, Berndt A, Lee SY, Gorini CJ, Deisseroth K, Delp SL, Optogenetic and chemogenetic strategies for sustained inhibition of pain. Sci. Rep. 6, 30570 (2016). - PMC - PubMed

Publication types