. 2023 Jul 26;15(706):eadg3358.
doi: 10.1126/scitranslmed.adg3358. Epub 2023 Jul 26.

Pharmaco-proteogenomic characterization of liver cancer organoids for precision oncology

Affiliations

Pharmaco-proteogenomic characterization of liver cancer organoids for precision oncology

Shuyi Ji et al. Sci Transl Med. .

Abstract

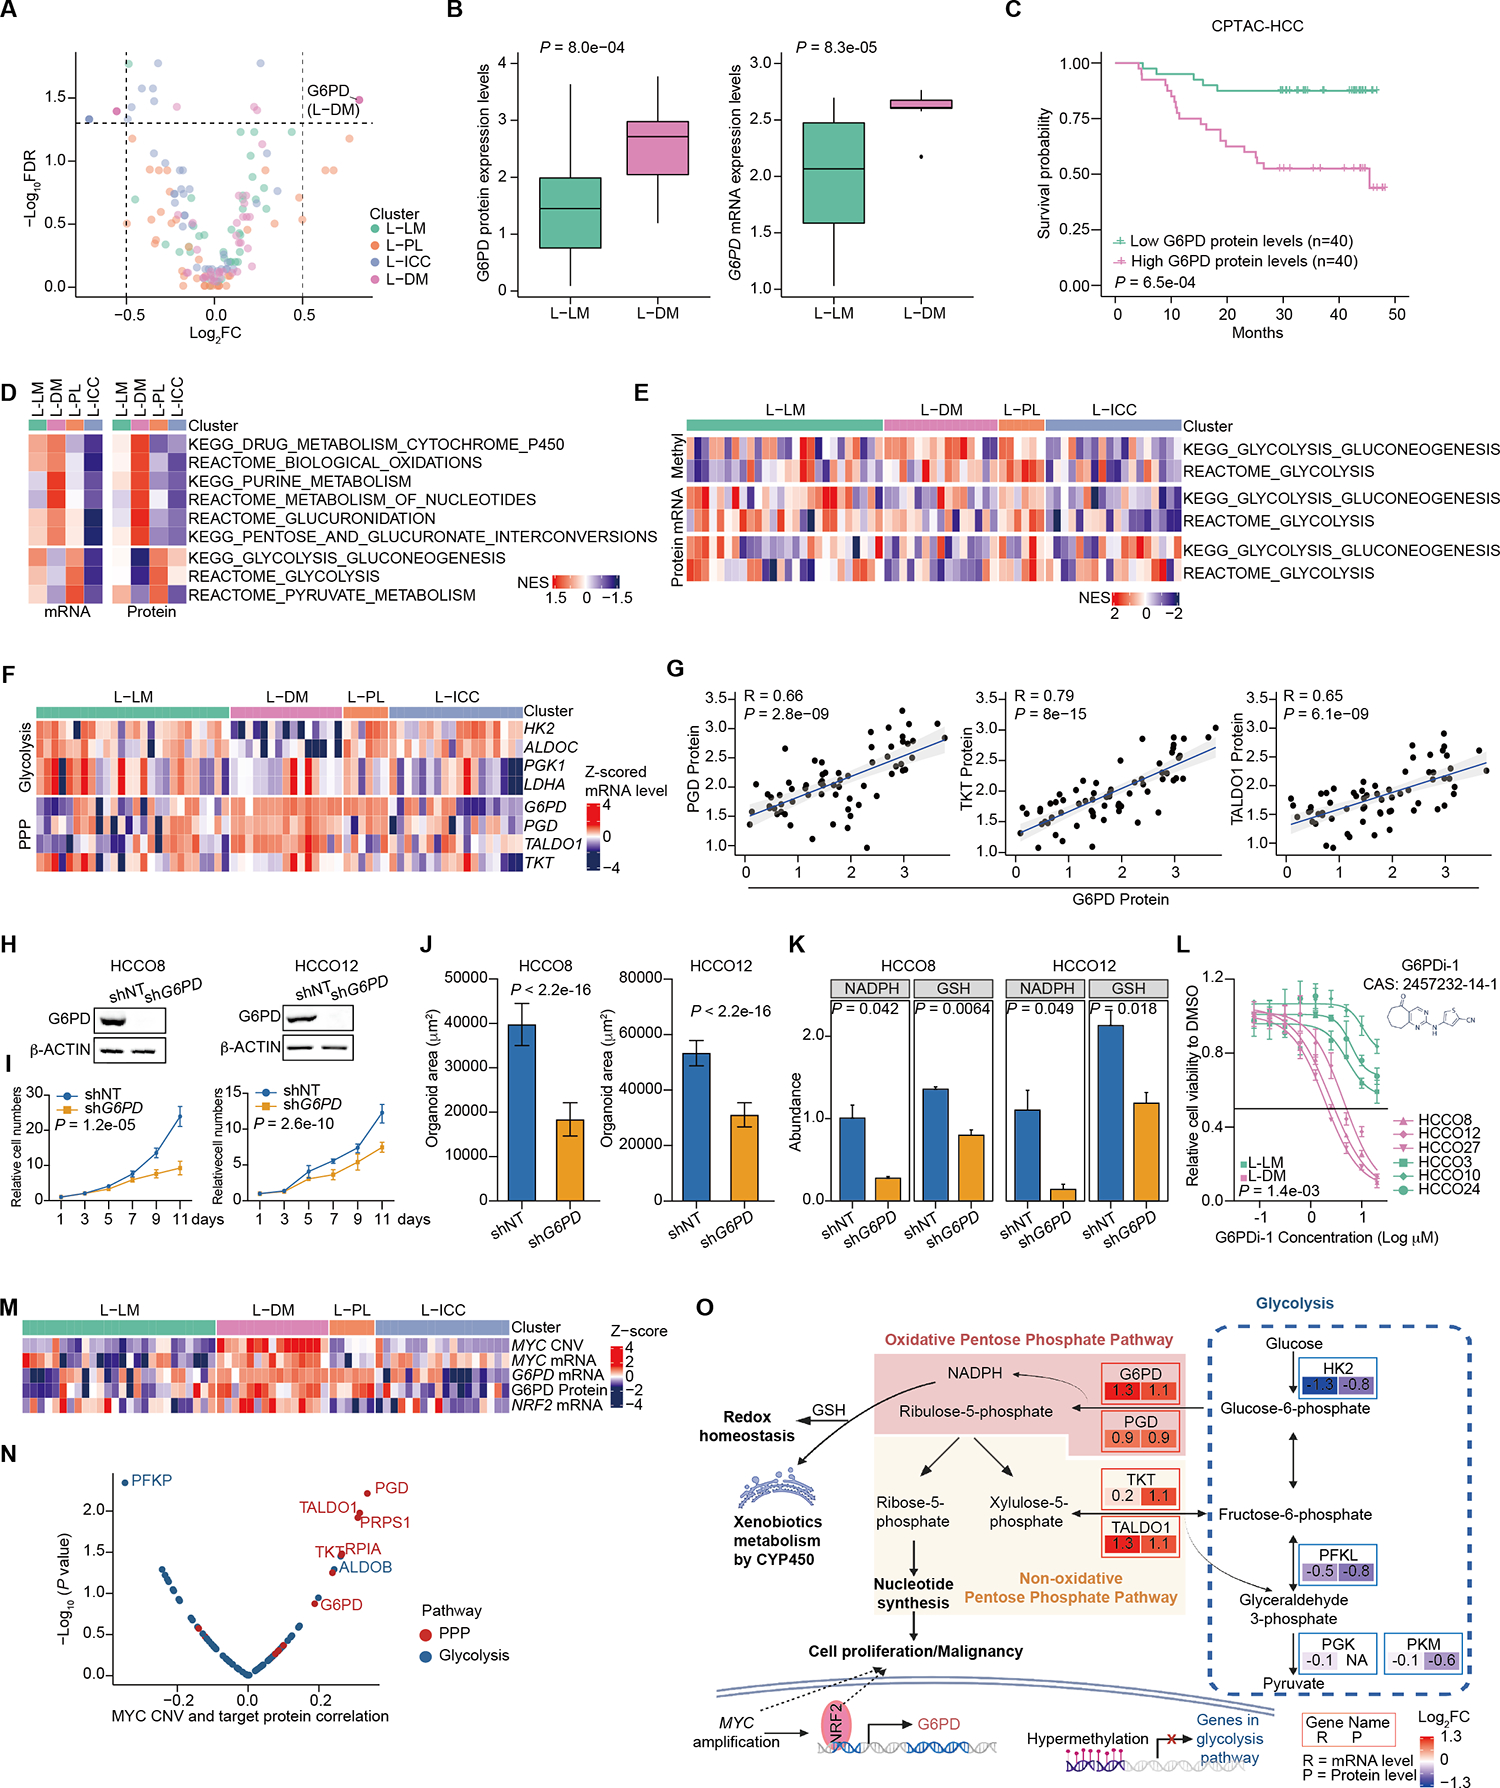
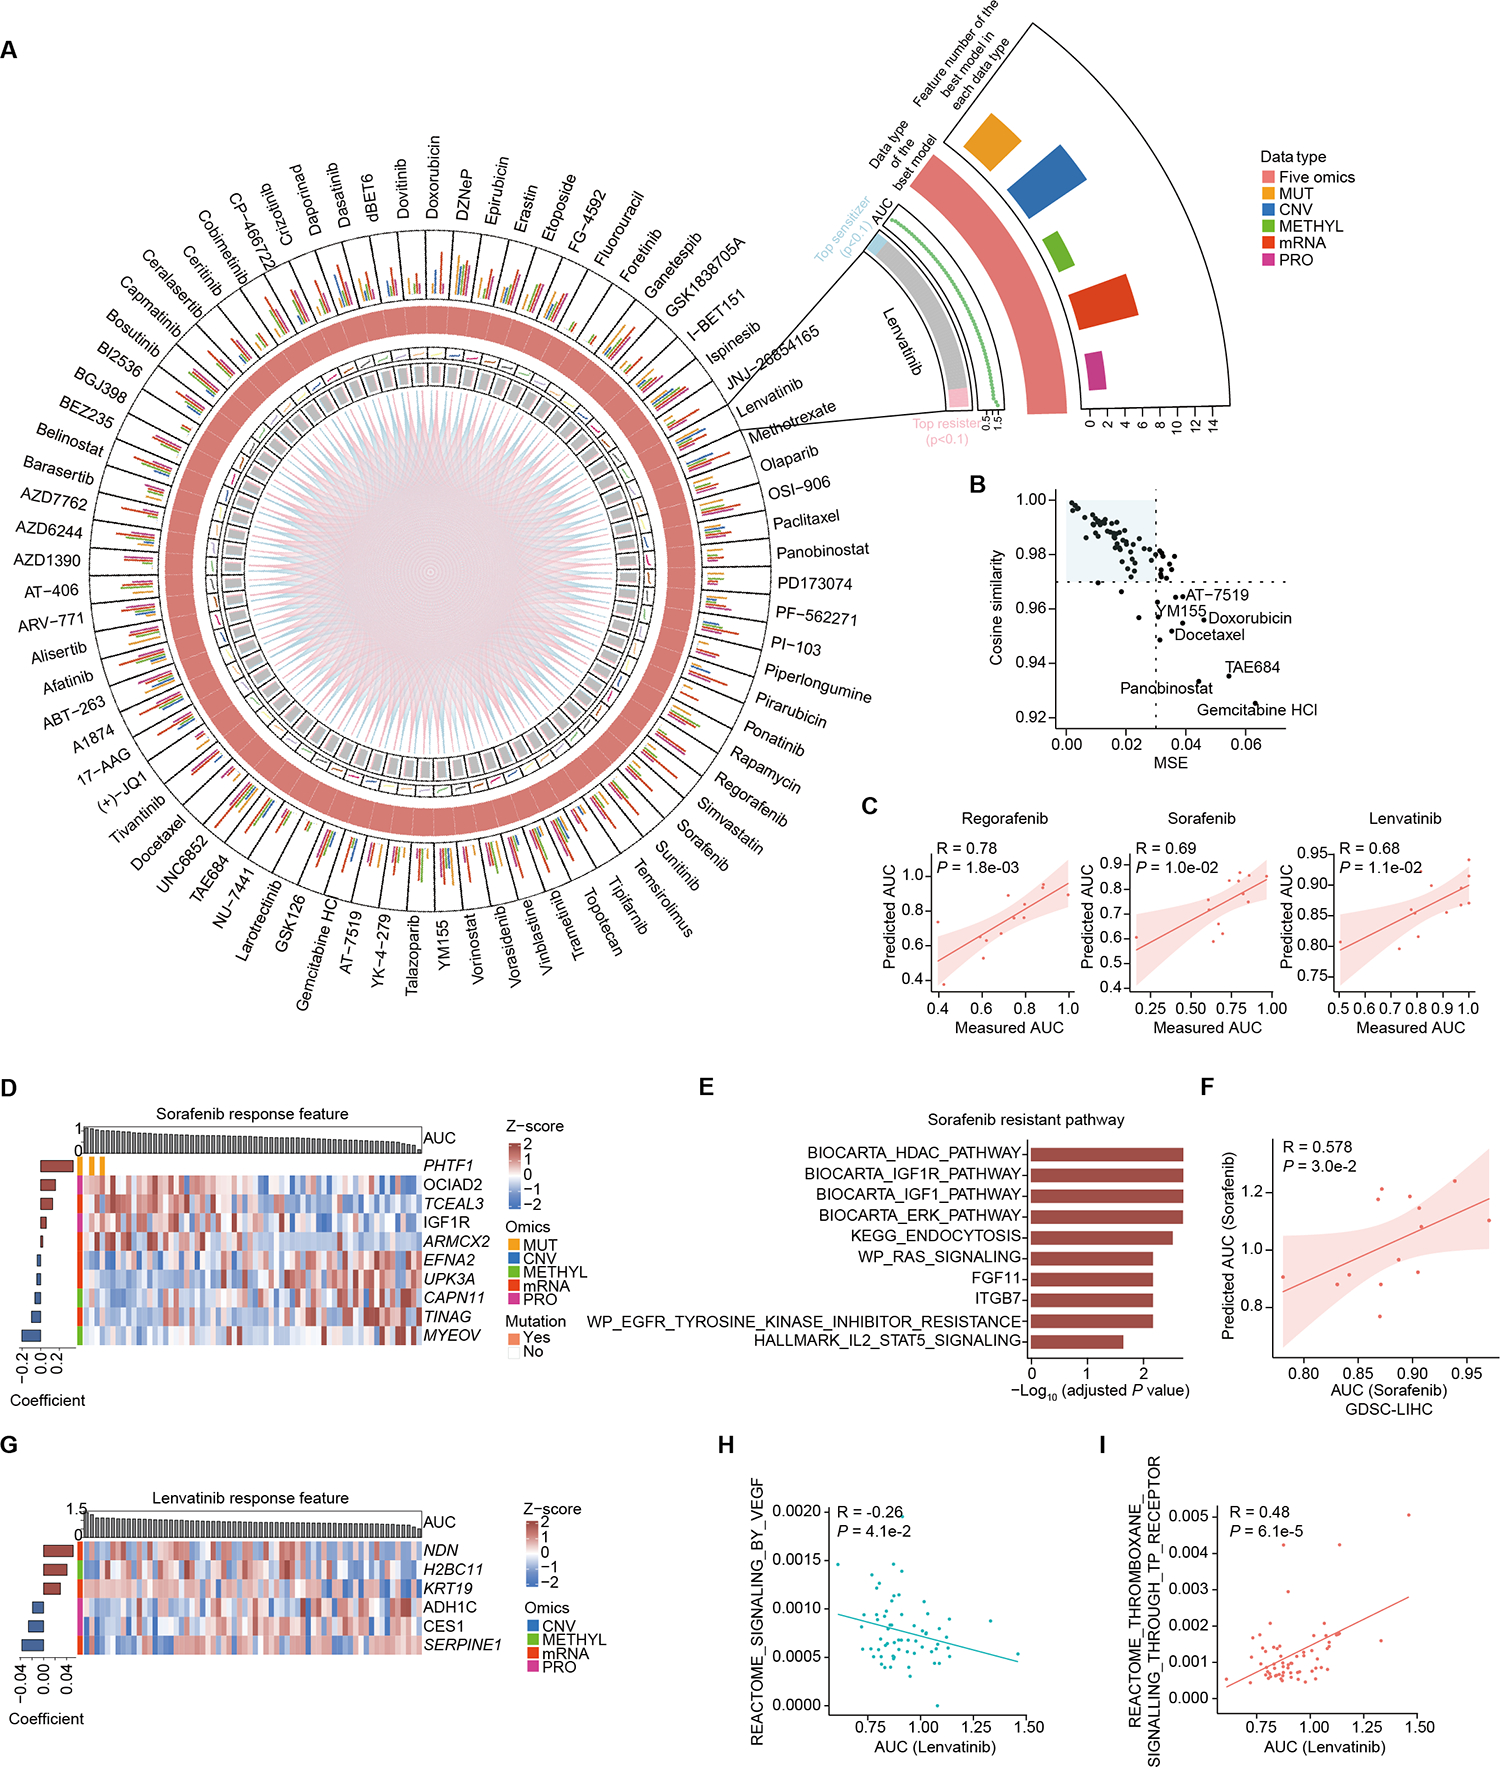
Organoid models have the potential to recapitulate the biological and pharmacotypic features of parental tumors. Nevertheless, integrative pharmaco-proteogenomics analysis for drug response features and biomarker investigation for precision therapy of patients with liver cancer are still lacking. We established a patient-derived liver cancer organoid biobank (LICOB) that comprehensively represents the histological and molecular characteristics of various liver cancer types as determined by multiomics profiling, including genomic, epigenomic, transcriptomic, and proteomic analysis. Proteogenomic profiling of LICOB identified proliferative and metabolic organoid subtypes linked to patient prognosis. High-throughput drug screening revealed distinct response patterns of each subtype that were associated with specific multiomics signatures. Through integrative analyses of LICOB pharmaco-proteogenomics data, we identified the molecular features associated with drug responses and predicted potential drug combinations for personalized patient treatment. The synergistic inhibition effect of mTOR inhibitor temsirolimus and the multitargeted tyrosine kinase inhibitor lenvatinib was validated in organoids and patient-derived xenografts models. We also provide a user-friendly web portal to help serve the biomedical research community. Our study is a rich resource for investigation of liver cancer biology and pharmacological dependencies and may help enable functional precision medicine.


Conflict of interest statement

Competing interests: H.C. is inventor on patents related to organoid research. His full disclosure is given at: www.uu.nl/staff/JCClevers/. Y.L., H.L., and J.L. are employees of D1 Medical Technology (Shanghai) Co., Ltd.. P.C. and S.C. are employees of Burning Rock Biotech. Other authors declare no potential conflict of interest.

Figures

Fig. 1.
Fig. 1.. LICOB Establishment and Comparison with Primary Liver Cancers.
(A) Schematic workflow of pharmaco-proteogenomic analysis of liver cancer organoids. (B) Numbers of organoid models in LICOB. (C) Representative brightfield images of LICOB (Scale bar: 100 μm). (D) Representative H&E staining of organoids, xenografts and their original tumors (Scale bar: 50 μm). (E and F) Immunofluorescence (E) and immunohistochemistry (F) analyses for the indicated markers in LICOB (Scale bar: 50 μm). (G) Mutational landscape of LICOB and paired cancer tissues (n = 48 pairs). (H) Spearman correlation coefficients of organoids with paired or unpaired tissues across different omics. (CNV: 48 pairs, RNA-seq: 43 pairs, RRBS: 30 pairs, Proteomics: 22 pairs) (Wilcoxon rank-sum test).
Fig. 2.
Fig. 2.. Molecular Subtypes of LICOB.
(A) Consensus clustering based on multi-omics data revealed four subtypes. Each column represents an organoid sample and rows indicate molecular features. (B) ssGSEA scores of selected gene sets in each LICOB multi-omics cluster and each type of omics data (*FDR < 0.05, Wilcoxon rank-sum test). (C) Comparisons of the HCCO subtypes in LICOB with previous subtyping results from HCC patient tissues (Fisher exact test). (D) Kaplan-Meier curves for overall survival in CPTAC HCC cohort clustered according to the multi-omics signatures of organoid subtypes (Log-rank test). Pathways were enriched by GSEA for cancer hallmarks. (E) Quadrant plot depicting the alteration of 6,729 genes simultaneously detected by transcriptome and proteome in L-LM compared with L-DM. (F) The GO enrichment analysis of differentially expressed genes between L-LM and L-DM.
Fig. 3.
Fig. 3.. G6PD as a potential drug target in L-DM.
(A) Differential protein expression of the potential drug targets in LICOB subtypes. (B) The protein and mRNA expression of G6PD between L-LM and L-DM (Wilcoxon rank-sum test). (C) Kaplan-Meier curves for overall survival based on the lower and upper quantile expression of G6PD protein in the CPTAC HCC dataset (Log-rank test). (D) ssGSEA scores of indicated pathways among LICOB clusters. (E) ssGSEA scores of glycolysis pathways. (F) mRNA expression of PPP and glycolysis related genes in each LICOB sample. (G) Pearson correlations between the expression of G6PD with indicated protein. (H) Western blot analysis of G6PD in HCCO8 and HCCO12 from L-DM with G6PD silencing (sh-G6PD) or control (sh-NT). (I) Proliferation of indicated organoids (Two-way ANOVA). (J) Areas of indicated organoids (Student’s t-test). Organoid numbers (shNT vs sh-G6PD): HCCO8 (n = 1049 vs n = 3496); HCCO12 (n = 476 vs n = 897). (K) Boxplots demonstrating indicated metabolites in indicated organoids (Student’s t-test). (L) Dose-response curves of G6PD inhibition for organoids from L-LM and L-DM (Wilcoxon rank-sum test). (M) Selected multi-omic features among LICOB subtypes. (N) Spearman correlations between MYC CNV and expression of proteins from glycolysis (blue dots) and PPP pathways (red dots) with significantly correlated genes labeled. (O) Schematic diagram depicting the function of G6PD in metabolic flux shift in L-DM.
Fig. 4.
Fig. 4.. Heterogeneous Drug Response in LICOB.
(A) Mechanisms of action for the 76 drugs. (B) Average AUC values between organoids from HBV positive and HBV negative patients of each drug category (Wilcoxon rank-sum test). (C) Representative scatterplot of AUC values of drugs with shared molecular targets (Pearson correlation test). (D) Average AUC values among the four subtypes for the 76 drugs. The AUC values were Z-score normalized by row. (E) Comparisons of AUC values for the chemotherapy drugs among the four subtypes (Student’s t-test). (F) ssGSEA scores for Reactome Cell Cycle Mitotic pathway among the four subtypes (Student’s t-test). (G) Multi-omic features associated with the responses of FGFR inhibitor (BGJ398 and PD173074) or MET inhibitor (tivantinib). The bar plot showing the Spearman correlation between the AUC of the drug and the feature values in each cluster. For BGJ398 and PD173074, the correlation coefficients were averaged. (H) The distribution of mean AUC values between S-ICCOs and R-ICCOs (Wilcoxon rank-sum test). (I) Kaplan-Meier curves for overall survival in CPTAC cohort based on the signatures of L-ICC clusters (Log-rank test). (J) Comparisons of R-ICCOs and S-ICCOs clusters in L-ICC using representative pathways reported in CPTAC cohort. (K) Multi-omic features associated with the responses to afatinib. (L) ssGSEA scores of indicated gene sets in S-ICCOs or R-ICCOs based on the proteomics data.
Fig. 5.
Fig. 5.. Pharmaco-proteogenomic Analysis in LICOB.
(A) Circos plot showing the Elastic net prediction model for each of 76 drugs. The first inner circle represents the sensitivity of each LICOB sample, blue and pink colors represent the top sensitive and resistant samples. The second inner circle indicates AUC values for each sample. The third inner circle represent the multi-omics or single-omic data types showing the best prediction accuracy, and the outermost circle indicate the number of features in each prediction model. (B) Comparisons of drug prediction accuracies evaluated by cosine similarity and MSE. (C) Pearson correlations between predicted AUC values and measured AUC in the testing set of LICOB for indicated drugs. (D) Multi-omic features with the best prediction accuracy for sorafenib. Barplot on the left shows the coefficients of features in the model. (E) Pathways enriched by multi-omic features representing sorafenib resistance (Hypergeometric test, Benjamini-Hochberg adjusted). (F) The spearman correlation between predicted AUC values and measured AUC for lenvatinib in GDSC. (G) Multi-omic features with the best prediction accuracy for lenvatinib. Barplot on the left shows the coefficients of features in the model. (H and I) Pearson correlations between the activities of indicated pathways and AUC values of LICOB models to lenvatinib.
Fig. 6.
Fig. 6.. Drug Combination Prediction and Validation in LICOB.
(A) The workflow of drug combination prediction. (B) The drug-pathway network map for lenvatinib. Orange nodes represent predicted drugs with combination efficiency with lenvatinib, and node sizes indicate combination scores with lenvatinib. Green nodes indicate pathways connecting each pair of drug combination. (C) The predicted scores for the combination of lenvatinib and other drugs. The dot size represents the score contributed by different omics data. (D) The predicted scores of lenvatinib and temsirolimus combination for all the LICOB samples. (E) Heatmap showing the normalized abundance of phosphorylation sites, referred as phosphorylation level, in organoids treated with indicated drugs. (F) Heatmap showing lenvatinib-temsirolimus combination dose-response matrix in HCCO31. (G) Western blot analysis of the MEK-ERK cascade and AKT activation. (H and I) Drug efficacy on tumor growth in xenograft model of HCCO31 (H) and lenvatinib-resistant PDX models (I) Representative tumor xenograft images at the end of treatment (Scale bars: 1 cm) and tumor growth curves of each group are shown (Data are mean ± s.e.m., Two-way ANOVA).

Comment in

References

    1. Sung H, Ferlay J, Siegel RL, Laversanne M, Soerjomataram I, Jemal A, Bray F, Global Cancer Statistics 2020: GLOBOCAN Estimates of Incidence and Mortality Worldwide for 36 Cancers in 185 Countries. CA Cancer J Clin 71, 209–249 (2021). - PubMed
    1. Banales JM, Marin JJG, Lamarca A, Rodrigues PM, Khan SA, Roberts LR, Cardinale V, Carpino G, Andersen JB, Braconi C, Calvisi DF, Perugorria MJ, Fabris L, Boulter L, Macias RIR, Gaudio E, Alvaro D, Gradilone SA, Strazzabosco M, Marzioni M, Coulouarn C, Fouassier L, Raggi C, Invernizzi P, Mertens JC, Moncsek A, Rizvi S, Heimbach J, Koerkamp BG, Bruix J, Forner A, Bridgewater J, Valle JW, Gores GJ, Cholangiocarcinoma 2020: the next horizon in mechanisms and management. Nat Rev Gastroenterol Hepatol 17, 557–588 (2020). - PMC - PubMed
    1. Llovet JM, Kelley RK, Villanueva A, Singal AG, Pikarsky E, Roayaie S, Lencioni R, Koike K, Zucman-Rossi J, Finn RS, Hepatocellular carcinoma. Nat Rev Dis Primers 7, 6 (2021). - PubMed
    1. Liu J, Dang H, Wang XW, The significance of intertumor and intratumor heterogeneity in liver cancer. Exp Mol Med 50, e416 (2018). - PMC - PubMed
    1. Drost J, Clevers H, Organoids in cancer research. Nat Rev Cancer 18, 407–418 (2018). - PubMed

Publication types