. 2023 Sep 25;58(18):1782-1800.e10.
doi: 10.1016/j.devcel.2023.07.001. Epub 2023 Jul 25.

Parallel CRISPR-Cas9 screens identify mechanisms of PLIN2 and lipid droplet regulation

Affiliations

Parallel CRISPR-Cas9 screens identify mechanisms of PLIN2 and lipid droplet regulation

Melissa A Roberts et al. Dev Cell. .

Abstract

Despite the key roles of perilipin-2 (PLIN2) in governing lipid droplet (LD) metabolism, the mechanisms that regulate PLIN2 levels remain incompletely understood. Here, we leverage a set of genome-edited human PLIN2 reporter cell lines in a series of CRISPR-Cas9 loss-of-function screens, identifying genetic modifiers that influence PLIN2 expression and post-translational stability under different metabolic conditions and in different cell types. These regulators include canonical genes that control lipid metabolism as well as genes involved in ubiquitination, transcription, and mitochondrial function. We further demonstrate a role for the E3 ligase MARCH6 in regulating triacylglycerol biosynthesis, thereby influencing LD abundance and PLIN2 stability. Finally, our CRISPR screens and several published screens provide the foundation for CRISPRlipid (http://crisprlipid.org), an online data commons for lipid-related functional genomics data. Our study identifies mechanisms of PLIN2 and LD regulation and provides an extensive resource for the exploration of LD biology and lipid metabolism.

Keywords: CRISPR; ERAD; MARCH6; PLIN2; endoplasmic reticulum; genetic screen; lipid droplet; metabolism; perilipin; resource.


Conflict of interest statement

Declaration of interests J.A.O. is a member of the scientific advisory board for Vicinitas Therapeutics and has patent applications related to ferroptosis. M.K. is an inventor on a US patent related to CRISPRi and CRISPRa screening; serves on the scientific advisory boards of Engine Biosciences, Casma Therapeutics, Cajal Neuroscience and Alector; and is a consultant to Modulo Bio and Recursion Therapeutics. F.F. and M.A.N.’s participation in this project was part of a competitive contract awarded to Data Tecnica International LLC by the National Institutes of Health to support open science research. M.A.N. also currently serves on the scientific advisory board for Clover Therapeutics and is an advisor to Neuron23 Inc. M.C.B. has outside interest in DEM Biopharma.

Figures
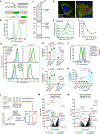
Figure 1.
Figure 1.. A genome-wide CRISPR-Cas9 screen reveals regulators of endogenously tagged PLIN2-GFP
(A) CRISPR-Cas9 strategy used to generate the PLIN2-GFP knock-in reporter cell line. (B) Flow cytometry histogram of Huh7 parental (wild type) and PLIN2-GFP knock-in cells. (C) Immunoblot of GFP, PLIN2, and GAPDH in parental and PLIN2-GFP Huh7 cells. (D) Representative fluorescence microscopy image of Huh7 PLIN2-GFP cells treated with 200 μM oleate for 24 hr. LDs were stained with 500 nM Lipi-Deep Red and nuclei with 5 μg/mL Hoechst 33342. Scale bar represents 10 μm. (E) Representative flow cytometry histograms of Huh7 PLIN2-GFP cells treated with 1 μg/ml triacsin C as indicated. (F) Quantification of mode GFP fluorescence intensity from (E). Data represent mean ± SD of three biological replicates. (G) Representative flow cytometry histograms of Huh7 PLIN2-GFP Cas9 expressing cells with no sgRNAs or sgRNAs against ABHD5 (top) or PNPLA2 (bottom). Cells were treated with 1 μg/ml triacsin C (right) or DMSO (left) for 24 hr. (H) Quantification of the fold change in mode GFP fluorescence intensity in PLIN2-GFP Cas9 cells versus cells expressing sgRNAs against ABHD5 from (G). Data represent mean ± SD of three biological replicates. ** p < 0.01, **** p < 0.0001 by one-way ANOVA with Dunnett’s multiple comparisons test. (I) Quantification of the fold change in mode GFP fluorescence intensity in PLIN2-GFP Cas9 cells versus cells expressing sgRNAs against PNPLA2 from (G). Data represent mean ± SD of three biological replicates. ** p < 0.01, **** p < 0.0001 by one-way ANOVA with Dunnett’s multiple comparisons test. (J) Representative flow cytometry histogram of Huh7 PLIN2-GFP cells treated with 1 μg/ml triacsin C or 1 μg/ml triacsin C with 10 μM MLN7243, 10 μM MG132, 50 μM leupeptin, 250 nM bafilomycin A1, 10 μM lalistat 2, or DMSO for 24 hr. (K) Quantification of fold change in mode GFP fluorescence intensity from (J). Data represent mean ± SD of three biological replicates. **** p < 0.0001 by one-way ANOVA with Šídák’s multiple comparisons test. (L) Schematic of FACS-based CRISPR-Cas9 screening workflow. (M,N) Volcano plots indicating the gene effects and gene scores for individual genes from batch retest CRISPR-Cas9 screens in Huh7 PLIN2-GFP cells under basal (C) and lipolytic (D) conditions. Gene effects and gene scores were computed from two biological replicates. See also Figure S1 and S2.
Figure 2.
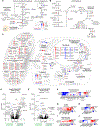
Figure 2.. CRISPR-Cas9 screen identifies cell type and metabolic state-dependent regulators of PLIN2-GFP
(A,B) Schematic of the TAG synthesis and breakdown pathways (A) and the mtFAS and lipoic acid synthesis pathways as well as downstream lipoic acid-dependent pathways (B). Genes are annotated with nodes corresponding to gene effects and scores from batch retest Huh7 PLIN2-GFP basal and lipolytic screens. (C) Cell map showing regulators of PLIN2-GFP under basal and lipolytic conditions in Huh7 cells. Map consists of the top 60 genes (ranked by gene score) from each screen and selected genes of interest that met a 10 percent false discovery rate cutoff. Cellular localizations and functional groupings are assigned based on Gene Ontology annotations and/or previous literature. (D,E) Volcano plots indicating the gene effects and gene scores for individual genes from CRISPR-Cas9 screens of HepG2 (D) and 786-O (E) PLIN2-GFP cells using the custom Lipid Droplet and Metabolism sgRNA Library. Gene effects and gene scores were computed from two biological replicates. (F-J) Heat map displaying the signed gene scores TAG biosynthesis and lipolytic genes (F), mTOR genes (G), SREBP pathway-related genes (H), mtFAS and lipoic acid synthesis genes (I), and ERAD genes (J) from Huh7, HepG2, and 786-O PLIN2-GFP screens using the custom Lipid Droplet and Metabolism sgRNA Library. See also Figure S1–S3.
Figure 3.
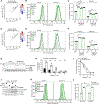
Figure 3.. Regulation of PLIN2 levels by the E3 ligase MARCH6
(A) Cloud plot indicating deep sequencing counts corresponding to MARCH6 (color scale) or negative control sgRNAs (grey scale) from one replicate of the Huh7 PLIN2-GFP basal batch retest screen from Figure 1M. (B) Representative flow cytometry histograms of Huh7 PLIN2-GFP Cas9 cells expressing no sgRNAs or three different sgRNAs against MARCH6 (knockout pools) following treatment with 1 μg/ml triacsin C or DMSO for 24 hr. (C) Quantification of the fold change in mean GFP fluorescence intensity from (B). Data represent mean ± SD of three biological replicates. **** p < 0.0001 by one-way ANOVA with Dunnett’s multiple comparisons test. (D) Cloud plot indicating deep sequencing counts corresponding to UBE2J2 (color scale) or negative control sgRNAs (grey scale) from one replicate of the Huh7 PLIN2-GFP basal batch retest screen from Figure 1N. (E) Representative flow cytometry histograms of Huh7 PLIN2-GFP Cas9 cells expressing no sgRNAs or two different sgRNAs against UBE2J2 (knockout pools) following treatment with 1 μg/ml triacsin C or DMSO for 24 hr. (F) Quantification of the fold change in mean GFP fluorescence intensity from (E). Data represent mean ± SD of three biological replicates. **** p < 0.0001 by one-way ANOVA with Dunnett’s multiple comparisons test. (G) Immunoblot of PLIN2 and GAPDH in Huh7 PLIN2-GFP Cas9 and MARCH6KO cells treated with 1 μg/ml triacsin C as indicated. (H) Quantification of the fold change in PLIN2-GFP protein levels in Cas9 and MARCH6KO cells from (G). Data represent mean ± SD of three biological replicates. **** p < 0.0001 by two-tailed, unpaired t-test. (I) Quantification of PLIN2-GFP protein levels from (G). PLIN2-GFP protein levels were normalized to levels at time 0 hr for each cell line. Data represent mean ± SD of three biological replicates. (J) Immunoblot of SQLE, PLIN2, and tubulin in Huh7 PLIN2-GFP Cas9 or MARCH6KO cells incubated with SQLE or control siRNAs for 72 hr. (K) Representative flow cytometry histograms of cells from (J). Cells were treated with 1 μg/ml triacsin C or DMSO for 24 hr. (L) Quantification of the fold change in mean GFP fluorescence intensity in vehicle-treated cells from (K). Data represent mean ± SD of three biological replicates. No significant changes were observed by two tailed, unpaired t-test. See also Figure S4.
Figure 4.
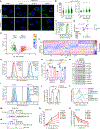
Figure 4.. The E3 ligase MARCH6 regulates neutral lipid synthesis and storage independently of PLIN2
(A) Representative confocal microscopy images of Huh7 Cas9 control cells expressing a safe-targeting guide or three independent, clonally isolated MARCH6KO cell lines (using three different MARCH6 guides). Cells were imaged at the basal state or following 8 hr of treatment with 1 μg/ml triacsin C. LDs were stained with 500 nM Lipi-Green neutral lipid stain and nuclei with 5 μg/mL Hoechst 33342. Scale bar represents 20 μm. (B) Quantification of the number (left panel) and area (right panel) of basal LDs per cell from (A). Data represent mean ± SD of three biological replicates. ****p < 0.0001 by one-way ANOVA with Dunnett’s multiple comparisons test. (C) Representative flow cytometry histograms of Huh7 PLIN2-GFP Cas9 cells expressing no sgRNAs or three different sgRNAs against MARCH6. Neutral lipids were stained with 1 μg/mL BODIPY 493/503. (D) Principal component analysis plot (PCA) of untargeted lipidomics analysis of Huh7 Cas9 control cells expressing a safe-targeting guide or three independent, clonally isolated MARCH6KO cell lines. The analysis was performed on four biological replicates. (E) Volcano plot of untargeted lipidomics analysis of Huh7 Cas9 control cells expressing a safe-targeting guide or three independent, clonally isolated MARCH6KO cell lines. The analysis was performed on four biological replicates. TG = triacylglycerol; DG = diacylglycerol; CE = cholesterol ester; PC = phosphatidylcholine; LPC = lysophosphatidylcholine; PE = phosphatidylethanolamine; PI = phosphatidylinositol; PS = phosphatidylserine; SM = sphingomyelin; ns = non-significant. (F) Heat map indicating changes in lipid species from the untargeted lipidomics analysis of cells from (E). Data are autoscaled and normalized to the average abundance of each species presented. (G) Representative flow cytometry histograms of Huh7 Cas9 control cells expressing a safe-targeting guide or three different sgRNAs against MARCH6 (left panel) or Huh7 PLIN2KO cells expressing a safe-targeting guide or three different sgRNAs against MARCH6 (right panel). Neutral lipids were stained with 100 μM MDH. (H) Quantification of the fold change in mean MDH fluorescence intensity from (G). Data represent mean ± SD of three biological replicates. ** p < 0.01, **** p < 0.0001 by one-way ANOVA with Tukey’s multiple comparisons test. (I) Representative flow cytometry histograms of Huh7 PLIN2-GFP Cas9 control and MARCH6KO cells incubated with SQLE or control siRNAs for 72 hr and treated with 1 μg/ml triacsin C or DMSO for 24 hr. Neutral lipids were stained with 100 μM MDH. (J) Quantification of the fold change in mean MDH fluorescence intensity in vehicle treated cells from (I). Data represent mean ± SD of three biological replicates. No significant changes were observed by two tailed, unpaired t-test. (K) Immunoblot of the indicated proteins in Huh7 Cas9 cells expressing a safe-targeting guide or three independent sgRNAs against MARCH6 (knockout pools). (L) Representative flow cytometry histograms of Huh7 Cas9 cells expressing a safe-targeting guide or two independent sgRNAs against MARCH6 (knockout pools). Cells were incubated with SCD1 or control siRNAs for 72 hr prior to staining in 100 μM MDH. (M) Representative thin layer chromatography (TLC) resolving esterified and free BODIPY C12 558/568 in Huh7 cells expressing a safe-targeting guide or sgRNAs against MARCH6 (guide 2 knockout pool). Cells were incubated in BODIPY C12 for the indicated times, followed by lipid extraction and TLC. (N) Representative TLC resolving esterified and free BODIPY C12 558/568 in Huh7 cells expressing a safe-targeting guide or sgRNAs against MARCH6 (guide 2 knockout pool). Cells were incubated in BODIPY C12 for 16 hr followed by triacsin C treatment for the indicated times prior to lipid extraction and TLC. (O) Quantification of esterified BODIPY C12 levels from (M). BODIPY C12 levels at each time point were quantified relative to time 0 hr for each cell line. Data represent mean ± SD of six (Cas9 cells) or three (MARCH6KO cells) biological replicates. (P) Quantification of esterified BODIPY C12 levels from (N). BODIPY C12 levels at each time point were quantified relative to the 0 hr triacsin time point for each cell line. Data represent mean ± SD of six (Cas9 cells) or three (MARCH6KO cells) biological replicates. See also Figure S5.
Figure 5.
Figure 5.. Analysis of pre- and post-translational PLIN2 regulators
(A) CRISPR-Cas9 strategy used to generate the PLIN2-GFP-P2A-BFP reporter cell line. (B) Flow cytometry histograms of Huh7 parental (wild type) and PLIN2-GFP-P2A-BFP cells. (C) Immunoblot of GFP and GAPDH in Huh7 parental and PLIN2-GFP-P2A-BFP cells. (D) Representative flow cytometry histograms of Huh7 PLIN2-GFP-P2A-BFP cells incubated in PLIN2 or control siRNAs for 72 hr. (E) Schematic of batch retest CRISPR-Cas9 screens in Huh7 PLIN2-GFP-P2A-BFP cells. (F,G) Volcano plots indicating the gene effects and gene scores for individual genes from Huh7 GFP:BFP screens under basal (F) and lipolytic (G) conditions. Gene effects and gene scores were computed from two biological replicates per screen. (H,I) Volcano plots indicating the gene effects and gene scores for individual genes from Huh7 BFP screens under basal (H) or lipolytic (I) conditions. Gene effects and gene scores were computed from two biological replicates per screen. (J,K) Heat maps displaying the signed gene scores of the top 30 enriched (J) and depleted (K) genes (GFP:BFPhigh relative to GFP:BFPlow) from the Huh7 GFP:BFP batch retest screens under basal conditions. Signed gene scores from all other Huh7 batch retest screens are included for comparison. (L,M) Heat maps displaying the signed gene scores of the top 30 enriched (L) and depleted (M) genes (BFPhigh relative to BFPlow) from the Huh7 BFP batch retest screens under basal conditions. Signed gene scores from all other Huh7 batch retest screens are included for comparison. (N-P) Heat maps displaying the signed gene scores of SREBP pathway-related genes (N), mtFAS and lipoic acid genes (O), and sterol metabolism-related genes (P) from batch retest GFP, BFP, and GFP:BFP Huh7 screens. See also Figure S6.
Figure 6.
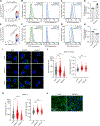
Figure 6.. The transcription factor HNF4A regulates expression of PLIN2 and lipid droplet storage
(A) Cloud plot indicating deep sequencing counts corresponding to HDAC3 (color scale) and negative control (grey) sgRNAs from one replicate of the Huh7 PLIN2-GFP batch retest screen under basal conditions. (B) Representative flow cytometry histograms of PLIN2-GFP-P2A-BFP Cas9 cells expressing a safe-targeting guide or HDAC3 sgRNA (knockout pool). (C) Representative flow cytometry histograms of Huh7 Cas9 cells expressing a safe-targeting guide or HDAC3 sgRNA (knockout pool). Neutral lipids were stained with 100 μM MDH. (D) Relative PLIN2 mRNA levels in Huh7 Cas9 cells expressing a safe-targeting guide or HDAC3 sgRNA, as measured by quantitative PCR. Data represent mean ± SD of five biological replicates. ** p < 0.01 by two tailed, unpaired t-test. (E) Cloud plot indicating deep sequencing counts corresponding to HNF4A (color scale) and negative control (grey) sgRNAs from one replicate of the Huh7 PLIN2-GFP batch retest screen under basal conditions. (F) Representative flow cytometry histograms of PLIN2-GFP-P2A-BFP Cas9 cells expressing a safe-targeting guide or HNF4A sgRNA (knockout pool). (G) Representative flow cytometry histograms of Huh7 Cas9 cells expressing a safe-targeting guide or HNF4A sgRNA (knockout pool). Neutral lipids were stained with 100 μM MDH. (H) Relative PLIN2 mRNA levels in Huh7 Cas9 cells expressing a safe-targeting guide or HNF4A sgRNA, as measured by quantitative PCR. Data represent mean ± SD of five biological replicates. **** p < 0.0001 by two tailed, unpaired t-test. (I) Representative confocal microscopy images of Cas9 control cells expressing a safe-targeting guide or sgRNAs against HDAC3 or HNF4A. Cells were imaged under basal conditions or following 8 hr of treatment with 1 μg/ml triacsin C or 200 μM oleate. Lipid droplets were stained with 500 nM Lipi-Green neutral lipid stain and nuclei with 5 μg/mL Hoechst 33342. Scale bar represents 20 μm. (J) Quantification of basal LDs per cell (left panel) and LD area (right panel) from (I). Data represent mean ± SD of two biological replicates. ****p < 0.0001 by one-way ANOVA with Dunnett’s multiple comparisons test. (K) Quantification of LDs per cell (left panel) and LD area (right panel) following treatment with 1 μg/ml triacsin C for 8 hr from (I). Data represent mean ± SD of two biological replicates. *p < 0.05, ****p < 0.0001 by one-way ANOVA with Dunnett’s multiple comparisons test. (L) Representative fluorescence microscopy image of Huh7 Cas9 cells expressing a safe-targeting guide or sgRNAs against HNF4A (knockout pool). Actin was stained with Alexa Fluor 488 Phalloidin and nuclei with DAPI. Scale bar represents 50 μm. See also Figure S7.
Figure 7.
Figure 7.. CRISPRlipid: A data commons for functional genomics screens related to lipid biology.
(A) Landing page for CRISPRlipid (crisprlipid.org), a data repository and tool for sharing, organizing, and analyzing functional genomics screens related to all aspects of lipid biology. Under ‘Browse Screens’ users can explore and search for CRISPR screens based on multiple parameters (e.g., cell type, lipid, organelle, and phenotype). Individual screen datasets (‘Simple Screens’) can be viewed one-by-one and explored with interactive tools, such as marking genes of interest on the plot or selecting subsets of genes that cluster together. Under ‘Compare Simple Screens’, two screens can be plotted on one graph for comparison based on phenotypic or confidence scores. (B-D) Scatter plot of gene scores from: (B) FACS-based PLIN2-GFP regulator screen in Huh7 cells under basal conditions (x-axis) versus lipolytic conditions (i.e., triacsin C treated, y-axis), (C) FACS-based PLIN2-GFP regulator screen in Huh7 cells (x-axis) versus palmitate survival screen in Jurkat cells (y-axis), and (D) FACS-based PLIN2-GFP regulator screen in Huh7 cells (x-axis) versus FACS-based cholesterol homeostasis screen in K562 cells (y-axis). Plots were generated using the CRISPRlipid ‘Compare Simple Screens’ tool. Color scale indicates differential p-value.

References

    1. Olzmann JA, and Carvalho P (2019). Dynamics and functions of lipid droplets. Nat Rev Mol Cell Biol 20, 137–155. 10.1038/s41580-018-0085-z. - DOI - PMC - PubMed
    1. Walther TC, Chung J, and Farese RV (2017). Lipid Droplet Biogenesis. Annu Rev Cell Dev Biol 33, 491–510. 10.1146/annurev-cellbio-100616-060608. - DOI - PMC - PubMed
    1. Renne MF, Klug YA, and Carvalho P (2020). Lipid droplet biogenesis: A mystery “unmixing”? Semin Cell Dev Biol 108, 14–23. 10.1016/j.semcdb.2020.03.001. - DOI - PubMed
    1. Thiam AR, and Ikonen E (2021). Lipid Droplet Nucleation. Trends Cell Biol 31, 108–118. 10.1016/j.tcb.2020.11.006. - DOI - PubMed
    1. Bersuker K, and Olzmann JA (2017). Establishing the lipid droplet proteome: Mechanisms of lipid droplet protein targeting and degradation. Biochim Biophys Acta Mol Cell Biol Lipids 1862, 1166–1177. 10.1016/j.bbalip.2017.06.006. - DOI - PMC - PubMed

Publication types